Enhanced Fujita scale
| EF0 | 65–85 mph | Light damage |
|---|---|---|
| EF1 | 86–110 mph | Moderate damage |
| EF2 | 111–135 mph | Considerable damage |
| EF3 | 136–165 mph | Severe damage |
| EF4 | 166–200 mph | Devastating damage |
| EF5 | >200 mph | Incredible damage |
The Enhanced Fujita scale (EF-Scale) rates the intensity of tornadoes in the United States and Canada based on the damage they cause.
Implemented in place of the Fujita scale introduced in 1971 by Tetsuya Theodore Fujita, it began operational use in the United States on February 1, 2007, followed by Canada on April 1, 2013.[1][2][3] The scale has the same basic design as the original Fujita scale—six categories from zero to five, representing increasing degrees of damage. It was revised to reflect better examinations of tornado damage surveys, so as to align wind speeds more closely with associated storm damage. Better standardizing and elucidating what was previously subjective and ambiguous, it also adds more types of structures and vegetation, expands degrees of damage, and better accounts for variables such as differences in construction quality.
The newer scale was publicly unveiled by the National Weather Service at a conference of the American Meteorological Society in Atlanta on February 2, 2006. It was developed from 2000 to 2004 by the Fujita Scale Enhancement Project of the Wind Science and Engineering Research Center at Texas Tech University, which brought together dozens of expert meteorologists and civil engineers in addition to its own resources.
As with the Fujita scale, the Enhanced Fujita scale remains a damage scale and only a proxy for actual wind speeds. While the wind speeds associated with the damage listed have not undergone empirical analysis (such as detailed physical or any numerical modeling) owing to excessive cost, the wind speeds were obtained through a process of expert elicitation based on various engineering studies since the 1970s as well as from field experience of meteorologists and engineers. In addition to damage to structures and vegetation, radar data, photogrammetry, and cycloidal marks (ground swirl patterns) may be utilized when available.
The scale was used for the first time in the United States a year after its public announcement when parts of central Florida were struck by multiple tornadoes, the strongest of which were rated at EF3 on the new scale. It was used for the first time in Canada shortly after its implementation there when a tornado developed near the town on Shelburne, Ontario on April 18, 2013, causing up to EF1 damage.
Parameters
The six categories for the EF scale are listed below, in order of increasing intensity. Although the wind speeds and photographic damage examples are updated, the damage descriptions given are those from the Fujita scale, which are more or less still accurate. However, for the actual EF scale in practice, damage indicators (the type of structure which has been damaged) are predominantly used in determining the tornado intensity.[4]
| Scale | Wind speed estimate[5] | Potential damage | Example of damage | |
| mph | km/h | |||
| EF0 | 65–85 | 105–137 | Minor damage.
Peels surface off some roofs; some damage to gutters or siding; branches broken off trees; shallow-rooted trees pushed over. Confirmed tornadoes with no reported damage (i.e., those that remain in open fields) are always rated EF0. |
.jpg) |
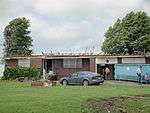
| EF1 | 86–110 | 138–177 | Moderate damage.
Roofs severely stripped; mobile homes overturned or badly damaged; loss of exterior doors; windows and other glass broken. |
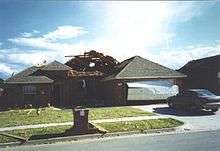 |
| EF2 | 111–135 | 178–217 | Considerable damage.
Roofs torn off from well-constructed houses; foundations of frame homes shifted; mobile homes completely destroyed; large trees snapped or uprooted; light-object missiles generated; cars lifted off ground. |
 |
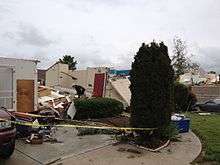
| EF3 | 136–165 | 218–266 | Severe damage.
Entire stories of well-constructed houses destroyed; severe damage to large buildings such as shopping malls; trains overturned; trees debarked; heavy cars lifted off the ground and thrown; structures with weak foundations are badly damaged. |
 |
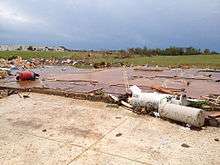
| EF4 | 166–200 | 267–322 | Devastating damage.
Well-constructed and whole frame houses completely leveled; cars and other large objects thrown and small missiles generated. |
 |
| EF5 | >200 | >322 | Incredible damage.
Strong-framed, well-built houses leveled off foundations are swept away; steel-reinforced concrete structures are critically damaged; tall buildings collapse or have severe structural deformations; some cars, trucks, and train cars can be thrown approximately 1 mile (1.6 km). |
 |
Damage indicators and degrees of damage
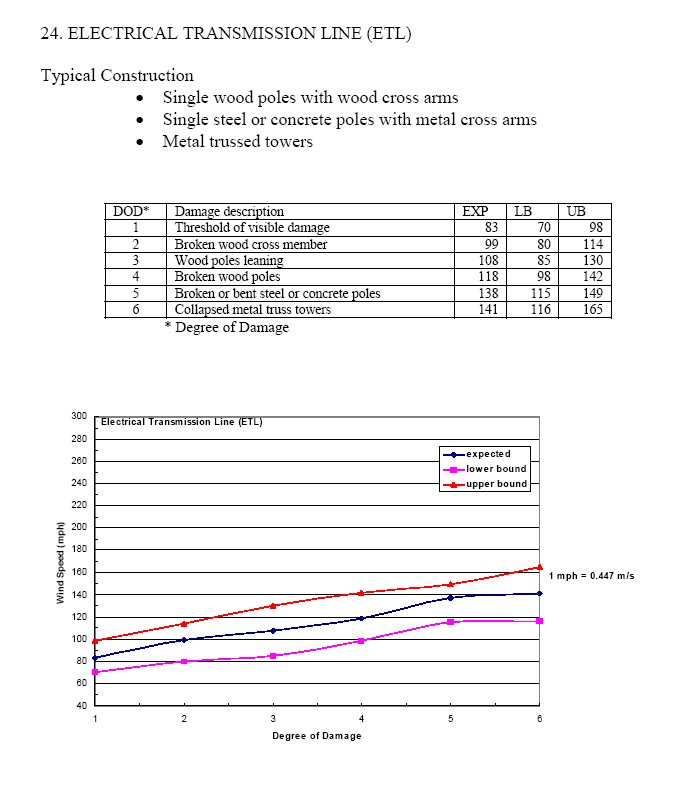
The EF scale currently has 28 damage indicators (DI), or types of structures and vegetation, each with a varying number of degrees of damage (DoD). Larger degrees of damage done to the damage indicators correspond to higher wind speeds.[6] The links in the right column of the following table describe the degrees of damage for the damage indicators listed in each row.
| DI No. | Damage indicator (DI) | Degrees of damage (DOD) |
|---|---|---|
| 1 | Small barns or farm outbuildings (SBO) | 8 |
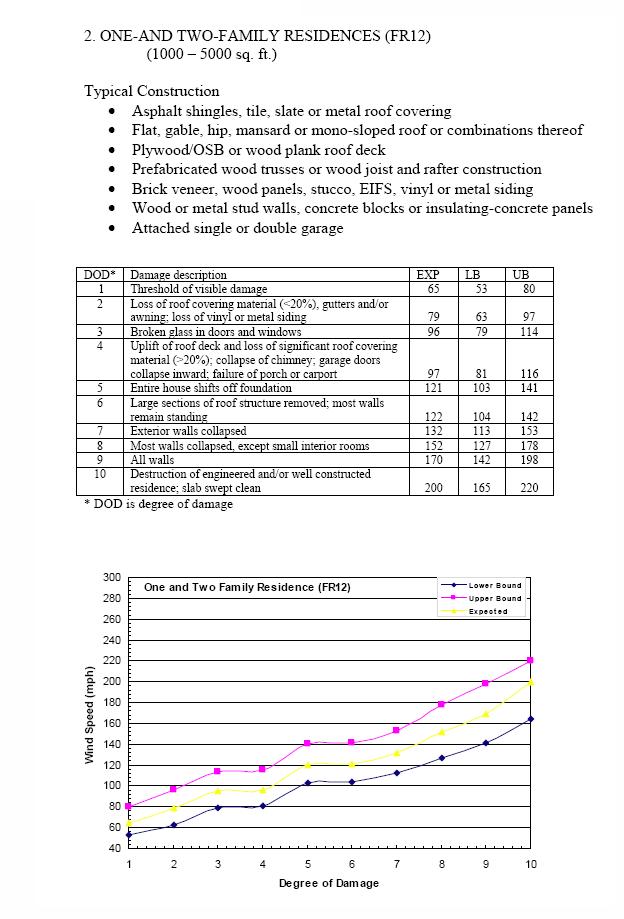
| 2 | One- or two-family residences (FR12) | 10 |
| 3 | Manufactured home – single wide (MHSW) | 9 |
| 4 | Manufactured home – double wide (MHDW) | 12 |
| 5 | Apartments, condos, townhouses [three stories or less] (ACT) | 6 |
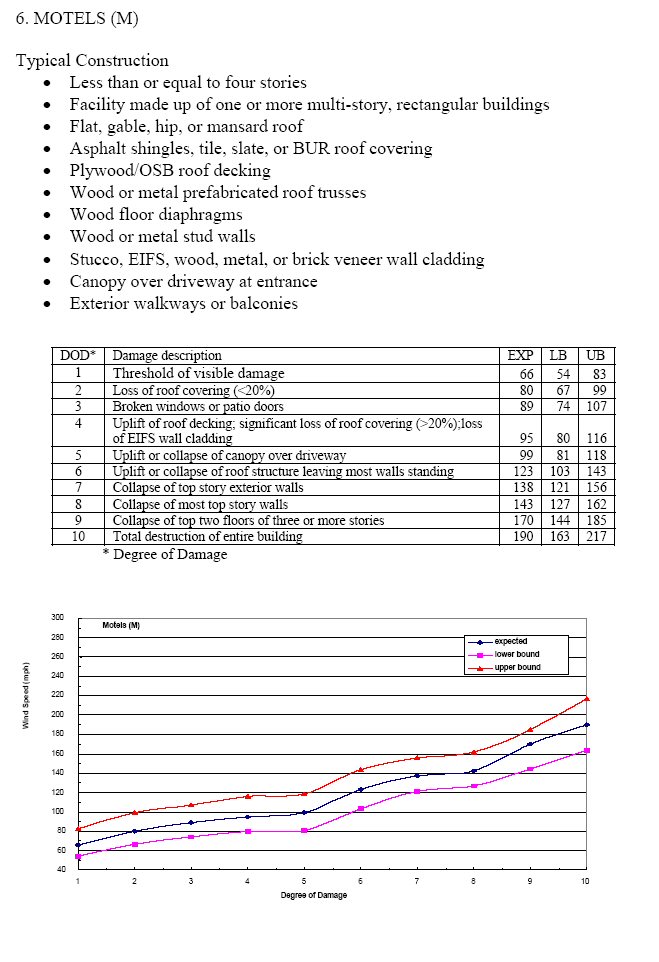
| 6 | Motel (M) | 10 |
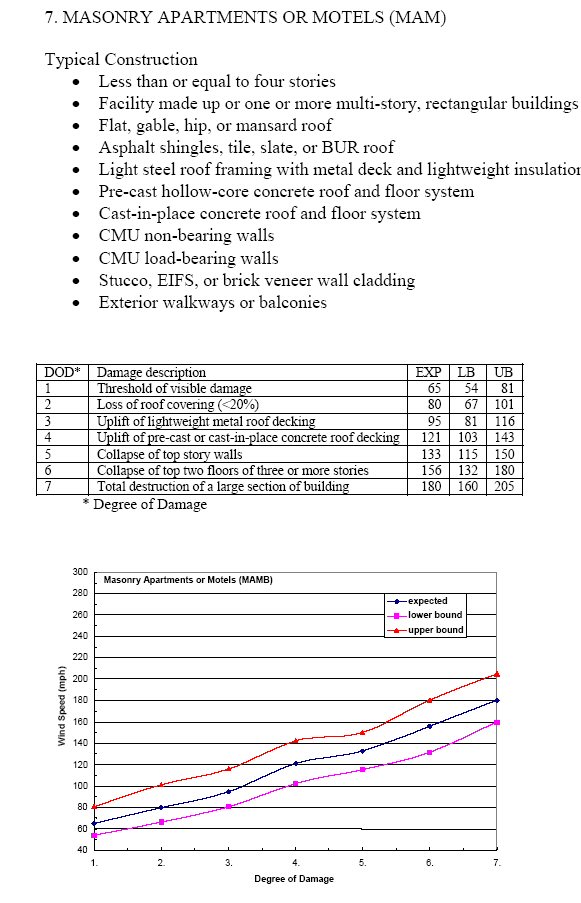
| 7 | Masonry apartment or motel building (MAM) | 7 |
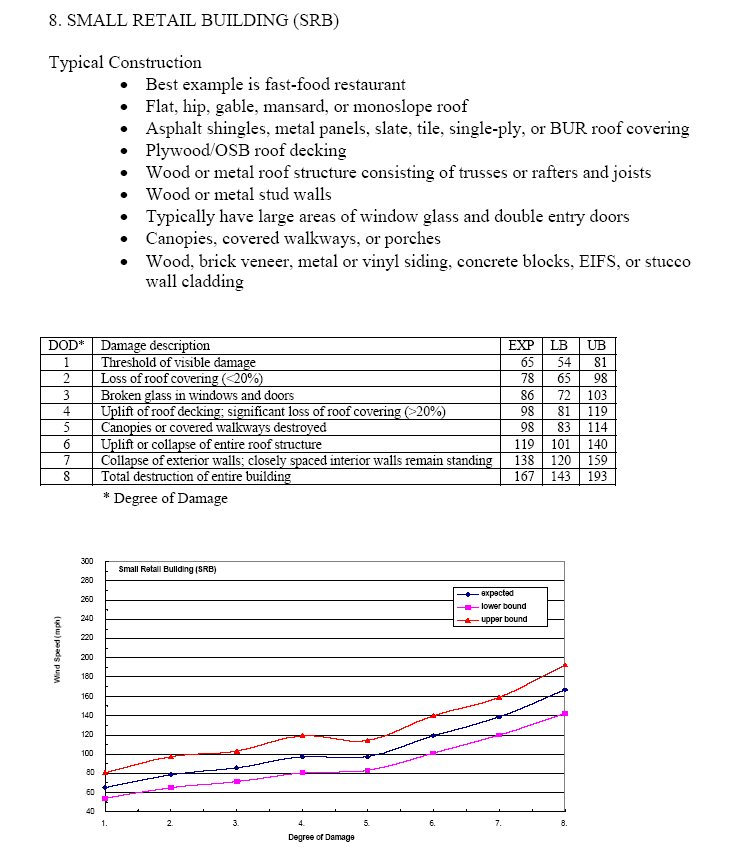
| 8 | Small retail building [fast-food restaurants] (SRB) | 8 |
| 9 | Small professional building [doctor's office, branch banks] (SPB) | 9 |
| 10 | Strip mall (SM) | 9 |
| 11 | Large shopping mall (LSM) | 9 |
| 12 | Large, isolated retail building [K-Mart, Wal-Mart] (LIRB) | 7 |
| 13 | Automobile showroom (ASR) | 8 |
| 14 | Automobile service building (ASB) | 8 |
| 15 | Elementary school [single-story; interior or exterior hallways] (ES) | 10 |
| 16 | Junior or senior high school (JHSH) | 11 |
| 17 | Low-rise building [1–4 stories] (LRB) | 7 |
| 18 | Mid-rise building [5–20 stories] (MRB) | 10 |
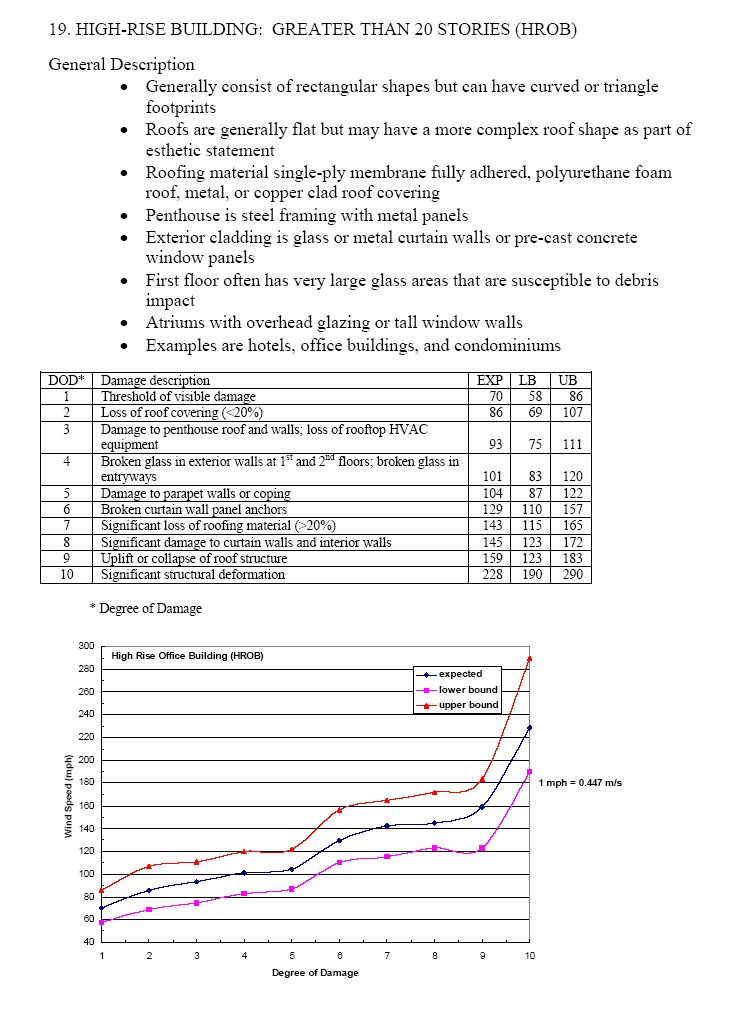
| 19 | High-rise building [more than 20 stories] (HRB) | 10 |
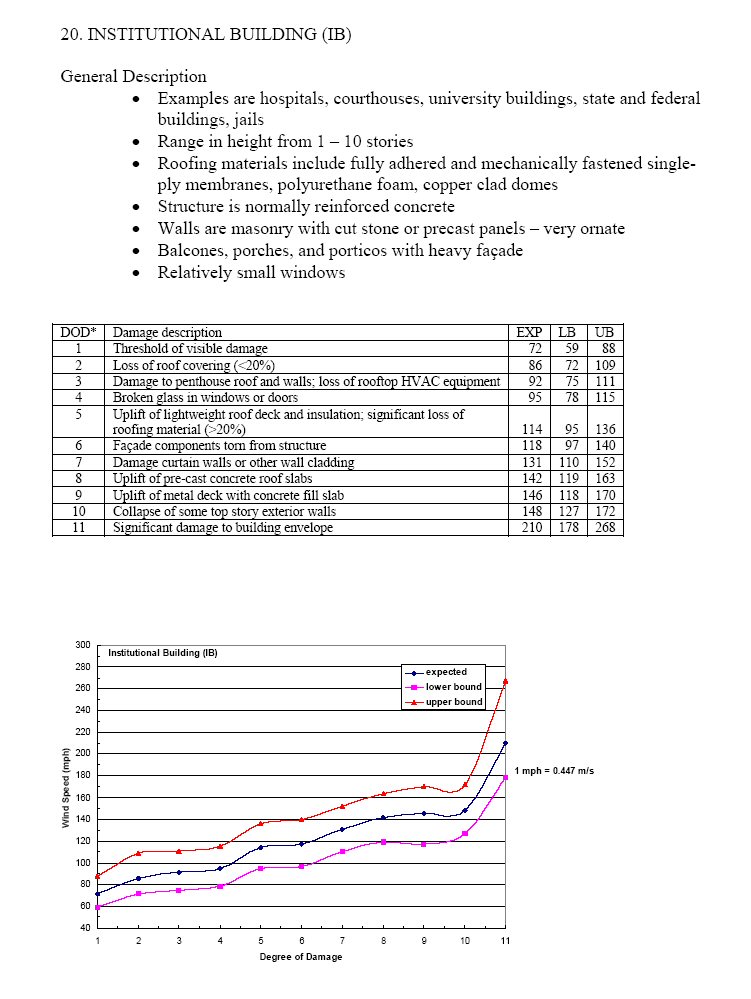
| 20 | Institutional building [hospital, government or university building] (IB) | 11 |
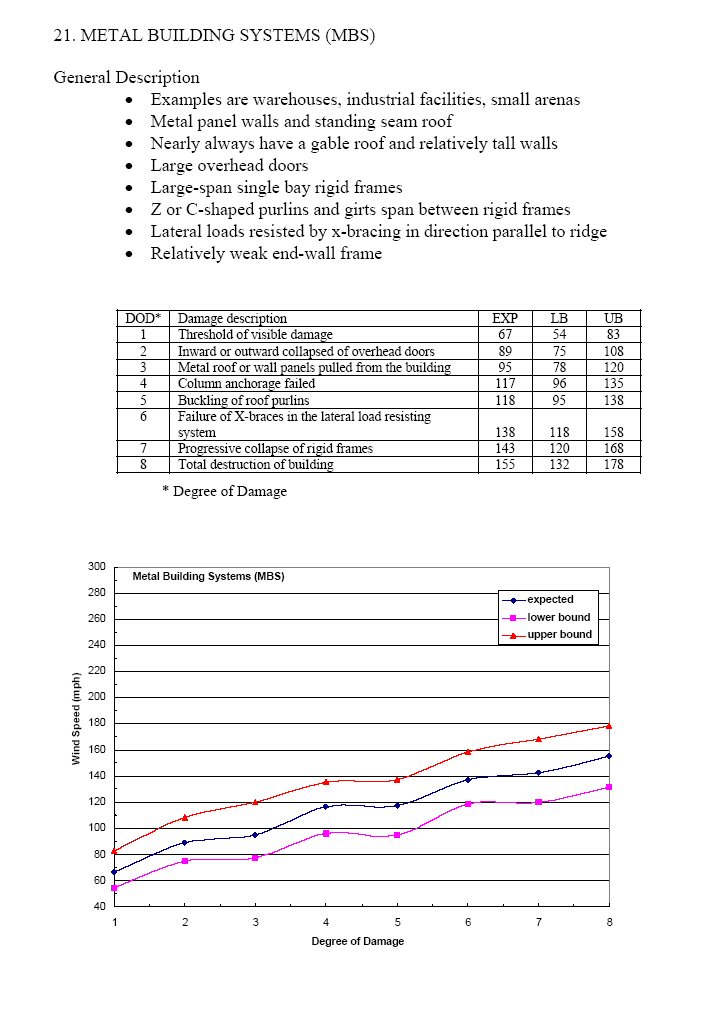
| 21 | Metal building system (MBS) | 8 |
| 22 | Service station canopy (SSC) | 6 |
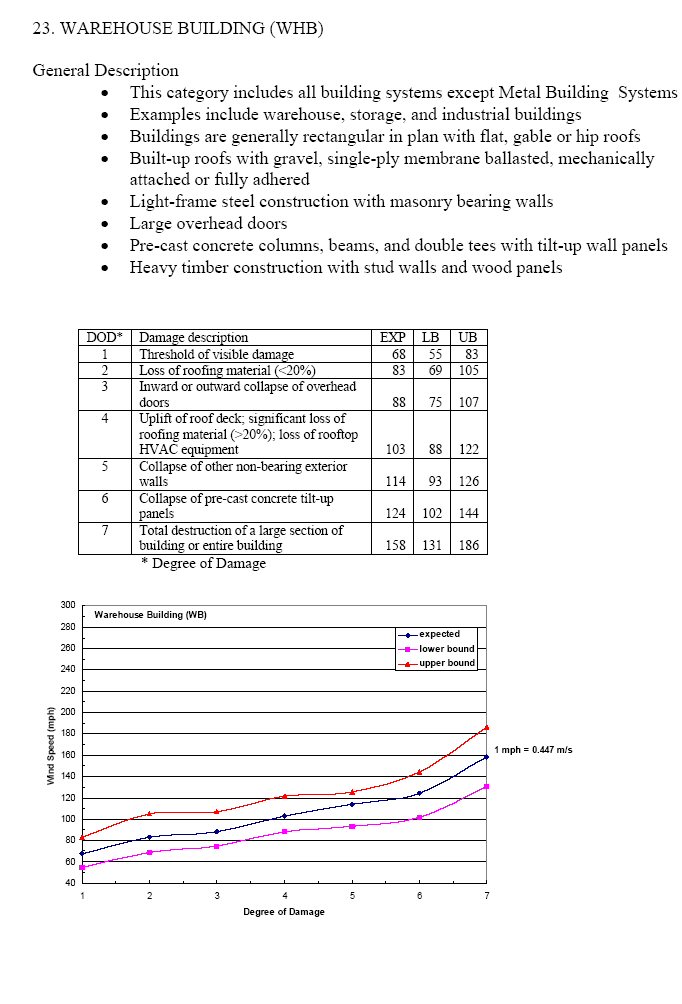
| 23 | Warehouse building [tilt-up walls or heavy-timber construction] (WHB) | 7 |
| 24 | Electrical transmission lines (ETL) | 6 |
| 25 | Free-standing towers (FST) | 3 |
| 26 | Free-standing light poles, luminary poles, flag poles (FSP) | 3 |
| 27 | Trees: hardwood (TH) | 5 |
| 28 | Trees: softwood (TS) | 5 |
Differences from the Fujita scale
The new scale takes into account quality of construction and standardizes different kinds of structures. The wind speeds on the original scale were deemed by meteorologists and engineers as being too high, and engineering studies indicated that slower winds than initially estimated cause the respective degrees of damage. The old scale lists an F5 tornado as wind speeds of 261–318 mph (420–512 km/h), while the new scale lists an EF5 as a tornado with winds above 200 mph (322 km/h), found to be sufficient to cause the damage previously ascribed to the F5 range of wind speeds. None of the tornadoes recorded on or before January 31, 2007, will be re-categorized.
Essentially, there is no functional difference in how tornadoes are rated. The old ratings and new ratings are smoothly connected with a linear formula. The only differences are adjusted wind speeds, measurements of which were not used in previous ratings, and refined damage descriptions; this is to standardize ratings and to make it easier to rate tornadoes which strike few structures. Twenty-eight Damage Indicators (DI), with descriptions such as "double-wide mobile home" or "strip mall", are used along with Degrees of Damage (DOD) to determine wind estimates. Different structures, depending on their building materials and ability to survive high winds, have their own DIs and DODs. Damage descriptors and wind speeds will also be readily updated as new information is learned.[6]
Since the new system still uses actual tornado damage and similar degrees of damage for each category to estimate the storm's wind speed, the National Weather Service states that the new scale will likely not lead to an increase in a number of tornadoes classified as EF5. Additionally, the upper bound of the wind speed range for EF5 is open—in other words, there is no maximum wind speed designated.[4]
Rating classifications
| EF0 | EF1 | EF2 | EF3 | EF4 | EF5 |
|---|---|---|---|---|---|
| Weak | Strong | Violent | |||
| Significant | |||||
| Intense | |||||
For purposes such as tornado climatology studies, Enhanced Fujita scale ratings may be grouped into classes.[7][8][9]
Usually, the classic version always suggests EF4 and EF5 are the most violent tornadoes.
The table shown to the right shows other variations of the tornado rating classifications based on certain areas.
See also
References
- ↑ NOAA: Fujita Tornado Damage Scale
- ↑ Tornado Damage Scales: Fujita Scale and Enhanced Fujita Scale
- ↑ "Enhanced Fujita Scale". Environment Canada.
- 1 2 "The Enhanced Fujita Scale (EF Scale)". Storm Prediction Center. February 2, 2007. Retrieved June 21, 2009.
- ↑ "Enhanced F Scale for Tornado Damage". Storm Prediction Center. Retrieved June 21, 2009.
- 1 2 McDonald, James; Kishor C. Mehta (October 10, 2006). A recommendation for an Enhanced Fujita scale (EF-Scale) (PDF). Lubbock, Texas: Wind Science and Engineering Research Center, Texas Tech University. Retrieved May 21, 2013.
- ↑ Grazulis, Thomas P. (July 1993). Significant Tornadoes 1680–1991. St. Johnsbury, Vermont: The Tornado Project of Environmental Films. ISBN 1-879362-03-1.
- ↑ The Fujita Scale of Tornado Intensity Archived December 30, 2011, at the Wayback Machine. at tornadoproject.com
- ↑ "Severe Thunderstorm Climatology". National Severe Storms Laboratory, National Oceanic and Atmospheric Administration, US Department of Commerce. March 29, 2013. Retrieved May 22, 2013.
- Edwards, Roger; J. G. LaDue; J. T. Ferree; K. Scharfenberg; C. Maier; W. L. Coulbourne (2013). "Tornado Intensity Estimation: Past, Present, and Future". Bull. Amer. Meteor. Soc. 94 (5): 641–53. Bibcode:2013BAMS...94..641E. doi:10.1175/BAMS-D-11-00006.1.
External links
| Wikimedia Commons has media related to Enhanced Fujita scale. |
- National Oceanic and Atmospheric Administration
- NOAA National Weather Service Improves Tornado Rating System at NOAA News
- The Enhanced Fujita Scale (EF Scale) at Storm Prediction Center
- EF-Scale Training at The Warning Decision Training Branch of National Weather Service (NWS)
- The Enhanced Fujita Tornado Scale at National Climatic Data Center
- The Tornado: An Engineering-Oriented Perspective (NWS SR147)
- A Guide for Conducting Convective Windstorm Surveys (NWS SR146)
- Fujita Scale Enhancement Project (Wind Science and Engineering Research Center at Texas Tech University)
- Symposium on the F-Scale and Severe-Weather Damage Assessment at American Meteorological Society
- A Guide to F-Scale Damage Assessment, MetEd, University Corporation for Atmospheric Research
- Mitigation Assessment Team Report: Midwest Tornadoes of May 3, 1999 (Federal Emergency Management Agency)