Decision tree

A decision tree is a decision support tool that uses a tree-like graph or model of decisions and their possible consequences, including chance event outcomes, resource costs, and utility. It is one way to display an algorithm that only contains conditional control statements.
Decision trees are commonly used in operations research, specifically in decision analysis, to help identify a strategy most likely to reach a goal, but are also a popular tool in machine learning.
Overview
A decision tree is a flowchart-like structure in which each internal node represents a "test" on an attribute (e.g. whether a coin flip comes up heads or tails), each branch represents the outcome of the test, and each leaf node represents a class label (decision taken after computing all attributes). The paths from root to leaf represent classification rules.
In decision analysis, a decision tree and the closely related influence diagram are used as a visual and analytical decision support tool, where the expected values (or expected utility) of competing alternatives are calculated.
A decision tree consists of three types of nodes:[1]
- Decision nodes – typically represented by squares
- Chance nodes – typically represented by circles
- End nodes – typically represented by triangles
Decision trees are commonly used in operations research and operations management. If, in practice, decisions have to be taken online with no recall under incomplete knowledge, a decision tree should be paralleled by a probability model as a best choice model or online selection model algorithm. Another use of decision trees is as a descriptive means for calculating conditional probabilities.
Decision trees, influence diagrams, utility functions, and other decision analysis tools and methods are taught to undergraduate students in schools of business, health economics, and public health, and are examples of operations research or management science methods.
Decision tree building blocks
Decision tree elements
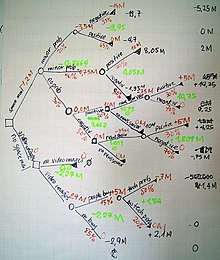
Drawn from left to right, a decision tree has only burst nodes (splitting paths) but no sink nodes (converging paths). Therefore, used manually, they can grow very big and are then often hard to draw fully by hand. Traditionally, decision trees have been created manually — as the aside example shows — although increasingly, specialized software is employed.
Decision rules
The decision tree can be linearized into decision rules,[2] where the outcome is the contents of the leaf node, and the conditions along the path form a conjunction in the if clause. In general, the rules have the form:
- if condition1 and condition2 and condition3 then outcome.
Decision rules can be generated by constructing association rules with the target variable on the right. They can also denote temporal or causal relations.[3]
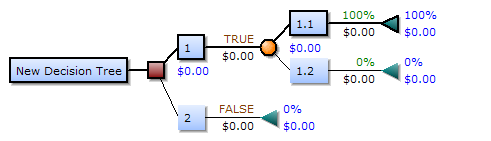
Decision tree using flowchart symbols
Commonly a decision tree is drawn using flowchart symbols as it is easier for many to read and understand.

Analysis example
Analysis can take into account the decision maker's (e.g., the company's) preference or utility function, for example:
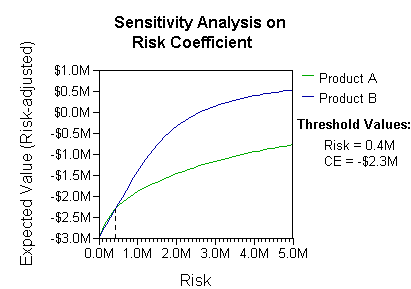
The basic interpretation in this situation is that the company prefers B's risk and payoffs under realistic risk preference coefficients (greater than $400K—in that range of risk aversion, the company would need to model a third strategy, "Neither A nor B").
Another example, commonly used in operations research courses, is the distribution of lifeguards on beaches (a.k.a. the "Life's a Beach" example).[4] The example describes two beaches with lifeguards to be distributed on each beach. There is maximum budget B that can be distributed among the two beaches (in total), and using a marginal returns table, analysts can decide how many lifeguards to allocate to each beach.
| Lifeguards on each beach | Drownings prevented in total, beach #1 | Drownings prevented in total, beach #2 |
|---|---|---|
| 1 | 1 | 3 |
| 2 | 4 | 0 |
In this example, a decision tree can be drawn to illustrate the principles of diminishing returns on beach #2.
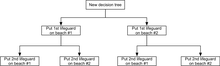
The decision tree illustrates that when sequentially distributing lifeguards, placing a first lifeguard on beach #1 would be optimal if there is only the budget for 1 lifeguard. But if there is a budget for two guards, then placing both on beach #2 would prevent more overall drownings.

Influence diagram
Much of the information in a decision tree can be represented more compactly as an influence diagram, focusing attention on the issues and relationships between events.

Association rule induction
Decision trees can also be seen as generative models of induction rules from empirical data. An optimal decision tree is then defined as a tree that accounts for most of the data, while minimizing the number of levels (or "questions").[5] Several algorithms to generate such optimal trees have been devised, such as ID3/4/5,[6] CLS, ASSISTANT, and CART.
Advantages and disadvantages
Among decision support tools, decision trees (and influence diagrams) have several advantages. Decision trees:
- Are simple to understand and interpret. People are able to understand decision tree models after a brief explanation.
- Have value even with little hard data. Important insights can be generated based on experts describing a situation (its alternatives, probabilities, and costs) and their preferences for outcomes.
- Help determine worst, best and expected values for different scenarios.
- Use a white box model. If a given result is provided by a model.
- Can be combined with other decision techniques.
Disadvantages of decision trees:
- They are unstable, meaning that a small change in the data can lead to a large change in the structure of the optimal decision tree.
- They are often relatively inaccurate. Many other predictors perform better with similar data. This can be remedied by replacing a single decision tree with a random forest of decision trees, but a random forest is not as easy to interpret as a single decision tree.
- For data including categorical variables with different number of levels, information gain in decision trees is biased in favor of those attributes with more levels.[7]
- Calculations can get very complex, particularly if many values are uncertain and/or if many outcomes are linked.
See also
References
- ↑ Kamiński, B.; Jakubczyk, M.; Szufel, P. (2017). "A framework for sensitivity analysis of decision trees". Central European Journal of Operations Research. doi:10.1007/s10100-017-0479-6.
- ↑ Quinlan, J. R. (1987). "Simplifying decision trees". International Journal of Man-Machine Studies. 27 (3): 221. doi:10.1016/S0020-7373(87)80053-6.
- ↑ K. Karimi and H.J. Hamilton (2011), "Generation and Interpretation of Temporal Decision Rules", International Journal of Computer Information Systems and Industrial Management Applications, Volume 3
- ↑ Wagner, Harvey M. (1975-09-01). Principles of Operations Research: With Applications to Managerial Decisions (2nd ed.). Englewood Cliffs, NJ: Prentice Hall. ISBN 9780137095926.
- ↑ R. Quinlan, "Learning efficient classification procedures", Machine Learning: an artificial intelligence approach, Michalski, Carbonell & Mitchell (eds.), Morgan Kaufmann, 1983, p. 463-482. doi:10.1007/978-3-662-12405-5_15
- ↑ Utgoff, P. E. (1989). Incremental induction of decision trees. Machine learning, 4(2), 161-186. doi:10.1023/A:1022699900025
- ↑ Deng,H.; Runger, G.; Tuv, E. (2011). Bias of importance measures for multi-valued attributes and solutions (PDF). Proceedings of the 21st International Conference on Artificial Neural Networks (ICANN).
External links
| Wikimedia Commons has media related to decision diagrams. |