Dark Energy Survey
|
Dark Energy Survey logo | |
| Alternative names | DES |
|---|---|
| Survey type |
Astronomical survey |
| Target |
Dark energy |
| Observations |
Cerro Tololo Inter-American Observatory |
| Website |
www |
|
| |
| Part of a series on | ||||
| Physical cosmology | ||||
|---|---|---|---|---|
 | ||||
|
Early universe
|
||||
|
Components · Structure
|
||||
| ||||
| see § List of discovered minor planets |
The Dark Energy Survey (DES) is a visible and near-infrared survey that aims to probe the dynamics of the expansion of the Universe and the growth of large-scale structure.[2] The collaboration is composed of research institutions and universities from the United States,[3] Brazil,[4] the United Kingdom, Germany, Spain, and Switzerland.
The survey uses the 4-meter Victor M. Blanco Telescope located at Cerro Tololo Inter-American Observatory (CTIO) in Chile, outfitted with the Dark Energy Camera (DECam).[5] This camera allows for more sensitive images in the red part of the visible spectrum and in the near infrared, in comparison to previous instruments.[5]
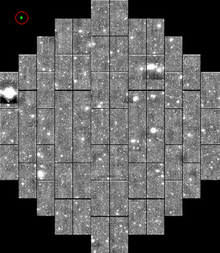
DECam has one of the widest fields of view (2.2-degree diameter) available for ground-based optical and infrared imaging.[5] The survey will image 5,000 square degrees of the southern sky in a footprint that overlaps with the South Pole Telescope and Stripe 82 (in large part avoiding the Milky Way). The survey will take five years to complete, and the survey footprint will nominally be covered ten times in five photometric bands (g, r, i, z, and Y). DES officially began in August 2013 and completed its second season in February 2015.
Overview
The Dark Energy Survey investigates the dynamics and large scale structure of the Universe using four probes: Type Ia supernovae, baryon acoustic oscillations (BAO), the number of galaxy clusters, and weak gravitational lensing.
Type Ia supernovae are believed to be thermonuclear explosions that occur when white dwarf stars in binary systems accrete mass from their companion stars.[6] These events are important for the study of cosmology because they are very bright, which allows astronomers to detect them at very large distance. The expansion of the universe can be constrained based on observations of the luminosity distance and redshift of distant type IA supernova. The other three techniques (BAO, galaxy clusters, and weak lensing) used by the Dark Energy Survey allow scientists to understand simultaneously the expansion of the universe and the evolution of the dark matter density field perturbations. These perturbations were intrinsically tied to the formation of galaxies and galaxy clusters. The standard model of cosmology assumes that quantum fluctuations of the density field of the various components that were present when our universe was very young were enhanced through a very rapid expansion called inflation. Gravitational collapse enhances these initial fluctuation as baryons fall into the gravitational potential field of more dense regions of space to form galaxies. Nevertheless, the growth rate of these dark matter halos is sensitive to the dynamics of the expansion of the Universe and DES will use this connection to probe the properties of that expansion.
DECam, the new camera installed at the Victor M. Blanco Telescope by the DES collaboration, brings new observational possibilities that were not available for previous surveys, such as the Sloan Digital Sky Survey. One significant difference between previous CCD at the Victor M. Blanco Telescope and DECam is the improved quantum efficiency in the red part of the visible spectra and in the near infrared.[7][8] This is a very important property for the observation of very distant sources, like Type IA supernovae or galaxy cluster, because the expansion of the universe shifts the photons emitted from a given source towards redder wavelengths. On the other hand, Silicon, which is the main element used to make CCDs, becomes transparent for infrared light, and this issue made the development of the DECam CCD a technological challenge.[7][8]
The director of DES is Josh Frieman and the collaboration is composed of many research institutes and universities.[9] The DES collaboration itself is divided into a number of science working groups. Some of the primary working groups are: the weak lensing working group, the galaxy clusters working group, the large-scale structure working group, the supernova working group, the galaxy evolution working group, and the strong lensing working group. Other science topics include simulations, calibration, photometric redshifts, quasars, and Milky Way science. A large responsibility of the DES collaboration was the mechanical, electronic and optical development of the DECam. The collaboration has a website,[10] where scientist can release new results, presentations and articles. Some of the releases in this website are open for the general public.
DECam
DECam is a large camera built to replace the previous prime focus camera on the Victor M. Blanco Telescope. The camera consists of three major components: mechanics, optics, and CCDs.
Mechanics
The mechanics of the camera consists of a filter changer with an 8-filter capacity and shutter. There is also an optical barrel that supports 5 corrector lenses, the largest of which is 98 cm in diameter. These components are attached to the CCD focal plane which is cooled to −100 °C with liquid nitrogen in order to reduce thermal noise in the CCDs. The focal plane is also kept in an extremely low vacuum of 10−6 Torr to prevent the formation of condensation on the sensors. The entire camera with lenses, filters, and CCDs weighs approximately 4 tons. When mounted at the prime focus it will be supported with a hexapod system allowing for real time focal adjustment.
Optics
The camera is outfitted with u, g, r, i, z, and Y filters[11] similar to those used in the Sloan Digital Sky Survey (SDSS). This allows DES to obtain photometric redshift measurements to z≈1, using the 400 nm break for galaxies, a step-like spectral feature that occurs due to a number of absorption lines from ionized metals, and light curve fitting techniques for Type Ia supernova. DECam also contains five lenses acting as corrector optics to extend the telescope's field of view to a diameter of 2.2°.
CCDs
The scientific sensor array on DECam is an array of 62 2048×4096 pixel back-illuminated CCDs totaling 520 megapixels; an additional 12 2048×2048 pixel CCDs (50 Mpx) are used for guiding the telescope, monitoring focus, and alignment. The full DECam focal plane contains 570 megapixels. The CCDs for DECam use high resistivity silicon manufactured by Dalsa and LBNL with 15×15 micron pixels. By comparison the OmniVision Technologies back-illuminated CCD that was used in the iPhone 4 has a 1.75×1.75 micron pixel with 5 megapixels. The larger pixels allow DECam to collect more light per pixel, improving low light sensitivity which is desirable for an astronomical instrument. DECam's CCDs also have a 250 micron crystal depth; this is significantly larger than most consumer CCDs. The additional crystal depth increases the path length travelled by entering photons. This in turn increases the probability of interaction and allows the CCDs to have an increased sensitivity to lower energy photons, extending the wavelength range to 1050 nm. Scientifically this is important because it allows one to look for objects at a higher redshift, increasing statistical power in the studies mentioned above. When placed in the telescope's focal plane each pixel has a width of 0.263″ on the sky, resulting in a total field of view of 3 square degrees.
Survey
The DES collaboration plans to complete a 5000-square-degree survey in the southern sky spread out over 5 years. The survey is planned to reach a depth of 24th magnitude in i band over the entire area. The survey area was chosen to overlap with the survey area of the South Pole Telescope because its technique of finding clusters through the SZ effect complements the optical techniques employed by DES. The survey area also overlaps with the survey areas for SDSS and the Vista Hemisphere Survey because these surveys can provide more information about the galaxies imaged by DES.[12] Within the 5000-square-degree area there are five smaller patches totaling 30 square degrees which will use longer exposure times and faster observing cadence to search for supernovae.
First light was achieved on 12 September 2012;[13] after a verification and testing period, scientific survey observations started in August 2013.[14] DES observes about 105 nights per season, lasting from August to February. DES has now completed image taking for two seasons, Year 1 (August 2013-February 2014) and Year 2 (August 2014-February 2015).
Supernovae
Applications in cosmology
Astrophysicists first discovered cosmic acceleration by examining the apparent brightness of tens of distant Type Ia supernovae, exploding stars that briefly become as bright as an entire galaxy of billions of stars.[15] In current leading models of Type Ia supernovae, the explosions occur when a binary white dwarf star accretes matter from its companion star, becomes unstable (the mass limit when the star becomes unstable is still in dispute), and is disrupted by a gigantic thermonuclear explosion. Although there are some variations, most Type Ia supernovae have a characteristic light curve—the graph of luminosity as a function of time—with a maximum absolute magnitude of about -19.3. This homogeneity and brightness makes them one of the best standard candles to determine distances.
To determine if the expansion rate of the universe is speeding up or slowing down over time, cosmologists make use of the finite velocity of light. It takes billions of years for light from a distant galaxy to reach the Earth. Since the universe is expanding, the universe was smaller (galaxies were closer together) when light from distant galaxies was emitted. If the expansion rate of the universe is speeding up due to dark energy, then the size of the universe increases more rapidly with time than if the expansion were slowing down. Using supernovae, we cannot quite measure the size of the universe versus time. Instead we can measure the size of the universe (at the time the star exploded) and the distance to the supernova. With the distance to the exploding supernova in hand, astronomers can use the value of the speed of light along with the theory of General Relativity to determine how long it took the light to reach the Earth. This then tells them the age of the universe when the supernova exploded.
Supernova data
To determine distances, cosmologists use the fact that Type Ia supernovae are standard candles: exploding stars of this type all have nearly the same absolute brightness or luminosity when they reach their brightest phase. By comparing the apparent brightness of two supernovae (called the distance modulus), we can thus determine their relative distances.
- , where m is the apparent brightness, M is the absolute magnitude, and is the luminosity distance to the light source in units of megaparsecs (Mpc).


This is similar to using the apparent brightness of a car’s headlights at night to estimate how far away it is: because light obeys an inverse-square law, a car 200 meters away from an observer will appear to have headlights four times dimmer than an identical car placed 100 meters away. Type Ia supernovae are the cosmic equivalent of cars with the same wattage of headlights.
To determine the second piece of the puzzle, the size of the universe at the time of explosion, astronomers measure the redshifts of supernovae from their known spectral lines and from the emission lines in the spectrum of host galaxies. When a supernova explodes, it emits light in the form of a wave. As the light wave travels towards the Earth over billions of years, the universe continues to expand, stretching this traveling wave as it does. The more the universe has expanded between the explosion and when we see the light with our telescopes, the greater the increase in the wavelength of the light. The visible light with the longest wavelength is the colour red, so this process of increasing wavelength of the light wave is referred to as "redshifting". (For additional information on redshifts in DES, click here.)
According to Friedmann-Lemaître-Robertson-Walker metric, the luminosity distance in a flat universe, , at a given redshift depends on the composition of our Universe and its corresponding expansion history:

where is the luminosity distance, z is the redshift, c is the speed of light, is the local expansion rate, is the matter content of the universe, is the dark energy content of the universe, due to curvature, and is the dark energy equation of state parameter. For different models of Universe, we can thus infer the luminosity distance relationship with redshift respectively. Comparing the redshift with the distance for a large number of supernovae, we can derive the history of the cosmic expansion rate (see the Hubble diagram on the upper right). In 1998, such measurements were first reported for supernovae at large distances, those which exploded when the universe was only two-thirds its present size. These supernovae appeared about 25% fainter, that is, farther away, than expected, an effect attributed to the speed-up of cosmic expansion over the last several billion years.[15]


Controlling and calibration systematic effects are important for type Ia supernovae to be used as standard candles for cosmological analysis. One major issue that astronomers must wrestle with is the effect of dust extinction, the absorption of light by dust particles along the observational line of sight on the luminosity of the type Ia supernova. By analyzing measurements from a number of bands, as well as selecting regions of the sky for observation that are known to suffer from less dust extinction such as the poles of the Milky Way, the effects of dust can be understood.
Supernovae measurements in DES
A number of ambitious cosmological Supernova surveys, including the CFHT SNLS, ESSENCE, and SDSS-II SN, as well as several nearby searches have created a Hubble diagram out to redshift z ~ 1. Furthermore, searches using the Hubble Space Telescope are extending the SN Hubble diagram beyond z ~ 1. Upon these ground-based surveys, the Dark Energy Survey will continue this examination by discovering and making detailed measurements of several thousand supernovae with the aims of improving both the statistical precision of supernova cosmology and the control of systematic errors in using supernovae to measure distances. The Dark Energy Survey will measure the brightness of around 3,500 Type Ia supernovae. These supernovae are billions of light years distant from Earth. When the most distant ones DES will study exploded, the universe was only about half as big as it is now. The Dark Energy Survey will repeatedly observe 30 square degrees of the sky, divided into two deep and eight shallow fields, leading to the discovery of approximately 6,000 supernovae, roughly two-thirds of which will have sufficient data from which distance measurements can be made.
Baryon Acoustic Oscillations (BAO)
Overview of physics
Baryon Acoustic Oscillations (BAO) refer to oscillations within the baryon-photon plasma that filled the early universe. The presence of these oscillations imparted a characteristic signal in the density field of matter that can be seen today in the clustering of structure in the universe. The length scale at which this signal occurs throughout the universe can be used as a Standard ruler to constrain cosmology, and in particular, the evolution of dark energy. Measurements of BAO form a key part of the observation program of the Dark Energy Survey.
Before roughly 380,000 years after the big bang, the universe was a hot, dense plasma consisting almost entirely of photons, electrons and protons (the last two of these components are often referred to collectively as baryons, although technically this is a misnomer). The high temperature of the universe during this epoch prevented electrons and protons from combining to form neutral atoms. A consequence of the high degree of ionization of the universe was that baryons remained tightly coupled to photons through Thomson scattering. The tight coupling to photons created a source of pressure for the baryons, driving them apart, while the gravitational field of the plasma and dark matter acted to pull the baryons together. This competition between forces (pressure and gravity) enabled the photon-baryon plasma to support pressure waves which were sourced by the initial perturbations in the density field.
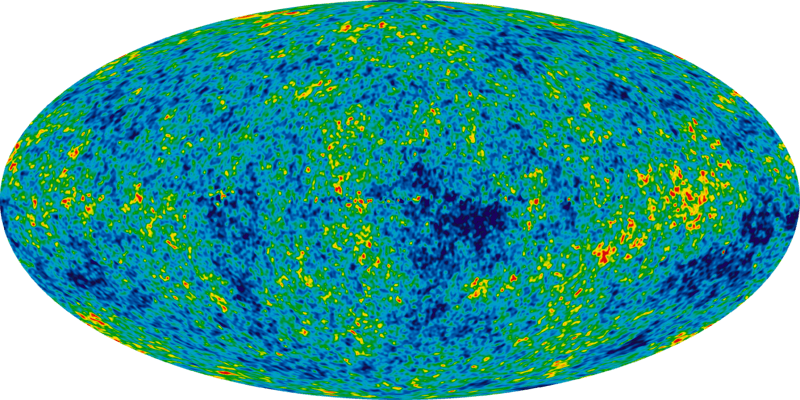
When recombination occurred at roughly 380,000 years after the big bang, the photons and baryons decoupled from one another and the plasma lost its ability to support sound waves. One consequence of this decoupling was that the oscillations in the photon-baryon plasma were imprinted on the photon fluid; these are the oscillations that we observe in the Cosmic Microwave Background (CMB) angular power spectrum. Another consequence of the decoupling was that the baryons lost their pressure support and began to collapse into gravitational potential wells. This somewhat abrupt change imparted a slight over-density of matter on the length scale given by the distance that sound waves could have traveled since the big bang, i.e. the sound horizon. In today’s universe, this length scale corresponds to roughly 100 Mpc, and the effect can be observed by looking for oscillations in the matter power spectrum, .

BAO as a tool for cosmology
Measurement of BAO are an important tool for probing cosmology, and in particular the evolution of dark energy. As described above, BAO imparts a characteristic signal in the matter power spectrum on the scale of the sound horizon at recombination. This signal in the power spectrum can be used as a standard ruler to map out the evolution of the Hubble parameter, , and the angular diameter distance with redshift. This in turn constrains the properties of dark energy and other cosmological parameters.


The angle subtended by a standard ruler as a function of redshift is related to the Hubble parameter, through the concept of the angular diameter distance. The angular diameter distance, , is defined as

- ,

where is the physical extent of the standard ruler and is its observed angular extent. can also be expressed as an integral over :


- .

For the case of BAO, the physical size, , of the standard ruler (i.e. the sound horizon at recombination) can be constrained from the CMB-based measurements of and . As the equation above shows, by measuring the angle subtended by the standard ruler as a function of redshift, one is effectively measuring the integral of over redshift. Furthermore, the redshift interval, , extended by the standard ruler is directly related to the Hubble constant: . Thus, in principle one can also gain a direct measure of H(z) by measuring this redshift interval . For the DES, however, the errors in the photometric redshifts will be too large to make a determination of H(z) in this way possible. Because dark energy affects the expansion history of the universe, measuring H(z) can help to constrain the properties of this mysterious component of the universe.


The steps needed to constrain cosmology from BAO observations are therefore:[16]
- Conduct a survey of tracers of the matter density field (e.g. galaxies)
- Compute the power spectrum of the matter density field at different redshifts from these observations
- Measure the angle subtended by the BAO sound horizon feature in the matter power spectrum at different redshifts (and, if possible, the redshift interval associated with the sound horizon)
- Compute (and thus the integral of and use to constrain cosmology

One important caveat relating to the first step above is that the survey must be large enough to actually encompass the sound horizon scale. As mentioned above, this scale corresponds to distance of roughly 100 Mpc today. Early surveys such as the CfA2 redshift survey covered volumes too small to make significant detections of the BAO feature. More recent surveys, such as the Sloan Digital Sky Survey, and future surveys, such as DES, cover sufficient volume to make the measurement possible.
There are a number of qualities that make BAO a useful tool for probing cosmology. For one, the ideas behind the technique are simple: there is a straightforward relationship between the physical size of the BAO feature, its observed angular size, and the cosmological terms. Secondly, doing cosmology with BAO requires only a large volume survey. Such surveys have been common in astronomy for years. Finally, BAO provides test of cosmology that is independent of other constraints.
There are also a number of significant challenges inherent to the BAO observation program. For one, measurements of BAO at redshifts less than about 0.3 are impossible because the volume contained within this redshift is too small to fully sample the BAO feature. Another complication is that the BAO feature in the power spectrum is affected by non-linear evolution of the matter density field. As structure in the universe grows, it causes a widening of the BAO feature in the power spectrum, and an increase of power on smaller scales.[16] These effects must be accounted for when using BAO to constrain cosmology. BAO observations are also complicated by the common tracers of the matter density field such as galaxies being biased: they tend to be in places where the matter density is highest. This bias must be taken into account in order for BAO to be used to constrain cosmology. Despite these complications, BAO remains an attractive tool for cosmology.
BAO observations in DES
.jpg)

The sample of 300 million galaxies with accurate photometric redshifts, ~ 0.08, up to z ~ 1.4 provided by DES is well suited for measurement of BAO to study dark energy. The survey volume is 20 times that of SDSS photometric LRGs, enabling much higher precision measurements over a much wider redshift range. DES will measure the clustering on the sky of hundreds of millions of galaxies at different distances from us. These measurements will determine the angular scale of the sound horizon for galaxies at different redshifts. Combining those measurements together will provide information on the history of the cosmic expansion rate that complements the Type Ia supernova measurements. Defining a pivot epoch, , at which the uncertainty in the dark energy equation of state is minimized for a given measurement, the figure of merit (FoM), which is proportional to the reciprocal of the area in the plane that encloses the 95% CL region, is . Based on the fiducial cosmological model and some assumptions, the constrains of parameters can be calculated and confined.


![{[\sigma {(w_{{p}})}\sigma {(w_{{a}})}]}^{{-1}}](../I/m/cc11bdbcf03acf6e9322645107fc512c3c3b714f.svg)
The main theoretical uncertainties in the interpretation of BAO measurements are the effects of nonlinear gravitational evolution and of scale-dependent bias between galaxies and dark matter. Non-linear evolution erases the acoustic oscillations on small scales, while both non-linear mode coupling and scale-dependent bias can shift the positions of the BAO features. Scale-dependent bias on large scales is potentially more of a concern for interpreting the broad-band power spectrum shape than for the BAO signal. Simulations that will become available over the next few years, should enable us to calculate the corrections due to non-linearity and scale-dependent bias to sufficient accuracy that the remaining systematic uncertainty will be small compared to the DES statistical errors on large scales. In addition, since the bispectrum(The Fourier transform of the second-order cumulant used to search for nonlinear interactions) responds to non-linearity and bias differently from the power spectrum, measurement of the angular bispectrum shape in DES will provide a cross-check on these effects, constrain this scale-dependence and determine the efficacy and robustness of including the broad-band shape in constraining dark energy.
BAO are in principle sensitive to the uncertainty in the variance, , and in the bias, , of the photo-z estimates in redshift bins. To ensure that the dark energy parameter constraints aren't degraded (i.e., the errors increased) by no more than 10%, these uncertainties in z and per redshift bin of 0.1 must be kept below ~ 0.01 (for ) and ~ 0.005 (for ). These performance levels should be conserved in DES, and the BAO constraints are therefore expected to be quite insensitive to uncertainties in photo-z parameters.


Photometric zero-point drift affects the number density of galaxies in each redshift bin that lie above the detection threshold. The DES survey strategy, with its multiple overlapping tiles, is designed to minimize photometric drifts and to make them negligible on the scale of the DECam field of view. In addition to direct control from the tiling strategy, DES has a number of internal cross-checks on such drifts, including the redshift evolution of the BAO and matter-radiation scales, cross-correlations between different photo-z bins, consistency with the angular bispectrum, and comparison of the power spectrum shape and features for different galaxy-type subsamples.
Galaxy cluster counts
An important probe of dark energy comes from counting galaxy clusters. The basic idea is simple: cosmological theories predict the number of massive halos over time that should host clusters, so comparing to observed counts of clusters allows us to test these cosmological models. The principal source of uncertainty in this method is in relating observable properties of clusters to halo mass and redshift.
The number of massive halos depends on dark energy in two ways. First, dark energy influences how the universe expands, so it affects how the volume grows over time. Second, the gravitational growth of halos from small initial fluctuations depends on the cosmic mix of matter and dark energy. By measuring how the number of clusters grows over time, DES will probe the relative strengths of these two factors. DES scientists will measure the space-time abundance of clusters out to a redshift of one when the universe was less that half its present age.
Unlike the supernovae and BAO methods, which are sensitive only to cosmic distances and thereby to the expansion rate, galaxy clusters probe both distances and the rate of growth of structure in the universe. By comparing results between these two different classes of probes, cosmologists can determine whether the current theory of gravity, Einstein's General Relativity Theory, is sufficient to explain cosmic acceleration.
Predicting number counts of galaxy clusters
Extensive research using N-body simulation methods has calibrated functional forms that predict the proper number density of dark matter halos above mass as a function and redshift, . Here, 'proper number density' means the number per unit physical volume. By calculating the proper volume element as a function of redshift, , the number of massive halos per unit redshift and solid angle can be computed.


To calculate the proper volume element, we first calculate the proper area ( ) for a given redshift ( ), radial coordinate ( ) and solid angle ( ). We then calculate the distance ( ) in the redshift interval . The proper volume is then


Using the FLRW metric, the proper area is given by

where is the scale factor.

The distance in the redshift interval is the distance light travels in an infinitesimal time ,


Relating this to the redshift , we find

where is the Hubble parameter:

for constant .

The proper volume element is then just the product of and :

Thus when combined with the theoretically predicted proper number density of massive halos , and assuming each halo hosts a cluster, then the number of galaxy clusters per unit redshift per unit solid angle is:

Calculating observable counts
The Dark Energy Survey will measure the differential number of galaxy clusters, , as a function of redshift and cluster size . Here, is a measure of the number or total stellar mass of galaxies in a cluster.


The predicted counts, for a given cosmology are given by a convolution:

The first piece, , is the 'selection function' for the observable quantity . The second function, , is the "mass-observable" kernel giving the probability that a halo with mass and redshift will have a particular value of the observable .


Finally, the function is the "theoretical mass function", the differential version of the cumulative number density function discussed above.

Cluster finding
In DES photometric imaging, clusters are found as localized enhancements in the sky surface density of galaxies. Because galaxy formation in clusters is accelerated relative to the universe as a whole, cluster galaxies often fall along a "red sequence" of similar color characterized by old, evolved stellar populations. DES is sensitive to clusters containing bright, red-sequence galaxies. Searching to the DES expects to detect about 200,000 galaxy clusters in a CDM cosmology.


To search for clusters in the optical data, one technique DES will use is known as red sequence optical cluster finding [17] This well-known technique has been applied to smaller cluster samples from the SDSS and the RCS-II cluster surveys.
The largest systematic uncertainty in using galaxy clusters to study cosmology comes from the mass-observable relation. Theories predict galaxy cluster masses, while experiments measure different observable quantities (i.e. optical richness) for galaxy clusters. The mass-observable relation for the DES will be calibrated directly using weak gravitational lensing. By measuring the cosmic shear around clusters, weak lensing can provide estimates of their total mass. Because measurements for individual clusters are low signal-to-noise, DES clusters will be binned by that observable and redshift. For each of these bins, the average cluster mass profile will be calculated using weak lensing. Relating the observable quantity to the calculated cluster mass profile calibrates the mean mass-observable relation.
To address the selection function of the optically selected sample, the DES collaboration is developing a number of different cluster finding algorithms and is testing them on synthetic catalogs produced from N-body simulations. The cluster finding algorithms are run on synthetic galaxy catalogs derived these simulations to find the simulated massive halos.
Weak lensing

Gravitational lensing occurs when light from distant sources such as quasars or galaxies is bent by the gravitational field of a massive object. An image of Abell 2218, a cluster of galaxies, shows how the intervening matter field distorts the light from background galaxies. The effect around the cluster is so strong that multiple images of the source galaxy are seen as arcs. This is referred to as strong gravitational lensing.
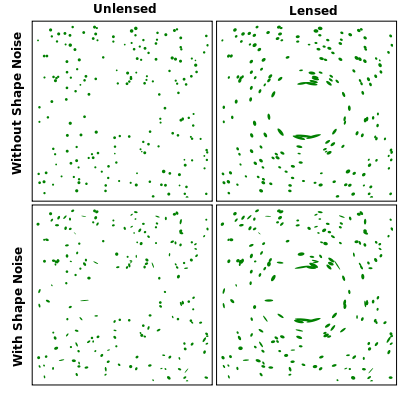
The history of growth of large scale structure (LSS) can give us a handle on the interplay between gravity and dark energy. However, most of this structure is made up of dark matter, which cannot be detected by standard astronomical means. The cosmological gravitational field can also bend the light from distant sources but in this case the images of galaxies are distorted, stretched and magnified, in small amounts. This is referred to as weak gravitational lensing.
This small distortion of the image of a galaxies referred to as cosmic shear and can amount to a typical stretching of an image on the order of 2 percent. The effect is too small to be measured for an individual galaxy.[18] Fortunately, the same matter density field affects many galaxies in the same part of the sky and by studying a large number of galaxies in the same area of the sky, astronomers can look for alignments in cosmic shear statistically.
This is achieved by measuring the shear-shear correlation function, a two-point function, or its Fourier Transform, the shear power spectrum.[19] DES will measure the shear power spectrum as a function of photometric redshift. Another statistic that can be used is the angular correlation function between the foreground galaxy positions and the shear of the source galaxy, the so-called galaxy-shear correlation.[20]
Since shear is sensitive to the matter density field, which is dominated by dark matter, it is less sensitive to baryonic effects, although such effects may have a large enough contribution to the evolution of the matter power spectrum at small scales, such that we can no longer distinguish between predictions of interesting dark energy models. The calculation of the non-linear matter power spectrum poses another challenge for weak lensing measurements and must include baryonic effects.[21]
DES will be able to probe Dark Energy because cosmic shear measurements are sensitive to the evolution of the matter power spectrum (linear growth of structure) and the distance-redshift relation (expansion history and geometry). Higher order statistics such as the three-point function or the bispectrum, which combine measurements of the CMBR anisotropy and galaxy distribution will be able to break degeneracies between geometry, growth of structure and spatial curvature.[21]
Systematics
The ability of DES to observe cosmic shear is limited by the systematics of the telescope, the number of galaxies observed, and the intrinsic correlation between ellipse directions of galaxies. The primary systematics of the telescope are described by the point spread function of the telescope. Distortions in the point spread function caused by the mirror, optics, or geometry of the various telescope components will act to produce a false cosmic shear image. These distortions can be caused by wind, thermal contraction, misalignment, or a variety of other effects. Fortunately, most of these effects can be corrected for by actively measuring the point spread function of the telescope. The point spread function of the telescope can be measured by observing stars within our own galaxy. When the telescope observes these stars, their images ideally would be perfectly round. However, real star images have aberrations. Measuring the aberrations of point-like stars enables corrections to be applied to the images of galaxies during processing.
Since cosmic shear cannot be measured for a single galaxy and can only be detected statistically from many galaxies, the level to which cosmic shear can be measured depends on the amount of available galaxies being lensed. If a large number of galaxies with intrinsically random oriented ellipse directions can be observed in the same region of the sky, there will be less of an error on the final measurement for the cosmic shear. However, if there exists an intrinsic ellipse direction for a particular group of galaxies in a region of the sky, it can yield an artificially high value for the cosmic shear in that region.
Results
Cosmic shear measurements of background galaxies infer the matter density field between the observers and the background galaxies. Careful measurements of this cosmic shear can map out the distribution of mass in the universe. In April 2015, the Dark Energy Survey released mass maps using cosmic shear measurements of about 2 million galaxies from the science verification data (August 2012-February 2013).[22]
Dwarf Galaxies
Dwarf galaxies are small galaxies ranging from hundreds to a few billion stars. Many large galaxies including our own Milky Way Galaxy have several of these smaller dwarf galaxies orbiting them. The deep imaging of DES makes it an ideal probe for finding more dwarf or ‘satellite’ galaxies around our Milky Way Galaxy.
The number of dwarf galaxies gives important information about the evolution of galaxies and structure in the universe. Cosmological simulations have tended to predict many more dwarf galaxies around large galaxies than we see around our Milky Way Galaxy, leading to what is known as the missing satellite problem. Dwarf galaxies are also interesting in that they appear to be the most dark matter dominated objects in the universe, based on their mass to light ratio. This makes them interesting targets for dark matter indirect detection.
Results
In March 2015, two teams released their discoveries of several new potential dwarf galaxies candidates found in Year 1 DES data.[23] In August 2015, the Dark Energy Survey team announced the discovery of eight additional candidates in Year 2 DES data.[24] Spectroscopic data will be needed to confirm whether these candidates are true dwarf galaxies, or instead are star clusters within the Milky Way. There is potential for many more dwarf galaxy discoveries as DES continues.
Solar System
Several minor planets have been discovered by DeCam in the course of The Dark Energy Survey. It is particularly well suited for finding high inclination trans-neptunian objects (TNOs).[25] The process has several steps. First, analysis of the wide field images reveals transient objects that are found by image subtraction.[26] Next, artifacts and low-quality candidates are rejected.[27] The remaining candidates form a master list, where each entry corresponds to a particular candidate at a particular time. From this list, the software looks for pairs of observations, no more than 60 nights apart, that are compatible with a TNO who's perihelion is greater than 30 AU. Finally, the software tries to link pairs into chains, assuming the same object might be responsible for all observations in the chain. If the fit to all observations in the chain is sufficiently good, then an object has been found and is submitted to the Minor Planet Center, or MPC.
The MPC has assigned the IAU code W84 for DeCam's observations of small Solar System bodies. As of 2017, the MPC inconsistently credits the discovery of 4 numbered minor planets, all of them are trans-Neptunian objects, to either "DeCam" or "Dark Energy Survey".[1] The list does not contain any unnumbered minor planets potentially discovered by DeCam, as discovery credits are only given upon a body's numbering, which in turn depends on a sufficiently secure orbit determination.
List of discovered minor planets
| (451657) 2012 WD36 [28] | 19 November 2012 | list |
| (471954) 2013 RM98 [29] | 8 September 2013 | list |
| (472262) 2014 QN441 [30] | 18 August 2014 | list |
| (483002) 2014 QS441 [31] | 19 August 2014 | list |
| Discoveries are credited to "DECam" and "Dark Energy Survey", respectively. | ||
|---|---|---|
Data management
The survey's images are processed by the Dark Energy Survey Data Management System, which is centered at the National Center for Super Computing Applications at the University of Illinois at Urbana Champaign. The DES will release the survey's raw and reduced DECAM images after a one-year proprietary period, via its portals at NCSA. The DESDM will also make two full releases of its data products, one approximately mid-way though the survey, and a final release at the end of the survey.
References
- 1 2 "Minor Planet Discoverers (by number)". Minor Planet Center. 15 November 2016. Retrieved 27 January 2017.
- ↑ Home - The Dark Energy Survey
- ↑ DES Collaboration Page, DES Collaborators.
- ↑ DES-Brazil Archived 2014-10-22 at the Wayback Machine., DES-Brazil Consortium.
- 1 2 3 Dark Energy Camera (DECam), Cerro Tololo Inter-American Observatory.
- ↑ News about Flash Code News about the first 3D successful simulation of a type IA supernova.
- 1 2 http://proceedings.spiedigitallibrary.org/proceeding.aspx?articleid=1362394
- 1 2 DECam Presentation Archived 2011-09-27 at the Wayback Machine., Pdf Presentation about the specific details about how a CCD device works and about the specific properties of the DECam, made by a Fermilab specialist.
- ↑ "The Dark Energy Survey Collaboration". www.darkenergysurvey.org. Retrieved 2015-11-21.
- ↑ The Project - The Dark Energy Survey Collaboration, The DES Project Site.
- ↑ SDSS FIlter Description
- ↑ Dark Energy Survey Collaboration. "Description of the Dark Energy Survey for Astronomers" (PDF). The Dark Energy Survey. Retrieved 1 March 2015.
- ↑ "Dark energy camera snaps first images ahead of survey". BBC. 2012-09-18.
- ↑ "The Dark Energy Survey begins". Fermilab. 2013-09-03.
- 1 2 Adam G. Riess et al. (Supernova Search Team) (1998). "Observational evidence from supernovae for an accelerating universe and a cosmological constant". Astronomical Journal. 116 (3): 1009–38. arXiv:astro-ph/9805201. Bibcode:1998AJ....116.1009R. doi:10.1086/300499.
- 1 2 http://mwhite.berkeley.edu/BAO/bao_iucca.pdf
- ↑ Gladders, M.D., et al., 2007, ApJ, 655 (1): 128–134.
- ↑ DES Collaboration Page - Weak Lensing, Weak Lensing.
- ↑ "Archived copy" (PDF). Archived from the original (PDF) on 2011-07-20. Retrieved 2010-12-02.
- ↑ https://www.darkenergysurvey.org/the-project/survey_documents/DES-DETF/Supplements_DES-DETF_v1.6.pdf%5Bpermanent+dead+link%5D
- 1 2 https://www.darkenergysurvey.org/the-project/survey_documents/DES-DETF/weinberg.pdf%5Bpermanent+dead+link%5D
- ↑ Mapping the cosmos: Dark Energy Surve creates detailed guide to spotting dark matter
- ↑ Scientists find rare dwarf satellite galaxy candidates in Dark Energy Survey data
- ↑ Eight Ultra-faint Galaxy Candidates Discovered in Year Two of the Dark Energy Survey
- ↑ DES Collaboration. "DISCOVERY AND DYNAMICAL ANALYSIS OF AN EXTREME TRANS-NEPTUNIAN OBJECT WITH A HIGH ORBITAL INCLINATION". arXiv:1805.05355.
- ↑ Kessler, R., J. Marriner, M. Childress, R. Covarrubias, C. B. D’Andrea, D. A. Finley, J. Fischer; et al. (2015). "The difference imaging pipeline for the transient search in the Dark Energy Survey". The Astronomical Journal. 150 (6). p. 172.
- ↑ Goldstein, D. A., C. B. D’Andrea, J. A. Fischer, R. J. Foley, R. R. Gupta, R. Kessler, A. G. Kim; et al. (2015). "Automated transient identification in the Dark Energy Survey". The Astronomical Journal. 150150 (3): 82.
- ↑ https://ssd.jpl.nasa.gov/sbdb.cgi?sstr=2451657
- ↑ https://ssd.jpl.nasa.gov/sbdb.cgi?sstr=2471954
- ↑ https://ssd.jpl.nasa.gov/sbdb.cgi?sstr=2472262
- ↑ https://ssd.jpl.nasa.gov/sbdb.cgi?sstr=2483002