| 1975–76 Australian region cyclone season |
|---|
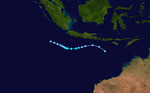
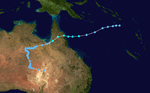
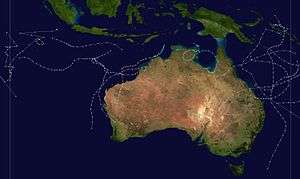 Season summary map |
| Seasonal boundaries |
|---|
| First system formed |
17 November 1975 |
|---|
| Last system dissipated |
9 May 1976 |
|---|
| Strongest storm |
|---|
|
|
| Name |
Joan |
|---|
| • Maximum winds |
230 km/h (145 mph)
(10-minute sustained) |
|---|
| • Lowest pressure |
915 hPa (mbar) |
|---|
|
|
| Seasonal statistics |
|---|
| Tropical lows |
16 |
|---|
| Tropical cyclones |
15 |
|---|
| Severe tropical cyclones |
9 |
|---|
| Total fatalities |
Unknown |
|---|
| Total damage |
Unknown |
|---|
| Related articles |
|---|
|
|
|
The 1975–76 Australian region cyclone season was an above average tropical cyclone season.
Systems
Tropical Cyclone Ray
|
Category 2 tropical cyclone (Australian scale) |
|
Category 1 tropical cyclone (SSHWS) |
|
|
| Duration |
November 17 – November 25 |
|---|
| Peak intensity |
100 km/h (65 mph) (10-min) 973 hPa (mbar) |
|---|
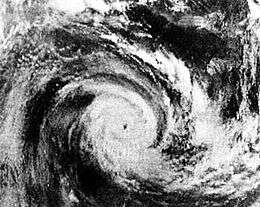
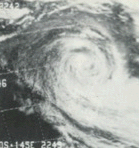
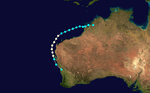
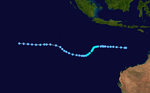
Severe Tropical Cyclone Joan
|
Category 5 severe tropical cyclone (Australian scale) |
|
Category 4 tropical cyclone (SSHWS) |
|
|
| Duration |
November 30 – December 10 |
|---|
| Peak intensity |
230 km/h (145 mph) (10-min) 915 hPa (mbar) |
|---|
On the morning of November 30, 1975, satellite imagery showed a large cloud mass in the Timor Sea. The satellite photograph received on the morning of December 1 showed that significant organization had occurred in the cloud mass during the previous 24 hours. It was deemed at 0115 UTC that the system be named the developing cyclone Joan, located about 310 km west-northwest of Darwin. Joan's movement in the following 48 hours was towards the southwest at an average 5 km/h. The first evidence of the increasing strength of Joan came as the cyclone moved west-southwest past the northernmost areas of Western Australia on December 3. The cyclone's generally west-southwesterly track after December 2 took it away from the coast until 0900 6 December when it was about 420 km north of Port Hedland and the system turned southward. At about 2200 UTC December 7, 1975, the eye of tropical cyclone Joan crossed the coast about 50 km west of Port Hedland. The cyclone was travelling south-southwest at about 14 km/h and crossed over or adjacent to the homesteads on the pastoral properties Mundabullangana, Mallina, Coolawanyah, Hamersley, and Mount Brockman. As cyclone Joan crossed the coastal plain and the Chichester Range only a slow moderation of its intensity seems to have occurred, but as the cyclone crossed the Hamersley Range the available evidence suggests that a rapid weakening took place.
Tropical cyclone Joan was the most destructive cyclone to affect the Port Hedland area in more than 30 years. The city was subjected to sustained winds exceeding 90 km/h for about 10 hours with winds in excess of 120 km/h for three hours. The maximum measured wind gust of 208 km/h on December 8, 1975, is the fourth highest on record in Australia. Severe property damage occurred at Port Hedland and at other settlements close to the cyclone's path. Subsequent flooding damaged roads and sections of the iron ore railways, particularly that of Hamersley Iron Pty Ltd. Sheep losses were heavy but, remarkably, no loss of human life or serious injury was reported. The estimated damage to private property and public facilities is believed to have exceeded $25 million.[1]
Tropical Cyclone Kim
|
Category 1 tropical cyclone (Australian scale) |
|
Tropical storm (SSHWS) |
|
|
| Duration |
December 1 – December 10 |
|---|
| Peak intensity |
80 km/h (50 mph) (10-min) 990 hPa (mbar) |
|---|
Tropical Cyclone Sue
|
Category 1 tropical cyclone (Australian scale) |
|
Tropical storm (SSHWS) |
|
|
| Duration |
December 12 – December 16 |
|---|
| Peak intensity |
75 km/h (45 mph) (10-min) 994 hPa (mbar) |
|---|
Severe Tropical Cyclone David
|
Category 3 severe tropical cyclone (Australian scale) |
|
Category 2 tropical cyclone (SSHWS) |
|
|
| Duration |
January 11 – January 22 |
|---|
| Peak intensity |
150 km/h (90 mph) (10-min) 961 hPa (mbar) |
|---|
Severe Tropical Cyclone Vanessa
|
Category 4 severe tropical cyclone (Australian scale) |
|
Category 3 tropical cyclone (SSHWS) |
|
|
| Duration |
January 15 – January 28 |
|---|
| Peak intensity |
175 km/h (110 mph) (10-min) 950 hPa (mbar) |
|---|
Tropical Cyclone Alan
|
Category 2 tropical cyclone (Australian scale) |
|
Tropical storm (SSHWS) |
|
|
| Duration |
January 30 – February 9 |
|---|
| Peak intensity |
95 km/h (60 mph) (10-min) 989 hPa (mbar) |
|---|
Severe Tropical Cyclone Beth
|
Category 3 severe tropical cyclone (Australian scale) |
|
Category 1 tropical cyclone (SSHWS) |
|
|
| Duration |
February 13 – February 22 |
|---|
| Peak intensity |
130 km/h (80 mph) (10-min) 972 hPa (mbar) |
|---|
Severe Tropical Cyclone Wally
|
Category 3 severe tropical cyclone (Australian scale) |
|
Category 1 tropical cyclone (SSHWS) |
|
|
| Duration |
February 22 – February 27 |
|---|
| Peak intensity |
130 km/h (80 mph) (10-min) 973 hPa (mbar) |
|---|
Cyclone Hope
|
|
| Duration |
February 24 – March 6 |
|---|
| Peak intensity |
Winds not specified |
|---|
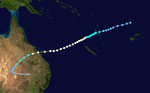
Severe Tropical Cyclone Colin
|
Category 3 severe tropical cyclone (Australian scale) |
|
Category 2 tropical cyclone (SSHWS) |
|
|
| Duration |
February 25 – March 7 |
|---|
| Peak intensity |
155 km/h (100 mph) (10-min) 954 hPa (mbar) |
|---|
Colin churned up rough seas all across the eastern coast of Australia and caused one fatality as a result when a large wave swept a woman off a cliff.
Tropical Cyclone Alice
|
Category 1 tropical cyclone (Australian scale) |
|
Tropical storm (SSHWS) |
|
|
| Duration |
March 2 – March 13 |
|---|
| Peak intensity |
85 km/h (50 mph) (10-min) 988 hPa (mbar) |
|---|
Tropical Cyclone Dawn
|
Category 1 tropical cyclone (Australian scale) |
|
Tropical storm (SSHWS) |
|
|
| Duration |
March 3 – March 6 |
|---|
| Peak intensity |
75 km/h (45 mph) (10-min) 988 hPa (mbar) |
|---|
Cyclone Linda
|
|
| Duration |
March 14 – March 17 |
|---|
| Peak intensity |
Winds not specified 995 hPa (mbar) |
|---|
Cyclone Watorea
|
|
| Duration |
April 25 – April 28 |
|---|
| Peak intensity |
Winds not specified 970 hPa (mbar) |
|---|
Cyclone Carol
|
|
| Duration |
May 3 – May 9 |
|---|
| Peak intensity |
Winds not specified 991 hPa (mbar) |
|---|
See also
- Atlantic hurricane seasons: 1975, 1976
- Eastern Pacific hurricane seasons: 1975, 1976
- Western Pacific typhoon seasons: 1975, 1976
- North Indian Ocean cyclone seasons: 1975, 1976