Cumulative flow diagram
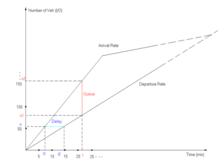
A cumulative flow diagram is a tool used in queuing theory. It is an area graph that depicts the quantity of work in a given state, showing arrivals, time in queue, quantity in queue, and departure.
Cumulative flow diagrams are seen in the literature of agile software development and lean product development.[1][2] They are also seen in transportation.[3]
Some people consider a cumulative flow diagram to be a more sophisticated version of a "burn up chart", which is the opposite of a burn down chart. A burn down chart tracks work remaining over time while burn up charts like the CFD track the growth (or shrinkage) of work in certain states over time. With its focus on tracking changes in queue size per state, the CFD has a stronger focus on identifying and rooting out the causes of dramatic changes in throughput.[4]
Another term is "cumulative input-output diagram". The term "Newell curve" is also used, in reference to Gordon F. Newell. It is not known if Newell originated the curve.
References
- ↑ Anderson, David (2010). Kanban: Successful Evolutionary Change for Your Technology Business. Sequim, WA: Blue Hole Press. p. 25. ISBN 978-0-9845214-0-1.
- ↑ Reinertsen, Donald (2009). The Principles of Product Development Flow: Second Generation Lean Product Development. Redondo Beach, CA: Celeritas Publishing. pp. 71–72. ISBN 978-1-935401-00-1.
- ↑ Wikibooks. "Fundamentals of Transportation/Queuing".
- ↑ Reinertsen, Donald (2009). The Principles of Product Development Flow: Second Generation Lean Product Development. Redondo Beach, CA: Celeritas Publishing. pp. 72–73. ISBN 978-1-935401-00-1.