Abundance of elements in Earth's crust
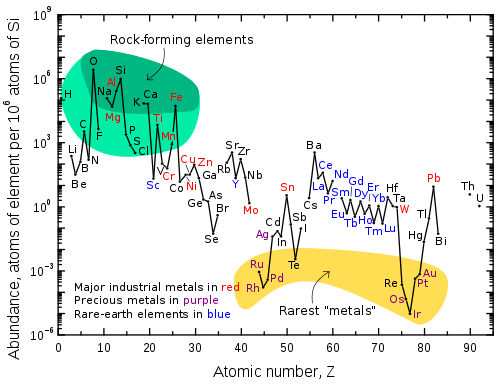
Abundance (atom fraction) of the chemical elements in Earth's upper continental crust as a function of atomic number. The rarest elements in the crust (shown in yellow) are not the heaviest, but are rather the siderophile (iron-loving) elements in the Goldschmidt classification of elements. These have been depleted by being relocated deeper into the Earth's core. Their abundance in meteoroids is higher. Additionally, tellurium and selenium have been depleted from the crust due to formation of volatile hydrides.
The abundance of elements in Earth's crust is shown in tabulated form with the estimated crustal abundance for each chemical element shown as parts per million (ppm) by mass (10,000 ppm = 1%).
| Rank | Z, element & symbol | Abundance in crust (ppm) by source | Annual production | ||||||
|---|---|---|---|---|---|---|---|---|---|
| Darling[1] | Barbalace[2] | WebElements[3] | Israel Science and Technology[4] | Jefferson Lab[5] | (2016, tonnes)[6] | ||||
| 1 | 8 | oxygen | O | 466,000 | 474,000 | 460,000 | 467,100 | 461,000 | |
| 2 | 14 | silicon [upper-alpha 1] | Si | 277,200 | 277,100 | 270,000 | 276,900 | 282,000 | 7,200,000 |
| 3 | 13 | aluminium | Al | 81,300 | 82,000 | 82,000 | 80,700 | 82,300 | 57,600,000 |
| 4 | 26 | iron | Fe | 50,000 | 41,000 | 63,000 | 50,500 | 56,300 | 1,150,000,000 |
| 5 | 20 | calcium | Ca | 36,300 | 41,000 | 50,000 | 36,500 | 41,500 | |
| 6 | 11 | sodium | Na | 28,300 | 23,000 | 23,000 | 27,500 | 23,600 | 255,000,000 |
| 7 | 12 | magnesium | Mg | 20,900 | 23,000 | 29,000 | 20,800 | 23,300 | 1,010,000 |
| 8 | 19 | potassium | K | 25,900 | 21,000 | 15,000 | 25,800 | 20,900 | |
| 9 | 22 | titanium | Ti | 4,400 | 5,600 | 6,600 | 6,200 | 5,600 | 6,600,000 |
| 10 | 1 | hydrogen | H | 1,400 | 1,500 | 1,400 | 1,400 | ||
| 11 | 15 | phosphorus | P | 1,200 | 1,000 | 1,000 | 1,300 | 1,050 | |
| 12 | 25 | manganese | Mn | 1,000 | 950 | 1,100 | 900 | 950 | 16,000,000 |
| 13 | 9 | fluorine | F | 800 | 950 | 540 | 290 | 585 | |
| 14 | 56 | barium | Ba | 500 | 340 | 340 | 500 | 425 | |
| 15 | 6 | carbon | C | 300 | 480 | 1,800 | 940 | 200 | |
| 16 | 38 | strontium | Sr | 370 | 360 | 370 | 350,000 | ||
| 17 | 16 | sulfur | S | 500 | 260 | 420 | 520 | 350 | 69,300,000 |
| 18 | 40 | zirconium | Zr | 190 | 130 | 250 | 165 | 1,460,000 | |
| 19 | 74 | tungsten | W | 160.6 | 1.1 | 1.25 | 86,400 | ||
| 20 | 23 | vanadium | V | 100 | 160 | 190 | 120 | 76,000 | |
| 21 | 17 | chlorine | Cl | 500 | 130 | 170 | 450 | 145 | |
| 22 | 24 | chromium | Cr | 100 | 100 | 140 | 350 | 102 | 26,000,000 |
| 23 | 37 | rubidium | Rb | 300 | 90 | 60 | 90 | ||
| 24 | 28 | nickel | Ni | 80 | 90 | 190 | 84 | 2,250,000 | |
| 25 | 30 | zinc | Zn | 75 | 79 | 70 | 11,900,000 | ||
| 26 | 29 | copper | Cu | 100 | 50 | 68 | 60 | 19,400,000 | |
| 27 | 58 | cerium | Ce | 68 | 60 | 66.5 | |||
| 28 | 60 | neodymium | Nd | 38 | 33 | 41.5 | |||
| 29 | 57 | lanthanum | La | 32 | 34 | 39 | |||
| 30 | 39 | yttrium | Y | 30 | 29 | 33 | 6,000 | ||
| 31 | 7 | nitrogen | N | 50 | 25 | 20 | 19 | 140,000,000 | |
| 32 | 27 | cobalt | Co | 20 | 30 | 25 | 123,000 | ||
| 33 | 3 | lithium | Li | 20 | 17 | 20 | 35,000 | ||
| 34 | 41 | niobium | Nb | 20 | 17 | 20 | 64,000 | ||
| 35 | 31 | gallium | Ga | 18 | 19 | 19 | |||
| 36 | 21 | scandium | Sc | 16 | 26 | 22 | |||
| 37 | 82 | lead | Pb | 14 | 10 | 14 | 4,820,000 | ||
| 38 | 62 | samarium | Sm | 7.9 | 6 | 7.05 | |||
| 39 | 90 | thorium | Th | 12 | 6 | 9.6 | |||
| 40 | 59 | praseodymium | Pr | 9.5 | 8.7 | 9.2 | |||
| 41 | 5 | boron | B | 950 | 8.7 | 10 | 9,400,000 | ||
| 42 | 64 | gadolinium | Gd | 7.7 | 5.2 | 6.2 | |||
| 43 | 66 | dysprosium | Dy | 6 | 6.2 | 5.2 | |||
| 44 | 72 | hafnium | Hf | 5.3 | 3.3 | 3.0 | |||
| 45 | 68 | erbium | Er | 3.8 | 3.0 | 3.5 | |||
| 46 | 70 | ytterbium | Yb | 3.3 | 2.8 | 3.2 | |||
| 47 | 55 | caesium | Cs | 3 | 1.9 | 3 | |||
| 48 | 4 | beryllium | Be | 2.6 | 1.9 | 2.8 | 220 | ||
| 49 | 50 | tin | Sn | 0 | 2.2 | 2.2 | 2.3 | 280,000 | |
| 50 | 63 | europium | Eu | 2.1 | 1.8 | 2.0 | |||
| 51 | 92 | uranium | U | 0 | 1.8 | 2.7 | 74,119 | ||
| 52 | 73 | tantalum | Ta | 2 | 1.7 | 2.0 | 1,100 | ||
| 53 | 32 | germanium | Ge | 1.8 | 1.4 | 1.5 | 155 | ||
| 54 | 42 | molybdenum | Mo | 1.5 | 1.1 | 1.2 | 227,000 | ||
| 55 | 33 | arsenic | As | 1.5 | 2.1 | 1.8 | 36,500 | ||
| 56 | 67 | holmium | Ho | 1.4 | 1.2 | 1.3 | |||
| 57 | 65 | terbium | Tb | 1.1 | 0.94 | 1.2 | |||
| 58 | 69 | thulium | Tm | 0.48 | 0.45 | 0.52 | |||
| 59 | 35 | bromine | Br | 0.37 | 3 | 2.4 | 391,000 | ||
| 60 | 81 | thallium | Tl | 0.6 | 0.530 | 0.850 | 10 | ||
| 61 | 71 | lutetium[7] | Lu | 0.5 | |||||
| 62 | 51 | antimony | Sb | 0.2 | 0.2 | 0.2 | 130,000 | ||
| 63 | 53 | iodine | I | 0.14 | 0.490 | 0.450 | 31,600 | ||
| 64 | 48 | cadmium | Cd | 0.11 | 0.15 | 0.15 | 23,000 | ||
| 65 | 47 | silver | Ag | 0.070 | 0.080 | 0.075 | 27,000 | ||
| 66 | 80 | mercury | Hg | 0.05 | 0.067 | 0.085 | 4,500 | ||
| 67 | 34 | selenium | Se | 0.05 | 0.05 | 0.05 | 2,200 | ||
| 68 | 49 | indium | In | 0.049 | 0.160 | 0.250 | 655 | ||
| 69 | 83 | bismuth | Bi | 0.048 | 0.025 | 0.0085 | 10,200 | ||
| 70 | 52 | tellurium | Te | 0.005 | 0.001 | 0.001 | 2,200 | ||
| 71 | 78 | platinum | Pt | 0.003 | 0.0037 | 0.005 | 172 | ||
| 72 | 79 | gold | Au | 0.0011 | 0.0031 | 0.004 | 3,100 | ||
| 73 | 44 | ruthenium | Ru | 0.001 | 0.001 | 0.001 | |||
| 74 | 46 | palladium | Pd | 0.0006 | 0.0063 | 0.015 | 208 | ||
| 75 | 75 | rhenium | Re | 0.0004 | 0.0026 | 0.0007 | 47.2 | ||
| 76 | 77 | iridium | Ir | 0.0003 | 0.0004 | 0.001 | |||
| 77 | 45 | rhodium | Rh | 0.0002 | 0.0007 | 0.001 | |||
| 78 | 76 | osmium | Os | 0.0001 | 0.0018 | 0.0015 | |||
- ↑ 5,000 tonnes of annual silicon production is electronic grade
See also
References
- ↑ "Elements, Terrestrial Abundance". www.daviddarling.info. Archived from the original on 10 April 2007. Retrieved 2007-04-14.
- ↑ Barbalace, Kenneth. "Periodic Table of Elements". Environmental Chemistry.com. Retrieved 2007-04-14.
- ↑ "Abundance in Earth's Crust". WebElements.com. Archived from the original on 9 March 2007. Retrieved 2007-04-14.
- ↑ "List of Periodic Table Elements Sorted by Abundance in Earth's crust". Israel Science and Technology Homepage. Retrieved 2007-04-15.
- ↑ "It's Elemental — The Periodic Table of Elements". Jefferson Lab. Archived from the original on 29 April 2007. Retrieved 2007-04-14.
- ↑ Commodity Statistics and Information. USGS. All production numbers are for mines, except for Al, Cd, Fe, Ge, In, N, Se (plants, refineries), S (all forms) and As, Br, Mg, Si (unspecified). Data for B, K, Ti, Y are given not for the pure element but for the most common oxide, data for Na and Cl are for NaCl. For many elements like Si, Al, data are ambiguous (many forms produced) and are taken for the pure element. U data is pure element required for consumption by current reactor fleet . WNA.
- ↑ Emsley, John (2001). Nature's building blocks: an A-Z guide to the elements. Oxford University Press. pp. 240–242. ISBN 0-19-850341-5.
- BookRags, Periodic Table.
- World Book Encyclopedia, Exploring Earth.
- HyperPhysics, Georgia State University, Abundance of Elements in Earth's Crust.
- Data Series 140, Historical Statistics for Mineral and Material Commodities in the United States, Version 2011, USGS .
- Eric Scerri, The Periodic Table, Its Story and Its Significance, Oxford University Press, 2007
This article is issued from
Wikipedia.
The text is licensed under Creative Commons - Attribution - Sharealike.
Additional terms may apply for the media files.