Conjoint analysis
'Conjoint analysis' is a survey-based statistical technique used in market research that helps determine how people value different attributes (feature, function, benefits) that make up an individual product or service.
The objective of conjoint analysis is to determine what combination of a limited number of attributes is most influential on respondent choice or decision making. A controlled set of potential products or services is shown to survey respondents and by analyzing how they make preferences between these products, the implicit valuation of the individual elements making up the product or service can be determined. These implicit valuations (utilities or part-worths) can be used to create market models that estimate market share, revenue and even profitability of new designs.
Conjoint originated in mathematical psychology and was developed by marketing professor Paul E. Green at the Wharton School of the University of Pennsylvania. Other prominent conjoint analysis pioneers include professor V. "Seenu" Srinivasan of Stanford University who developed a linear programming (LINMAP) procedure for rank ordered data as well as a self-explicated approach, Richard Johnson who developed the Adaptive Conjoint Analysis technique in the 1980s[1] and Jordan Louviere (University of Iowa) who invented and developed choice-based approaches to conjoint analysis and related techniques such as best–worst scaling.
Today it is used in many of the social sciences and applied sciences including marketing, product management, and operations research. It is used frequently in testing customer acceptance of new product designs, in assessing the appeal of advertisements and in service design. It has been used in product positioning, but there are some who raise problems with this application of conjoint analysis.
Conjoint analysis techniques may also be referred to as multiattribute compositional modelling, discrete choice modelling, or stated preference research, and is part of a broader set of trade-off analysis tools used for systematic analysis of decisions. These tools include Brand-Price Trade-Off, Simalto, and mathematical approaches such as AHP,[2] evolutionary algorithms or rule-developing experimentation.
Conjoint design
A product or service area is described in terms of a number of attributes. For example, a television may have attributes of screen size, screen format, brand, price and so on. Each attribute can then be broken down into a number of levels. For instance, levels for screen format may be LED, LCD, or Plasma.
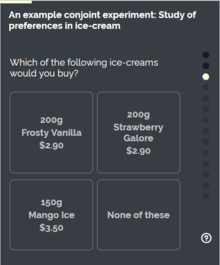
Respondents would be shown a set of products, prototypes, mock-ups, or pictures created from a combination of levels from all or some of the constituent attributes and asked to choose from, rank or rate the products they are shown. Each example is similar enough that consumers will see them as close substitutes, but dissimilar enough that respondents can clearly determine a preference. Each example is composed of a unique combination of product features. The data may consist of individual ratings, rank orders, or preferences among alternative combinations.
As the number of combinations of attributes and levels increases the number of potential profiles increases exponentially. Consequently, fractional factorial design is commonly used to reduce the number of profiles that have to be evaluated, while ensuring enough data are available for statistical analysis, resulting in a carefully controlled set of "profiles" for the respondent to consider.
Types
The earliest forms of conjoint analysis were what are known as Full Profile studies, in which a small set of attributes (typically 4 to 5) are used to create profiles that are shown to respondents, often on individual cards. Respondents then rank or rate these profiles. Using relatively simple dummy variable regression analysis the implicit utilities for the levels can be calculated. Two drawbacks were seen in these early designs.
Firstly, the number of attributes in use was heavily restricted. With large numbers of attributes, the consideration task for respondents becomes too large and even with fractional factorial designs the number of profiles for evaluation can increase rapidly. In order to use more attributes (up to 30), hybrid conjoint techniques were developed. The main alternative was to do some form of self-explication (rating of separate components) before the conjoint tasks and some form of adaptive computer-aided choice over the profiles to be shown.
The second drawback was that the task itself was unrealistic and did not link directly to behavioural theory. In real-life situations, the task would be some form of actual choice between alternatives rather than the more artificial ranking and rating originally used. Jordan Louviere pioneered an approach that used only a choice task which became the basis of choice-based conjoint analysis and discrete choice analysis. This stated preference research is linked to econometric modeling and can be linked to revealed preference where choice models are calibrated on the basis of real rather than survey data. Originally choice-based conjoint analysis was unable to provide individual level utilities as it aggregated choices across a market. This made it unsuitable for market segmentation studies. With newer hierarchical Bayesian analysis techniques, individual level utilities can be imputed back to provide individual level data.
Information collection
Data for conjoint analysis are most commonly gathered through a market research survey, although conjoint analysis can also be applied to a carefully designed configurator or data from an appropriately designed test market experiment. Market research rules of thumb apply with regard to statistical sample size and accuracy when designing conjoint analysis interviews.
The length of the research questionnaire depends on the number of attributes to be assessed and the method of conjoint analysis in use. A typical adaptive conjoint questionnaire with 20-25 attributes may take more than 30 minutes to complete. Choice based conjoint, by using a smaller profile set distributed across the sample as a whole may be completed in less than 15 minutes. Choice exercises may be displayed as a store front type layout or in some other simulated shopping environment.
Analysis
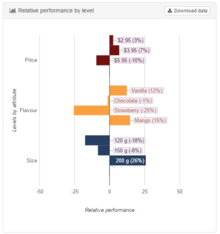
Depending on the type of model, different econometric and statistical methods can be used to estimate utility functions. These utility functions indicate the perceived value of the feature and how sensitive consumer perceptions and preferences are to changes in product features. The actual estimation procedure will depend on the design of the task and profiles for respondents, in the type of specification, and the scale of measure for preferences (it can be ratio, ranking, choice) which can have a limited range or not. For rated full profile tasks, linear regression may be appropriate, for choice based tasks, maximum likelihood estimation, usually with logistic regression are typically used. The original methods were monotonic analysis of variance or linear programming techniques, but contemporary marketing research practice has shifted towards choice-based models using multinomial logit, mixed versions of this model, and other refinements. Bayesian estimators are also very popular. Hierarchical Bayesian procedures are nowadays relatively popular as well.
Advantages and disadvantages
Advantages
- estimates psychological tradeoffs that consumers make when evaluating several attributes together
- measures preferences at the individual level
- uncovers real or hidden drivers which may not be apparent to the respondent themselves
- realistic choice or shopping task
- able to use physical objects
- if appropriately designed, the ability to model interactions between attributes can be used to develop needs based segmentation
Disadvantages
- designing conjoint studies can be complex
- with too many options, respondents resort to simplification strategies
- difficult to use for product positioning research because there is no procedure for converting perceptions about actual features to perceptions about a reduced set of underlying features
- respondents are unable to articulate attitudes toward new categories, or may feel forced to think about issues they would otherwise not give much thought to
- poorly designed studies may over-value emotional/preference variables and undervalue concrete variables
- does not take into account the number items per purchase so it can give a poor reading of market share
Practical applications
Market research
One practical application of conjoint analysis in business analysis is given by the following example: A real estate developer is interested in building a high rise apartment complex near an urban Ivy League university. To ensure the success of the project, a market research firm is hired to conduct focus groups with current students. Students are segmented by academic year (freshman, upper classmen, graduate studies) and amount of financial aid received. Study participants are given a series of index cards. Each card has 6 attributes to describe the potential building project (proximity to campus, cost, telecommunication packages, laundry options, floor plans, and security features offered). The estimated cost to construct the building described on each card is equivalent. Participants are asked to order the cards from least to most appealing. This forced ranking exercise will indirectly reveal the participants' priorities and preferences. Multi-variate regression analysis may be used to determine the strength of preferences across target market segments.
Litigation
Federal courts in the United States have allowed expert witnesses to use conjoint analysis to support their opinions on the damages that an infringer of a patent should pay to compensate the patent holder for violating its rights.[3] Nonetheless, legal scholars have noted that the Federal Circuit's jurisprudence on the use of conjoint analysis in patent-damages calculations remains in a formative stage.[4]
Available software tools for conjoint analysis
| Product | Developer | Initial public release | Headquarters | Delivery method | Cost | License | |
|---|---|---|---|---|---|---|---|
| 1000minds | 1000minds | 2002 | New Zealand | SaaS | Custom | Proprietary | [5] |
| Conjoint.ly | Conjoint.ly | 2016 | Sydney, Australia | SaaS | US $1,300 per study | Proprietary | |
| Survey Analytics | QuestionPro | 2002 | San Francisco, United States | SaaS | US$1,000 per month | Proprietary | |
| Discover, Lighthouse Studio | Sawtooth Software | 2000 | Provo, United States | SaaS, Desktop software | From US$3,000 per year | Proprietary | |
| Qualtrics | Qualtrics | 2002 | Provo, United States | SaaS | From US$1,500 per year | Proprietary | |
| support.CEs package (R) | Hideo Aizaki | 2015 | N/A | Package for the R programming language | Free[6] | Open-source software | |
| MyChoice | MyChoice | 2017 | Singapore | Self-administered / web-based | From SGD5,000 per study |
See also
References
- ↑ Johnson, Richard M. (September 2001). "History of ACA". Proceedings of the Sawtooth Software Conference. Victoria, BC, Canada. pp. 205–212.
- ↑ Ijzerman MJ, van Til JA, Bridges JF (212). "A comparison of analytic hierarchy process and conjoint analysis methods in assessing treatment alternatives for stroke rehabilitation". Patient. 5: 45–56. doi:10.2165/11587140-000000000-00000. PMID 22185216.
- ↑ Cornell University v. Hewlett-Packard Co., 609 F. Supp. 2d 279 (N.D.N.Y. 2009); Sentius Int'l, LLC v. Microsoft Corp., No. 5:13-cv-00825, 2015 WL 331939 (N.D. Cal. Jan. 23, 2015).
- ↑ J. Gregory Sidak & Jeremy O. Skog, Using Conjoint Analysis to Apportion Patent Damages, (Criterion Economics Working Paper, Jan. 29, 2016), https://www.criterioneconomics.com/using-conjoint-analysis-to-apportion-patent-damages.html.
- ↑ Smith, K. F.; Fennessy, P. F. (2011). "The use of conjoint analysis to determine the relative importance of specific traits as selection criteria for the improvement of perennial pasture species in Australia". Crop and Pasture Science. 62 (4): 355–65. doi:10.1071/CP10320.
- ↑ Hideo Aizaki (2015). "support.CEs: Basic Functions for Supporting an Implementation of Choice Experiments".
External links
- Green, P. and Srinivasan, V. (1978) Conjoint analysis in consumer research: Issues and outlook, Journal of Consumer Research, vol 5, September 1978, pp 103–123.
- Green, P. Carroll, J. and Goldberg, S. (1981) A general approach to product design optimization via conjoint analysis, Journal of Marketing, vol 43, summer 1981, pp 17–35.
- Srinivasan, V. (1988) A Conjunctive-Compensatory Approach to the Self-Explication of Multiattributed Preferences, Decision Sciences, Vol. 19, Spring 1998, 295-305.
- Green, P. E. and Srinivasan V. (1990) Conjoint Analysis in Marketing: New Developments with Implications for Research and Practice, Journal of Marketing, Vol. 54, October 1990, 3-19.
- Marder, E. (1999) The Assumptions of Choice Modeling
- Output of a standard choice-based conjoint analysis study
- Conjoint Analysis, Related Modeling and Applications
- Conjoint Analysis Applications in Health