This article is a summary of the closing milestones of the S&P 500 Index, a United States stock market index. Since opening at 16.66 on January 3, 1950, the S&P 500 has substantially increased despite several periods of decline.[1]
History
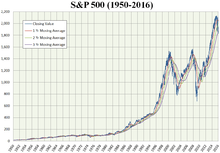
S&P 500 Index from 1950 to 2016
Standard & Poor's, initially known as the Standard Statistics Company, created its first stock market index in 1923. It consisted of 233 different stocks and was computed on a weekly basis. Three years later, it developed a 90 component composite price index that was computed on a daily basis; that was expanded over the years. On March 4, 1957, the Standard & Poor's 500 (.INX) (.SPX) was introduced.
Milestone highs and lows
- June 4, 1968: S&P 500 closes above 100 for the first time.
- October 19, 1987: S&P 500 registers its largest daily percentage loss, falling 20.47 percent. The one-day crash, known as "Black Monday," was blamed on program trading and those using a hedging strategy known as portfolio insurance. Despite the losses, the S&P 500 still closed positive for the year.
- March 24, 1995: The S&P 500 index closes above 500 for the first time. In exactly five years time, the S&P 500 tripled its value, and reached its peak prior to the dot-com bubble.
- February 2, 1998: S&P 500 closes above 1,000 for the first time.
- March 15, 1999: The S&P 500 closed above 1,300 for the first time. On the next day, the more commonly followed Dow Jones Industrial Average traded above 10,000 points for the first time.
- March 24, 2000: The S&P 500 index reaches an all-time intraday high of 1,552.87 during the dot-com bubble.
- October 9, 2007: Index closes at a record high of 1,565.15, the highest close prior to the 2008 financial crisis.
- October 11, 2007: S&P 500 hits an intraday record high of 1,576.09.
- October 13, 2008: S&P 500 marks its best daily percentage gain, rising 11.58 percent. It also registers its largest single-day point increase of 104.13 points.
- December 31, 2008: For the year, S&P 500 falls 38.49 percent, its worst yearly percentage loss. In September 2008, Lehman Brothers collapsed as the financial crisis spread.
- March 9, 2009: S&P 500 closes at 676.53 (it hit a 666 intraday low on March 6), its closing low after the onset of the 2008 financial crisis and the bankruptcy of Lehman Brothers.
- March 28, 2013: S&P 500 ends at 1,569.19, surpassing its previous record closing high set in 2007.
- April 10, 2013: S&P 500 hits new all-time intraday record high at 1,589.07, surpassing the previous record of 1,576.09 set during trading on October 11, 2007.
- May 3, 2013: S&P 500 closes above 1,600 for the first time, finishing at 1,614.42 after a much better-than-expected April U.S. non-farm payrolls report. The index also hit an all-time intraday high of 1,618.46.
- August 1, 2013: S&P 500 closes above 1,700 for the first time, finishing at 1,706.87, as well as reaching an all-time intraday high of 1,707.85.[2]
- November 22, 2013: S&P 500 closes above 1,800 for the first time, finishing at 1,804.76 points.
- May 23, 2014: S&P 500 closes above 1,900 for the first time, finishing at 1,900.53 points.
- August 26, 2014: S&P 500 closes above 2,000 for the first time, finishing at 2,000.02 points.
- February 17, 2015: S&P 500 closes above 2,100 for the first time, finishing at 2,100.34 points.[3]
- November 22, 2016: S&P 500 closes above 2,200 for the first time, finishing at 2,202.94 points.
- February 9, 2017: S&P 500 closes above 2,300 for the first time, finishing at 2,307.87 points.
- May 15, 2017: S&P 500 closes above 2,400 for the first time, finishing at 2,402.32 points.
- September 15, 2017: S&P 500 closes above 2,500 for the first time, finishing at 2,500.23 points.
- November 24, 2017: S&P 500 closes above 2,600 for the first time, finishing at 2,602.42 points.
- January 3, 2018: S&P 500 closes above 2,700 for the first time, finishing at 2,713.06 points.
- January 17, 2018 S&P 500 closes above 2,800 for the first time, finishing at 2,802.56 points.
- August 29, 2018 S&P 500 closes above 2,900 for the first time, finishing at 2,914.04 points.
Records
| Category |
All-time highs |
All-time lows |
|---|
| Closing | 2,930.75 | Thursday, September 20, 2018 | 16.66 | Tuesday, January 3, 1950 |
| Intraday | 2,940.91 | Friday, September 21, 2018 | 16.66 | Tuesday, January 3, 1950 |
Incremental closing milestones
The following is a list of the milestone closing levels of the S&P 500. 1-point increments are used up to the 20-point level; 2 to 50; 5 to 100; 10 to 500; 20 to 1,000; 50 to 3,000; and 100-point increments thereafter. Bold formatting is applied to every five milestones, excluding peaks.[4]
| Milestone |
Closing level |
Date first achieved |
|---|
| 16.66[lower-alpha 1] | 16.66 | January 3, 1950 |
| 17 | 17.08 | January 9, 1950 |
| 18 | 18.03 | April 18, 1950 |
| 19 | 19.14 | June 8, 1950 |
| 20 | 20.00 | October 4, 1950 |
| 22 | 22.20 | February 5, 1951 |
| 24 | 24.16 | January 14, 1952 |
| 26 | 26.04 | December 12, 1952 |
| 28 | 28.18 | April 29, 1954 |
| 30 | 30.14 | July 9, 1954 |
| 32 | 32.00 | September 22, 1954 |
| 34 | 34.03 | November 23, 1954 |
| 36 | 36.75 | January 3, 1955 |
| 38 | 38.27 | April 18, 1955 |
| 40 | 40.10 | June 17, 1955 |
| 42 | 43.18 | July 6, 1955 |
| 44 | 44.19 | September 12, 1955 |
| 46 | 46.41 | November 14, 1955 |
| 48 | 48.14 | March 16, 1956 |
| 50 | 50.06 | September 30, 1958 |
| 55 | 55.21 | December 31, 1958 |
| 60 | 60.01 | July 7, 1959 |
| 65 | 65.06 | March 30, 1961 |
| 70 | 70.01 | November 6, 1961 |
| 75 | 75.02 | December 31, 1963 |
| 80 | 80.02 | April 6, 1964 |
| 85 | 85.04 | October 8, 1964 |
| 90 | 90.27 | May 13, 1965 |
| Milestone |
Closing level |
Date first achieved |
|---|
| 94.06[lower-alpha 2] | 94.32 | May 4, 1967 |
| 95 | 95.37 | August 1, 1967 |
| 100 | 100.38 | June 4, 1968 |
| 110 | 110.18 | April 12, 1972 |
| 120 | 120.24 | January 11, 1973 |
| Milestone |
Closing level |
Date first achieved |
|---|
| 120.24[lower-alpha 3] | 121.44 | July 17, 1980 |
| 130 | 130.40 | September 22, 1980 |
| 140 | 140.40 | November 20, 1980 |
The Mid-1980s Bull Market (1982–1987)
| Milestone |
Closing level |
Date first achieved |
|---|
| 140.52[lower-alpha 4] | 142.87 | November 3, 1982 |
| 150 | 150.88 | March 1, 1983 |
| 160 | 160.71 | April 20, 1983 |
| 170 | 170.53 | June 21, 1983 |
| 180 | 180.35 | February 4, 1985 |
| 190 | 190.04 | June 4, 1985 |
| 200 | 201.41 | November 21, 1985 |
| 210 | 212.02 | December 16, 1985 |
| 220 | 222.45 | February 18, 1986 |
| 230 | 231.69 | March 11, 1986 |
| 240 | 242.22 | April 16, 1986 |
| 250 | 250.84 | June 30, 1986 |
| 260 | 260.30 | January 12, 1987 |
| 270 | 273.91 | January 22, 1987 |
| 280 | 281.16 | February 5, 1987 |
| 290 | 290.52 | March 5, 1987 |
| 300 | 301.16 | March 23, 1987 |
| 310 | 310.68 | July 14, 1987 |
| 320 | 322.09 | August 6, 1987 |
| 330 | 333.99 | August 14, 1987 |
| Milestone |
Closing level |
Date first achieved |
|---|
| 336.77[lower-alpha 5] | 338.05 | July 26, 1989 |
| 340 | 341.99 | July 27, 1989 |
| 350 | 351.52 | August 24, 1989 |
| 360 | 360.65 | May 29, 1990 |
| 370 | 370.47 | March 1, 1991 |
| 380 | 380.40 | April 12, 1991 |
| 390 | 390.45 | April 17, 1991 |
| 400 | 404.84 | December 26, 1991 |
| 410 | 415.14 | December 30, 1991 |
| 420 | 420.44 | January 14, 1992 |
| 430 | 430.16 | November 27, 1992 |
| 440 | 441.28 | December 18, 1992 |
| 450 | 454.71 | March 8, 1993 |
| 460 | 460.13 | August 25, 1993 |
| 470 | 470.54 | December 27, 1993 |
| 480 | 481.61 | January 31, 1994 |
| 490 | 490.05 | March 13, 1995 |
| 500 | 500.97 | March 24, 1995 |
| 520 | 520.48 | May 3, 1995 |
| 540 | 545.22 | June 19, 1995 |
| 560 | 560.89 | July 12, 1995 |
| 580 | 583.61 | September 14, 1995 |
| 600 | 600.07 | November 17, 1995 |
| 620 | 620.18 | December 6, 1995 |
| 640 | 641.43 | February 5, 1996 |
| 660 | 661.45 | February 12, 1996 |
| 680 | 680.54 | September 13, 1996 |
| 700 | 701.46 | October 4, 1996 |
| 720 | 724.59 | November 6, 1996 |
| 740 | 742.16 | November 19, 1996 |
| 760 | 768.86 | January 14, 1997 |
| 780 | 782.72 | January 21, 1997 |
| 800 | 802.77 | February 12, 1997 |
| 820 | 830.29 | May 5, 1997 |
| 840 | 841.88 | May 15, 1997 |
| 860 | 862.91 | June 9, 1997 |
| 880 | 883.46 | June 12, 1997 |
| 900 | 904.03 | July 2, 1997 |
| 920 | 925.76 | July 15, 1997 |
| 940 | 940.30 | July 24, 1997 |
| 960 | 960.32 | August 6, 1997 |
| 980 | 983.12 | October 7, 1997 |
| 1,000 | 1,001.27 | February 2, 1998 |
| 1,050 | 1,052.02 | March 3, 1998 |
| 1,100 | 1,105.65 | March 24, 1998 |
| 1,150 | 1,157.33 | July 6, 1998 |
| 1,200 | 1,202.84 | December 21, 1998 |
| 1,250 | 1,272.34 | January 6, 1999 |
| 1,300 | 1,307.26 | March 15, 1999 |
| 1,350 | 1,358.63 | April 12, 1999 |
| 1,400 | 1,403.28 | July 9, 1999 |
| 1,450 | 1,458.34 | December 23, 1999 |
| 1,500 | 1,500.64 | March 22, 2000 |
The Mid-2000s Cyclical Bull Market (2007)
| Milestone |
Closing level |
Date first achieved |
|---|
| 1,527.46[lower-alpha 6] | 1,530.23 | May 30, 2007 |
| 1,550 | 1,552.50 | July 13, 2007 |
The Mid 2010s Bull Market (2013-Present)
| Milestone |
Closing level |
Date first achieved |
|---|
| 1,565.15[lower-alpha 7] | 1,569.19 | March 28, 2013 |
| 1,600 | 1,614.42 | May 3, 2013 |
| 1,650 | 1,650.34 | May 14, 2013 |
| 1,700 | 1,706.87 | August 1, 2013 |
| 1,750 | 1,754.67 | October 22, 2013 |
| 1,800 | 1,804.76 | November 22, 2013 |
| 1,850 | 1,854.29 | February 27, 2014 |
| 1,900 | 1,900.53 | May 23, 2014 |
| 1,950 | 1,951.27 | June 9, 2014 |
| 2,000 | 2,000.02 | August 26, 2014 |
| 2,050 | 2,051.80 | November 18, 2014 |
| 2,100 | 2,100.34 | February 17, 2015 |
| 2,130.82[lower-alpha 8] | 2,137.16 | July 11, 2016 |
| 2,150 | 2,152.14 | July 12, 2016 |
| 2,200 | 2,202.94 | November 22, 2016 |
| 2,250 | 2,259.53 | December 9, 2016 |
| 2,300[lower-alpha 9] | 2,307.87 | February 9, 2017 |
| 2,350 | 2,351.16 | February 17, 2017 |
| 2,400[lower-alpha 10] | 2,402.32 | May 15, 2017 |
| 2,450 | 2,453.46 | June 19, 2017 |
| 2,500 | 2,500.23 | September 15, 2017 |
| 2,550 | 2,552.07 | October 5, 2017 |
| 2,600 | 2,602.42 | November 24, 2017 |
| 2,650 | 2,651.50 | December 8, 2017 |
| 2,700 | 2,713.06 | January 3, 2018 |
| 2,750 | 2,751.29 | January 9, 2018 |
| 2,800 | 2,802.56 | January 17, 2018 |
| 2,850 | 2,872.87 | January 26, 2018 |
| 2,900 | 2,914.04 | August 29, 2018 |
Notes
- ↑ This was the S&P 500's very first close on January 3, 1950.
- ↑ This was the S&P 500's close at the peak on February 9, 1966.
- ↑ This was the S&P 500's close at the peak on January 11, 1973 before the 1973–74 stock market crash.
- ↑ This was the S&P 500's close at the peak on November 28, 1980.
- ↑ This was the S&P 500's close at the peak on August 25, 1987 before Black Monday.
- ↑ This was the S&P 500's close at the peak on March 24, 2000 before the dot-com crash.[5]
- ↑ This was the S&P 500's close at the peak on October 9, 2007 before the 2008 financial crisis.
- ↑ This was the S&P 500's close at the peak on May 21, 2015 before the 2015-16 stock market selloff.
- ↑ The S&P first crossed 2,300 during the day on January 26, 2017 before falling below the level at closing. After that, the S&P retreated away from the 2,300-pt milestone for a possible selloff in the next month. It took two weeks for the S&P to finally close above 2,300.
- ↑ The S&P first crossed 2,400 during the day on March 1, 2017 before falling below the level at closing. After that, the S&P retreated away from the 2,400-pt milestone and then closed within 1 point of the milestone on May 5, 2017. Then on May 8, 2017, the S&P traded above 2,400 intraday then closed below that milestone again and did it the third time the very next day. However, it took until May 15, 2017 for the S&P to finally close above 2,400.