Climate of Dallas
| This article is part of a series on the | ||||||||||||||||||
| City of Dallas | ||||||||||||||||||
|---|---|---|---|---|---|---|---|---|---|---|---|---|---|---|---|---|---|---|
|
||||||||||||||||||
| Dallas – Fort Worth portal | ||||||||||||||||||
| Dallas | ||||||||||||||||||||||||||||||||||||||||||||||||||||||||||||
|---|---|---|---|---|---|---|---|---|---|---|---|---|---|---|---|---|---|---|---|---|---|---|---|---|---|---|---|---|---|---|---|---|---|---|---|---|---|---|---|---|---|---|---|---|---|---|---|---|---|---|---|---|---|---|---|---|---|---|---|---|
| Climate chart (explanation) | ||||||||||||||||||||||||||||||||||||||||||||||||||||||||||||
| ||||||||||||||||||||||||||||||||||||||||||||||||||||||||||||
| ||||||||||||||||||||||||||||||||||||||||||||||||||||||||||||
The city of Dallas has a humid subtropical climate (Köppen climate classification: Cfa) that is characteristic of the Southern Plains of the United States. Dallas experiences distinct four seasons with mild winters and hot summers.
During the winter season, daytime highs above 65 °F (18 °C) are not unusual. On the other hand, a couple of times each year, warm and humid air from the south overrides cold, dry air, leading to freezing rain, which often causes major disruptions in the city if the roads and highways become slick. Due to the city's location inland from the Gulf Coast, the city's climate is mildly continental: it is characterized by a relatively wide annual temperature range, as well as significant weather variations in a given month.
Spring and autumn bring pleasant weather to the area. Vibrant wildflowers (such as the bluebonnet, Indian paintbrush and other flora) bloom in spring and are planted around the highways throughout Texas.[2] Springtime weather can be quite volatile, but temperatures themselves are mild. The weather in Dallas is also generally pleasant between late September and early December, and unlike springtime, major storms rarely form in the area.
In the spring, cool fronts moving south from Canada collide with warm, humid air streaming in from the Gulf Coast. When these fronts meet over north central Texas, severe thunderstorms are generated with spectacular lightning shows, torrents of rain, hail, and occasionally, tornadoes (Dallas is located at the lower-end of the Tornado Alley). The U.S. Department of Agriculture places Dallas in Plant Hardiness Zone 8a.[3][4]
Summers are hot, with temperatures approaching those of desert and semidesert locations of similar latitude. Heat waves can be severe. During the summer, the region receives warm and dry winds from the north and west. The city's all-time recorded high temperature is 113 °F (45 °C) during the Heat Wave of 1980, while the all-time recorded low is −8 °F (−22 °C) 1899. The average daily low in Dallas is 57.1 °F (13.9 °C) and the average daily high in Dallas is 76.7 °F (24.8 °C). Dallas receives approximately 37.1 inches (942 mm) of equivalent rain per year.

Monthly normals and record temperatures
| Climate data for Dallas (Love Field), 1981–2010 normals,[lower-alpha 1] extremes 1913–present[lower-alpha 2] | |||||||||||||
|---|---|---|---|---|---|---|---|---|---|---|---|---|---|
| Month | Jan | Feb | Mar | Apr | May | Jun | Jul | Aug | Sep | Oct | Nov | Dec | Year |
| Record high °F (°C) | 88 (31) |
95 (35) |
97 (36) |
100 (38) |
103 (39) |
112 (44) |
112 (44) |
111 (44) |
110 (43) |
100 (38) |
92 (33) |
89 (32) |
112 (44) |
| Mean maximum °F (°C) | 76.4 (24.7) |
80.2 (26.8) |
85.6 (29.8) |
89.4 (31.9) |
95.2 (35.1) |
98.2 (36.8) |
103.0 (39.4) |
103.9 (39.9) |
98.8 (37.1) |
92.3 (33.5) |
82.9 (28.3) |
76.8 (24.9) |
105.0 (40.6) |
| Average high °F (°C) | 56.8 (13.8) |
60.8 (16) |
68.7 (20.4) |
76.7 (24.8) |
84.2 (29) |
91.6 (33.1) |
96.0 (35.6) |
96.4 (35.8) |
88.7 (31.5) |
78.5 (25.8) |
67.1 (19.5) |
57.5 (14.2) |
77.0 (25) |
| Average low °F (°C) | 37.3 (2.9) |
41.1 (5.1) |
48.5 (9.2) |
56.2 (13.4) |
65.4 (18.6) |
72.8 (22.7) |
76.7 (24.8) |
76.8 (24.9) |
69.0 (20.6) |
58.2 (14.6) |
47.6 (8.7) |
38.5 (3.6) |
57.4 (14.1) |
| Mean minimum °F (°C) | 21.7 (−5.7) |
24.3 (−4.3) |
30.5 (−0.8) |
40.2 (4.6) |
52.1 (11.2) |
63.0 (17.2) |
69.7 (20.9) |
68.5 (20.3) |
53.8 (12.1) |
42.3 (5.7) |
31.3 (−0.4) |
22.9 (−5.1) |
16.7 (−8.5) |
| Record low °F (°C) | −3 (−19) |
2 (−17) |
11 (−12) |
30 (−1) |
39 (4) |
53 (12) |
56 (13) |
57 (14) |
36 (2) |
26 (−3) |
17 (−8) |
1 (−17) |
−3 (−19) |
| Average precipitation inches (mm) | 2.06 (52.3) |
2.59 (65.8) |
3.49 (88.6) |
3.07 (78) |
4.92 (125) |
4.11 (104.4) |
2.21 (56.1) |
1.87 (47.5) |
2.84 (72.1) |
4.79 (121.7) |
2.88 (73.2) |
2.74 (69.6) |
37.57 (954.3) |
| Average snowfall inches (cm) | 0.5 (1.3) |
0.6 (1.5) |
0.1 (0.3) |
0 (0) |
0 (0) |
0 (0) |
0 (0) |
0 (0) |
0 (0) |
0 (0) |
trace | 0.3 (0.8) |
1.5 (3.8) |
| Average precipitation days (≥ 0.01 in) | 6.7 | 6.5 | 7.6 | 6.7 | 9.7 | 8.0 | 4.9 | 4.6 | 5.3 | 7.5 | 6.6 | 6.6 | 80.7 |
| Average snowy days (≥ 0.1 in) | 0.5 | 0.2 | 0.2 | 0 | 0 | 0 | 0 | 0 | 0 | 0 | 0.1 | 0.3 | 1.3 |
| Average relative humidity (%) | 67.5 | 66.4 | 63.7 | 65.3 | 69.7 | 65.8 | 59.8 | 59.5 | 66.5 | 65.7 | 67.4 | 67.5 | 65.4 |
| Mean monthly sunshine hours | 183.5 | 178.3 | 227.7 | 236.0 | 258.4 | 297.8 | 332.4 | 304.5 | 246.2 | 228.1 | 183.8 | 173.0 | 2,849.7 |
| Percent possible sunshine | 58 | 58 | 61 | 61 | 60 | 69 | 76 | 74 | 66 | 65 | 59 | 56 | 64 |
| Source: NOAA (sun and relative humidity 1961–1990 at DFW Airport)[lower-alpha 3][6][1][7] | |||||||||||||
Volatile weather
Tornadoes
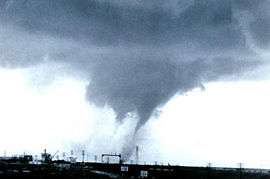
Since Dallas lies at the lower end of the "Tornado Alley", tornadoes have on occasion been a threat to the city. Dallas was hit by a powerful tornado on 2 April 1957. The tornado would have likely been an F3.[8] On March 28, 2000, the “Fort Worth Tornado” impacted Dallas's neighbor Fort Worth's downtown, and a tornado in Arlington, Texas also occurred that day damaging some homes. That day was the Metroplex's most damaging tornado outbreak since the 1957 event. Another widespread tornado outbreak struck the area in the Dallas tornado outbreak of April 3, 2012, slightly damaging Rangers Ballpark in Arlington and damaging some planes and grounding the others at Dallas-Fort Worth International Airport and Dallas Love Field, heavily damaging an elementary school, and destroying semis in a facility. On December 26, 2015, a rare winter tornado outbreak led to spawning several tornadoes, including an EF-4 tornado near the city of Garland and Rowlett that caused 10 deaths.
Floods
Major flooding occurred on the Trinity River in the years 1844, 1866, 1871, and 1890, but a major event in the spring of 1908 set in motion the harnessing of the river. On 26 May 1908, the Trinity River reached a depth of 52.6 feet (16.03 m) and a width of 1.5 miles (2.4 km).[9] Five people died, 4,000 were left homeless, and property damages were estimated at $2.5 million.
| “ | Now the wreckage of a shed or outhouse would move by, followed by a drowned swine or other livestock. The construction forces of the Texas & Pacific worked feverishly to safeguard the long trestle carrying their tracks across the stream. Suddenly this whole structure turned on its side down-stream, broke loose from the rest of the track at one end and swung out into the middle of the current and began breaking up, first into large sections and then into smaller pieces, rushing madly along to some uncertain destination. [Approximately half a dozen of the workmen fell into the torrent at this point; exaggerated reports of their drowning swept the city.] | ” |
| — C.L. Moss, [9] | ||
Dallas was without power for three days, all telephone and telegraph service was down, and rail service was canceled. The only way to reach Oak Cliff was by boat.[10] West Dallas was hit harder than any other part of the city—the Dallas Times Herald said "indescribable suffering" plagued the area. Much to the horror of residents, thousands of livestock drowned in the flood and some became lodged in the tops of trees—the stench of their decay hung over the city as the water subsided.[9]
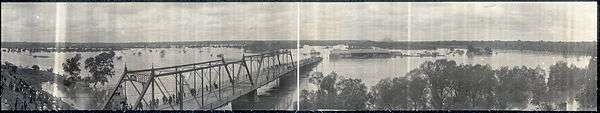
After the disastrous flood, the city wanted to find a way to control the reckless Trinity and to build a bridge linking Oak Cliff and Dallas. The immediate reaction was citizens and the city clamoring to build an indestructible, all-weather crossing over the Trinity. This had already been tried following the 1890 flood—the result was the "Long Wooden Bridge" that connected Jefferson Boulevard in Oak Cliff and Cadiz in Dallas, but the resulting unstable bridge was easily washed away by the 1908 flood. George B. Dealey, publisher of the Dallas Morning News, proposed a 1.5 miles (2.4 km) concrete bridge based on a bridge crossing the Missouri River in Kansas City. Ultimately a US$650,000 bond election was approved and in 1912, the Oak Cliff viaduct (now the Houston Street viaduct) was opened among festivities drawing 58,000 spectators. The bridge, at the time, was the longest concrete structure in the world.[9]
In May 2015, the Dallas-Fort Worth Airport received a record-shattering 16.96 inches of rainfall, in a month that obliterated heavy-rainfall records virtually throughout the Southern Plains (Texas and Oklahoma, especially). Strangely enough, a very hot, dry summer followed, resulting in some parts of Texas returning to abnormally dry conditions as early as July 2015, soon after the record May rains erased years-long drought conditions over the area.
El Niño–Southern Oscillation
The El Niño–Southern Oscillation (ENSO) determines for the most part what the winter and spring months are like in Dallas. During the warm phase,El Niño, winter and spring are colder and receive more snow than usual. Under the cold phase,La Niña, winter and spring are warmer and receive less snow.
Notes
- ↑ Mean monthly maxima and minima (i.e. the expected highest and lowest temperature readings at any point during the year or given month) calculated based on data at said location from 1981 to 2010.
- ↑ Official records for Dallas were kept at the Weather Bureau Office in downtown from 15 October 1913 to August 1940, and at Love Field since September 1940.[5]
- ↑ Sunshine normals are based on only 24 years of data.
References
- 1 2 "NOWData - NOAA Online Weather Data". National Oceanic & Atmospheric Administration. Retrieved 2018-07-24.
- ↑ TXDOT - Wildflower and Fall Foliage Archived April 8, 2007, at the Wayback Machine.. Retrieved on 17 April 2007.
- ↑ "Texas USDA Hardiness Zone Map". Retrieved 2010-11-28.
- ↑ USNA - USDA Archived 2008-07-08 at the Wayback Machine. Plant Hardiness Zone Map: South-Midwest US. Retrieved on 13 June 2006.
- ↑ ThreadEx
- ↑ "Station Name: TX DALLAS LOVE FLD". National Oceanic & Atmospheric Administration. January 2013. Retrieved 2014-03-27.
- ↑ "WMO Climate Normals for FORT WORTH/GREATER SW INT'L A,TX 1961–1990". National Oceanic and Atmospheric Administration. Retrieved 2014-03-10.
- ↑ Stormtrack.org - APRIL 2, 1957: DALLAS'S DATE WITH DISASTER Archived December 30, 2013, at the Wayback Machine.. Retrieved on 17 April 2006.
- 1 2 3 4 Payne, Darwin (1982). "Chapter V: A New Century, A New Dallas". Dallas, an illustrated history. Woodland Hills, California: Windsor Publications. pp. 119–155. ISBN 0-89781-034-1.
- ↑ Dallas Historical Society - Dallas History Archived 2006-04-22 at the Wayback Machine.. Retrieved 20 April 2006.