Climate of Brisbane
Brisbane has a humid subtropical climate (Köppen climate classification: Cfa)[1] with year-round period with warm to hot temperatures.[2][3]
Temperatures
Brisbane experiences an annual mean minimum of 16.6 °C (62 °F) and mean maximum of 26.6 °C (80 °F), making it Australia's second-hottest capital city after Darwin.[4] Seasonality is not pronounced, and average maximum temperatures of above 26 °C (79 °F) persist from October through to April.
Due to its proximity to the Coral Sea of the Pacific Ocean and a warm ocean current, Brisbane's overall temperature variability is somewhat less than most Australian capitals. Temperatures only occasionally reach 35 °C (95 °F) or more. June and July are the coldest months, with average maximums of about 22 °C (72 °F); maximum temperatures below 20 °C (68 °F) are rare. Brisbane has never recorded a sub-zero minimum temperature (with one exception at night), and minimums are generally warm to mild year-round, averaging about 21 °C (70 °F) in summer and 11 °C (52 °F) in coldest month.[4]
| Climate data for Brisbane (1999–2017) | |||||||||||||
|---|---|---|---|---|---|---|---|---|---|---|---|---|---|
| Month | Jan | Feb | Mar | Apr | May | Jun | Jul | Aug | Sep | Oct | Nov | Dec | Year |
| Average high °C (°F) | 30.3 (86.5) |
30.0 (86) |
29.0 (84.2) |
27.4 (81.3) |
24.5 (76.1) |
21.9 (71.4) |
21.9 (71.4) |
23.2 (73.8) |
25.6 (78.1) |
27.1 (80.8) |
28.2 (82.8) |
29.4 (84.9) |
26.5 (79.7) |
| Average low °C (°F) | 21.5 (70.7) |
21.3 (70.3) |
20.0 (68) |
17.4 (63.3) |
13.7 (56.7) |
11.8 (53.2) |
10.2 (50.4) |
10.8 (51.4) |
13.8 (56.8) |
16.2 (61.2) |
18.8 (65.8) |
20.4 (68.7) |
16.3 (61.3) |
| Source: Bureau of Meteorology.[5] | |||||||||||||
| Climate data for Brisbane Regional Office (1887–1986) | |||||||||||||
|---|---|---|---|---|---|---|---|---|---|---|---|---|---|
| Month | Jan | Feb | Mar | Apr | May | Jun | Jul | Aug | Sep | Oct | Nov | Dec | Year |
| Average high °C (°F) | 29.4 (84.9) |
29.0 (84.2) |
28.0 (82.4) |
26.1 (79) |
23.2 (73.8) |
20.9 (69.6) |
20.4 (68.7) |
21.8 (71.2) |
24.0 (75.2) |
26.1 (79) |
27.8 (82) |
29.1 (84.4) |
25.5 (77.9) |
| Average low °C (°F) | 20.7 (69.3) |
20.6 (69.1) |
19.4 (66.9) |
16.6 (61.9) |
13.3 (55.9) |
10.9 (51.6) |
9.5 (49.1) |
10.3 (50.5) |
12.9 (55.2) |
15.8 (60.4) |
18.1 (64.6) |
19.8 (67.6) |
15.7 (60.3) |
| Source: [6][7] | |||||||||||||
Records of temperatures
The city's highest recorded temperature was 43.2 °C (109.8 °F) on Australia Day 1940 at the Brisbane Regional Office,[8] with the highest temperature at the current station being 41.7 °C (107.1 °F) on 22 February 2004;[9] but temperatures above 38 °C (100 °F) are uncommon. On 19 July 2007, Brisbane's temperature fell below the freezing point for the first time since records began, registering −0.1 °C (31.8 °F) at the airport station.[10] The city station has never dropped below 2 °C (36 °F),[5] with the average coldest night during winter being around 6 °C (43 °F), however locations directly west of Brisbane such as Ipswich have dropped as low as −5 °C (23 °F) with heavy ground frost.[11] In 2009, the current Brisbane weather station recorded its hottest winter day at 35.4 °C (95.7 °F) on 24 August;[12] however, on the penultimate day of winter, the Brisbane Regional Office station recorded a temperature of 38.3 °C (100.9 °F) on 22 September 1943.[6][13] The average July day however is around 22 °C (72 °F) with sunny skies and low humidity, occasionally as high as 27 °C (81 °F), whilst maximum temperatures below 18 °C (64 °F) are uncommon and usually associated with brief periods of cloud and winter rain.[5] The highest minimum temperature ever recorded in Brisbane was 28.0 °C (82.4 °F) on 29 January 1940 and again on 21 January 2017, whilst the lowest maximum temperature was 10.2 °C (50.4 °F) on 12 August 1954.[8]
| Climate data for Brisbane (1999–2017) | |||||||||||||
|---|---|---|---|---|---|---|---|---|---|---|---|---|---|
| Month | Jan | Feb | Mar | Apr | May | Jun | Jul | Aug | Sep | Oct | Nov | Dec | Year |
| Record high °C (°F) | 40.0 (104) |
41.7 (107.1) |
37.9 (100.2) |
33.7 (92.7) |
30.7 (87.3) |
29.0 (84.2) |
28.2 (82.8) |
35.4 (95.7) |
37.0 (98.6) |
38.7 (101.7) |
38.9 (102) |
40.0 (104) |
41.7 (107.1) |
| Record low °C (°F) | 17.0 (62.6) |
16.5 (61.7) |
12.2 (54) |
10.0 (50) |
5.0 (41) |
5.0 (41) |
2.6 (36.7) |
4.1 (39.4) |
7.0 (44.6) |
8.8 (47.8) |
10.8 (51.4) |
14.0 (57.2) |
2.6 (36.7) |
| Source: Bureau of Meteorology.[5] | |||||||||||||
| Climate data for Brisbane Regional Office (1887–1986) | |||||||||||||
|---|---|---|---|---|---|---|---|---|---|---|---|---|---|
| Month | Jan | Feb | Mar | Apr | May | Jun | Jul | Aug | Sep | Oct | Nov | Dec | Year |
| Record high °C (°F) | 43.2 (109.8) |
40.9 (105.6) |
38.8 (101.8) |
36.1 (97) |
32.4 (90.3) |
31.6 (88.9) |
29.1 (84.4) |
32.8 (91) |
38.3 (100.9) |
40.7 (105.3) |
41.2 (106.2) |
41.2 (106.2) |
43.2 (109.8) |
| Record low °C (°F) | 14.9 (58.8) |
14.7 (58.5) |
11.3 (52.3) |
6.9 (44.4) |
4.8 (40.6) |
2.4 (36.3) |
2.3 (36.1) |
2.7 (36.9) |
4.8 (40.6) |
6.3 (43.3) |
9.2 (48.6) |
13.5 (56.3) |
2.3 (36.1) |
| Source: [6][14] | |||||||||||||
Precipitation
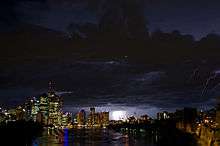
From November to March, thunderstorms are common over Brisbane, with the more severe events accompanied by large damaging hail stones, torrential rain and destructive winds. On an annual basis, Brisbane averages 124 clear days.[15] Dewpoints in the summer average at around 20 °C (68 °F); the apparent temperature exceeds 30 °C (86 °F) on almost all summer days.[5]
Brisbane's wettest day occurred on 21 January 1887, when 465 millimetres (18.3 in) of rain fell on the city, the highest maximum daily rainfall of Australia's capital cities. The wettest month on record was February 1893, when 1,025.9 millimetres (40.39 in) of rain fell, although in the last 30 years the record monthly rainfall has been a much lower 479.8 millimetres (18.89 in) from December 2010. Very occasionally a whole month will pass with no recorded rainfall, the last time this happened was August 1991.[8]
From 2001 until 2010, Brisbane and surrounding temperate areas had been experiencing the most severe drought in over a century, with dam levels dropping to 16.9% of their capacity on 10 August 2007. Residents were mandated by local laws to observe level 6 water restrictions on gardening and other outdoor water usage. Per capita water usage was below 140 litres per day, giving Brisbane one of the lowest per capita usages of water of any developed city in the world.[16] On 9 January 2011, an upper low crossed north of Brisbane and dropped rainfall on an already saturated southeast coast of Queensland, resulting in severe flooding and damage in Brisbane and the surrounding area;[17] the same storm season also caused the water storage to climb to over 98% of maximum capacity and broke the drought.[18] Water restrictions have been replaced with water conservation measures that aim at a target of 200 litres per day/per person, but consumption is rarely over 160 litres. In November 2011, Brisbane saw 22 days with no recorded rainfall, which was the driest start to a November since 1919.[19]
| Climate data for Brisbane (1999–2017) | |||||||||||||
|---|---|---|---|---|---|---|---|---|---|---|---|---|---|
| Month | Jan | Feb | Mar | Apr | May | Jun | Jul | Aug | Sep | Oct | Nov | Dec | Year |
| Average rainfall mm (inches) | 151.8 (5.976) |
142.5 (5.61) |
109.7 (4.319) |
67.4 (2.654) |
67.9 (2.673) |
68.4 (2.693) |
24.0 (0.945) |
40.6 (1.598) |
31.6 (1.244) |
69.0 (2.717) |
100.1 (3.941) |
131.0 (5.157) |
1,021.6 (40.22) |
| Average precipitation days | 12.2 | 13.3 | 14.2 | 11.7 | 9.5 | 9.7 | 7.3 | 6.0 | 7.8 | 8.7 | 11.3 | 13.3 | 125.0 |
| Source: Bureau of Meteorology.[5] | |||||||||||||
Sunshine
| Climate data for Brisbane (1999–2017) | |||||||||||||
|---|---|---|---|---|---|---|---|---|---|---|---|---|---|
| Month | Jan | Feb | Mar | Apr | May | Jun | Jul | Aug | Sep | Oct | Nov | Dec | Year |
| Mean monthly sunshine hours | 263.5 | 223.2 | 232.5 | 234.0 | 235.6 | 198.0 | 238.7 | 266.6 | 270.0 | 275.9 | 270.0 | 260.4 | 2,968.4 |
| Source: Bureau of Meteorology.[5] | |||||||||||||
Wind
Brisbane also lies in the Tropical Cyclone risk area, although cyclones are rare. The last to affect Brisbane was Severe Tropical Cyclone Debbie in March 2017. The city is susceptible to severe thunderstorms in the spring and summer months; on 16 November 2008 a severe storm caused tremendous damage in the outer suburbs, most notably The Gap. Roofs were torn off houses and hundreds of trees were felled. More recently, on 27 November 2014, a very strong storm made a direct hit on the city centre.[20] Described as 'the worst storm in a decade,' very large hail, to the size of cricket balls, smashed skyscraper windows while a flash flood tore through the CBD. Wind gusts of 141 km/h (88 mph) were recorded in some suburbs, many houses were severely damaged, cars were destroyed and planes were flipped at the Brisbane and Archerfield Airports.[20] Dust storms in Brisbane are extremely rare; on 23 September 2009, however, a severe dust storm blanketed Brisbane, as well as other parts of eastern Australia.[21][22]
Temperature of sea
The average annual temperature of the sea ranges from 21.0 °C (69.8 °F) in July to 27.0 °C (80.6 °F) in February.[23]
See also
References
- ↑ "Climate: Brisbane – Climate graph, Temperature graph, Climate table". Climate-Data.org. Archived from the original on 15 December 2013. Retrieved 28 August 2013.
- ↑ Tapper, Andrew; Tapper, Nigel (2006). "Sub-Synoptic-Scale Processes and Phenomena". In Gray, Kathleen. The weather and climate of Australia and New Zealand (Second ed.). Melbourne, Australia: Oxford University Press. p. 346. ISBN 978-0-19-558466-0.
- ↑ Linacre, Edward; Geerts, Bart (1997). "Southern Climates". Climates and Weather Explained. London: Routledge. p. 379. ISBN 0-415-12519-7.
- 1 2 "Climate statistics for Australian stations – Brisbane". Bureau of Meteorology. Archived from the original on 13 August 2017. Retrieved 12 February 2018.
- 1 2 3 4 5 6 7 "Brisbane". Climate statistics for Australian locations. Bureau of Meteorology. Retrieved 16 June 2013.
- 1 2 3 http://www.bom.gov.au/jsp/ncc/cdio/weatherData/av?p_nccObsCode=122&p_display_type=dailyDataFile&p_startYear=1986&p_c=-323581085&p_stn_num=040214
- ↑ http://www.bom.gov.au/jsp/ncc/cdio/weatherData/av?p_nccObsCode=123&p_display_type=dailyDataFile&p_startYear=1986&p_c=-323581281&p_stn_num=040214
- 1 2 3 "Brisbane Regional Office". Climate statistics for Australian locations. Bureau of Meteorology. Retrieved 15 January 2017.
- ↑ http://www.bom.gov.au/jsp/ncc/cdio/weatherData/av?p_nccObsCode=122&p_display_type=dailyDataFile&p_startYear=&p_c=&p_stn_num=040913
- ↑ Daniel Sankey and Tony Moore (19 July 2007). "Coldest day on record for Brisbane". The Brisbane Times. Archived from the original on 12 October 2007. Retrieved 5 January 2008.
- ↑ "AMBERLEY AMO". Climate statistics for Australian locations. Bureau of Meteorology. February 2014. Retrieved 9 February 2014.
- ↑ Unknown (24 August 2009). "Hot August day as Records Fall". The Brisbane Times. Archived from the original on 27 August 2009. Retrieved 31 August 2010.
- ↑ "Archived copy". Archived from the original on 20 October 2017. Retrieved 20 October 2017.
- ↑ http://www.bom.gov.au/jsp/ncc/cdio/weatherData/av?p_nccObsCode=123&p_display_type=dailyDataFile&p_startYear=1986&p_c=-323581281&p_stn_num=040214
- ↑ "Brisbane Aero". Climate statistics for Australian locations. Bureau of Meteorology. Retrieved 20 November 2014.
- ↑ "Brisbane residents best water savers in world: Newman". ABC News. Archived from the original on 20 May 2008. Retrieved 19 March 2008.
- ↑ "Raging floods bear down on Brisbane". Archived from the original on 5 February 2016.
- ↑ "SEQWater latest dam levels". Archived from the original on 14 October 2012.
- ↑ "November dry spell in Brisbane set to end as rain forecast". The Courier-Mail. Archived from the original on 12 February 2012. Retrieved 22 November 2011.
- 1 2 "Brisbane storm: Tens of thousands of south-east Queensland residents still without power after 'worst storm in a decade'". Archived from the original on 28 November 2014. Retrieved 28 November 2014.
- ↑ Cubby, Ben (23 September 2009). "Global warning: Sydney dust storm just the beginning". Brisbane Times. Brisbane. Archived from the original on 24 September 2009. Retrieved 25 September 2009.
- ↑ "Brisbane on alert as dust storms sweep east". Abc.net.au. 23 September 2009. Archived from the original on 30 November 2010. Retrieved 4 November 2012.
- ↑ "Brisbane Climate Guide". Archived from the original on 5 October 2011. Retrieved 9 October 2011.