Bristol City Council election, 1988
|
| |||||||||||||||||
| |||||||||||||||||
23 of 68 seats (one third) to Bristol City Council 35 seats needed for a majority | |||||||||||||||||
|---|---|---|---|---|---|---|---|---|---|---|---|---|---|---|---|---|---|
| |||||||||||||||||
| |||||||||||||||||
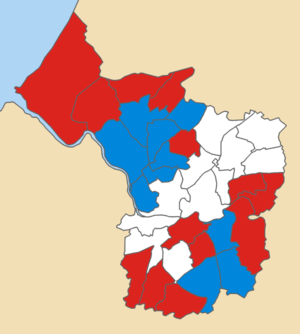
1988 local election results in Bristol
The 1988 Bristol City Council election took place on 5 May 1988 to elect members of Bristol City Council in England. This was on the same day as other local elections. One third of seats were up for election. This was the first election following the merger of the Liberal Party and SDP to form the Social & Liberal Democrats. There were also several candidates representing the continuing SDP. There was a general small swing to Labour.
Ward results
The change is calculated using the results when these actual seats were last contested, i.e. the 1984 election.
Avonmouth
| Party | Candidate | Votes | % | ± | |
|---|---|---|---|---|---|
| Labour | V.M. Horrigan | 2,349 | 50.3 | -7.4 | |
| Conservative | D.P. Pullin | 2,054 | 44.0 | +11.6 | |
| Liberal Democrat | E. Jacobs | 212 | 4.5 | -4.5 | |
| Green | L.G. Jeffries | 57 | 1.2 | +0.2 | |
| Majority | 295 | 6.3 | |||
| Labour hold | Swing | -9.5 | |||
- The Conservatives won Avonmouth in a by-election in 1987 and lost the seat back to Labour at this election.
Bishopston
| Party | Candidate | Votes | % | ± | |
|---|---|---|---|---|---|
| Labour | P.M. McLaren | 2,027 | 38.0 | +1.6 | |
| Conservative | M.C. Withers | 1,844 | 34.6 | -3.0 | |
| Liberal Democrat | S.V. Spilsbury | 1,318 | 24.7 | +0.8 | |
| Green | D.W. Bowring | 145 | 2.7 | +0.6 | |
| Majority | 183 | 3.4 | |||
| Labour gain from Conservative | Swing | +2.3 | |||
Bishopsworth
| Party | Candidate | Votes | % | ± | |
|---|---|---|---|---|---|
| Labour | J.B. McLaren | 1,808 | 48.9 | +0.4 | |
| Conservative | R.S. Eddy | 1,504 | 40.7 | -1.3 | |
| SDP | S.M. Willis | 249 | 6.7 | +6.7 | |
| Liberal Democrat | G.K. Hughes | 136 | 3.7 | -4.8 | |
| Majority | 304 | 8.2 | |||
| Labour hold | Swing | +0.9 | |||
Brislington East
| Party | Candidate | Votes | % | ± | |
|---|---|---|---|---|---|
| Labour | D.J. Herod | 2,561 | 50.7 | -4.4 | |
| Conservative | I.E. Temple | 1,950 | 38.6 | +6.9 | |
| Liberal Democrat | J. Exon | 446 | 8.8 | -3.7 | |
| Green | G.H. Davey | 95 | 1.9 | +1.2 | |
| Majority | 611 | 12.1 | |||
| Labour hold | Swing | -5.7 | |||
Brislington West
| Party | Candidate | Votes | % | ± | |
|---|---|---|---|---|---|
| Conservative | P. Dodd | 1,565 | 34.8 | -1.3 | |
| Liberal Democrat | A.G. D'Eyncourt-Harvey | 1,536 | 34.2 | -0.1 | |
| Labour | R.C. Hall | 1,264 | 28.1 | -0.4 | |
| Green | M.B. Wood | 126 | 2.8 | +1.8 | |
| Majority | 29 | 0.6 | |||
| Conservative hold | Swing | -0.6 | |||
Clifton
| Party | Candidate | Votes | % | ± | |
|---|---|---|---|---|---|
| Conservative | A.D. Tasker | 1,900 | 47.5 | +2.5 | |
| Liberal Democrat | E.R. Beaty | 925 | 23.1 | -14.8 | |
| Labour | G. Buchanan | 813 | 20.3 | +6.6 | |
| Green | G.A. Dorey | 215 | 5.4 | +2.0 | |
| SDP | W. Long | 150 | 3.7 | +3.7 | |
| Majority | 975 | 24.4 | |||
| Conservative hold | Swing | +8.7 | |||
Cotham
| Party | Candidate | Votes | % | ± | |
|---|---|---|---|---|---|
| Conservative | P.J. Sidebottom | 1,564 | 44.7 | +0.8 | |
| Labour | L.M. McCabe | 1,048 | 29.9 | +12.9 | |
| Liberal Democrat | M.R. Laker | 512 | 14.6 | -20.8 | |
| Green | G. Collard | 243 | 6.9 | +3.2 | |
| SDP | P.W. Lloyd | 134 | 3.8 | +3.8 | |
| Majority | 516 | 14.7 | |||
| Conservative hold | Swing | -6.1 | |||
Hartcliffe
| Party | Candidate | Votes | % | ± | |
|---|---|---|---|---|---|
| Labour | B.B. Richards | 2,021 | 62.7 | +8.2 | |
| Conservative | B.R. Edwards | 911 | 28.3 | -0.5 | |
| Liberal Democrat | I.H. Reed | 230 | 7.1 | -8.1 | |
| Green | D.A. Tayler | 59 | 1.8 | +0.3 | |
| Majority | 1,110 | 34.5 | |||
| Labour hold | Swing | +4.4 | |||
Henbury
| Party | Candidate | Votes | % | ± | |
|---|---|---|---|---|---|
| Labour | J. Patterson | 2,579 | 51.2 | +7.8 | |
| Conservative | L.J. Roberts | 1,973 | 39.2 | -3.9 | |
| SDP | W.S. Gibbens | 315 | 6.3 | +6.3 | |
| Liberal Democrat | E.A. Boney | 170 | 3.4 | -9.3 | |
| Majority | 606 | 12.0 | |||
| Labour hold | Swing | +5.9 | |||
Hengrove
| Party | Candidate | Votes | % | ± | |
|---|---|---|---|---|---|
| Conservative | D.R. Parsons | 2,065 | 40.6 | -13.0 | |
| Liberal Democrat | J.M. Webb | 1,706 | 33.6 | +33.6 | |
| Labour | M.P. McGrath | 1,239 | 24.4 | -18.7 | |
| Green | M.P.N. Turnbull | 70 | 1.4 | -1.9 | |
| Majority | 359 | 7.1 | |||
| Conservative hold | Swing | -23.3 | |||
Henleaze
| Party | Candidate | Votes | % | ± | |
|---|---|---|---|---|---|
| Conservative | J.M. Fey | 2,893 | 64.7 | -11.5 | |
| Liberal Democrat | J. Carpenter | 785 | 17.6 | +17.6 | |
| Labour | A.J. Danford | 629 | 14.1 | -2.3 | |
| Green | R.A. Glaves | 163 | 3.6 | -3.8 | |
| Majority | 2,108 | 47.2 | |||
| Conservative hold | Swing | -14.6 | |||
Horfield
| Party | Candidate | Votes | % | ± | |
|---|---|---|---|---|---|
| Conservative | F.J. Apperley | 2,136 | 52.1 | +11.6 | |
| Labour | R.P. Clease | 1,583 | 38.6 | +16.9 | |
| Liberal Democrat | S.E. Young | 377 | 9.2 | -28.0 | |
| Majority | 553 | 13.5 | |||
| Conservative hold | Swing | -2.7 | |||
Kingsweston
| Party | Candidate | Votes | % | ± | |
|---|---|---|---|---|---|
| Labour | A.E.C. Tudball | 2,346 | 52.3 | +7.0 | |
| Conservative | M.J. Farrington | 1,820 | 40.6 | -3.8 | |
| Liberal Democrat | F.R. Young | 320 | 7.1 | -1.9 | |
| Majority | 526 | 11.7 | |||
| Labour hold | Swing | +5.4 | |||
Knowle
| Party | Candidate | Votes | % | ± | |
|---|---|---|---|---|---|
| Labour | P. Roberts | 2,089 | 55.6 | -2.6 | |
| Conservative | T.J. Skipp | 1,331 | 35.5 | +2.9 | |
| Liberal Democrat | D.M. Usher | 261 | 7.0 | -0.5 | |
| Green | M.A. Pitt | 73 | 1.9 | +0.2 | |
| Majority | 758 | 20.2 | |||
| Labour hold | Swing | -2.8 | |||
Redland
| Party | Candidate | Votes | % | ± | |
|---|---|---|---|---|---|
| Conservative | R.S. Trench | 1,849 | 46.9 | -6.3 | |
| Labour | A.M. Wallder | 1,153 | 29.2 | +9.4 | |
| Liberal Democrat | S.C. Emmett | 692 | 17.6 | -4.0 | |
| Green | C.R. Leegwater | 248 | 6.3 | +0.8 | |
| Majority | 696 | 17.7 | |||
| Conservative hold | Swing | -7.9 | |||
St George East
| Party | Candidate | Votes | % | ± | |
|---|---|---|---|---|---|
| Labour | P.W. Hammond | 1,858 | 50.2 | +3.1 | |
| Conservative | P.C. Hole | 1,403 | 37.9 | -4.3 | |
| Liberal Democrat | G.H. Draper | 272 | 7.3 | -0.7 | |
| SDP | J.R.S. Osborne | 106 | 2.9 | +2.9 | |
| Green | C.A. Stones | 64 | 1.7 | -1.1 | |
| Majority | 455 | 12.3 | |||
| Labour hold | Swing | +3.7 | |||
St George West
| Party | Candidate | Votes | % | ± | |
|---|---|---|---|---|---|
| Labour | C. O'Sullivan | 1,690 | 44.6 | +10.9 | |
| Liberal Democrat | B.J. Pinkerton | 1,521 | 40.1 | -4.8 | |
| Conservative | D.A. Wiltshire | 513 | 13.5 | -7.5 | |
| Green | C. Adams | 66 | 1.7 | +1.3 | |
| Majority | 169 | 4.5 | |||
| Labour gain from Liberal Democrat | Swing | +7.9 | |||
Southmead
| Party | Candidate | Votes | % | ± | |
|---|---|---|---|---|---|
| Labour | L. Broomhead | 2,288 | 60.4 | +3.6 | |
| Conservative | A.M.B. Orr | 1,209 | 31.9 | -0.2 | |
| Liberal Democrat | B.A. Knott | 288 | 7.6 | -2.3 | |
| Majority | 1,079 | 28.5 | |||
| Labour hold | Swing | +1.9 | |||
Stockwood
| Party | Candidate | Votes | % | ± | |
|---|---|---|---|---|---|
| Conservative | C.J.N. Williams | 2,635 | 47.8 | +2.7 | |
| Labour | D.J. Redgewell | 2,290 | 41.5 | +1.2 | |
| Liberal Democrat | R.C. Bingham | 439 | 8.0 | -5.9 | |
| SDP | R.A. Dickson | 85 | 1.5 | +1.5 | |
| Green | L.D. Golden | 66 | 1.2 | +0.5 | |
| Majority | 345 | 6.3 | |||
| Conservative hold | Swing | +0.8 | |||
Stoke Bishop
| Party | Candidate | Votes | % | ± | |
|---|---|---|---|---|---|
| Conservative | C.D.M.B. Alderson | 2,964 | 67.5 | +3.0 | |
| Labour | D.A.W. Branch | 661 | 15.1 | +3.8 | |
| Liberal Democrat | D.K. Jones | 609 | 13.9 | -6.3 | |
| Green | L. Hersey | 155 | 3.5 | -0.6 | |
| Majority | 2,303 | 52.5 | |||
| Conservative hold | Swing | -0.4 | |||
Westbury-on-Trym
| Party | Candidate | Votes | % | ± | |
|---|---|---|---|---|---|
| Conservative | R.W. Wall | 3,282 | 68.9 | -3.9 | |
| Labour | T.C. Collins | 639 | 13.4 | +4.0 | |
| Liberal Democrat | A.D. West | 424 | 8.9 | -6.5 | |
| SDP | H.S. Long | 275 | 5.8 | +5.8 | |
| Green | D.C. Watson | 145 | 3.0 | +0.5 | |
| Majority | 2,643 | 55.5 | |||
| Conservative hold | Swing | -4.0 | |||
Whitchurch Park
| Party | Candidate | Votes | % | ± | |
|---|---|---|---|---|---|
| Labour | P.H. Smith | 2,510 | 72.2 | +8.9 | |
| Conservative | T.J. Part | 713 | 20.5 | -6.4 | |
| Liberal Democrat | R.C. Steadman | 202 | 5.8 | -2.5 | |
| Green | B.B. Hussain | 51 | 1.5 | 0.0 | |
| Majority | 1,797 | 51.7 | |||
| Labour hold | Swing | +7.7 | |||
Windmill Hill
| Party | Candidate | Votes | % | ± | |
|---|---|---|---|---|---|
| Labour | P.R. Tatlow | 2,823 | 66.7 | +12.0 | |
| Conservative | S. Woodward | 978 | 23.1 | -9.2 | |
| Liberal Democrat | D.J.A. Boyle | 300 | 7.1 | -3.4 | |
| Green | S.J. Campbell | 134 | 3.2 | +0.7 | |
| Majority | 1,845 | 43.6 | |||
| Labour hold | Swing | +10.6 | |||
Sources
- Bristol Evening Post 6 May 1988
| Metropolitan boroughs |
|
|---|---|
| District councils (England) |
|
| District councils (Scotland) |
|
| Bristol City Council | |
|---|---|
| Mayor of Bristol | |
| Avon County Council |
|
| |
This article is issued from
Wikipedia.
The text is licensed under Creative Commons - Attribution - Sharealike.
Additional terms may apply for the media files.