Approximation error

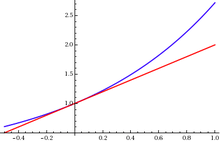
The approximation error in some data is the discrepancy between an exact value and some approximation to it. An approximation error can occur because:
- the measurement of the data is not precise due to the instruments. (e.g., the accurate reading of a piece of paper is 4.5 cm but since the ruler does not use decimals, you round it to 5 cm.) or
- approximations are used instead of the real data (e.g., 3.14 instead of π).
In the mathematical field of numerical analysis, the numerical stability of an algorithm indicates how the error is propagated by the algorithm.
Formal Definition
One commonly distinguishes between the relative error and the absolute error.
Given some value v and its approximation vapprox, the absolute error is
where the vertical bars denote the absolute value. If the relative error is
and the percent error is
In words, the absolute error is the magnitude of the difference between the exact value and the approximation. The relative error is the absolute error divided by the magnitude of the exact value. The percent error is the relative error expressed in terms of per 100.
Generalizations
These definitions can be extended to the case when and are n-dimensional vectors, by replacing the absolute value with an n-norm.[1]
Examples
As an example, if the exact value is 50 and the approximation is 49.9, then the absolute error is 0.1 and the relative error is 0.1/50 = 0.002 = 0.2%. Another example would be if, in measuring a 6 mL beaker, the value read was 5 mL. The correct reading being 6 mL, this means the percent error in that particular situation is, rounded, 16.7%.
Uses of relative error
The relative error is often used to compare approximations of numbers of widely differing size; for example, approximating the number 1,000 with an absolute error of 3 is, in most applications, much worse than approximating the number 1,000,000 with an absolute error of 3; in the first case the relative error is 0.003 and in the second it is only 0.000003.
There are two features of relative error that should be kept in mind. Firstly, relative error is undefined when the true value is zero as it appears in the denominator (see below). Secondly, relative error only makes sense when measured on a ratio scale, (i.e. a scale which has a true meaningful zero), otherwise it would be sensitive to the measurement units. For example, when an absolute error in a temperature measurement given in Celsius scale is 1 °C, and the true value is 2 °C, the relative error is 0.5, and the percent error is 50%. For this same case, when the temperature is given in Kelvin scale, the same 1 K absolute error with the same true value of 275.15 K gives a relative error of 3.63×10⁻³ and a percent error of only 0.363%. Celsius temperature is measured on an interval scale, whereas the Kelvin scale has a true zero and so is a ratio scale.
Instruments
In most indicating instruments, the accuracy is guaranteed to a certain percentage of full-scale reading. The limits of these deviations from the specified values are known as limiting errors or guarantee errors.[2]
See also
References
- ↑ Golub, Gene; Charles F. Van Loan (1996). Matrix Computations – Third Edition. Baltimore: The Johns Hopkins University Press. p. 53. ISBN 0-8018-5413-X.
- ↑ Helfrick, Albert D. (2005) Modern Electronic Instrumentation and Measurement Techniques. p. 16. ISBN 81-297-0731-4