Action spectrum
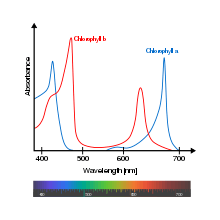
An action spectrum is a graph of the rate of a physiological activity plotted against wavelength of light.[1] It shows which wavelength of light is most effectively used in a specific chemical reaction. Some reactants are able to use specific wavelengths of light more effectively to complete their reactions. For example, chlorophyll is much more efficient at using the red and blue spectrums of light to carry out photosynthesis. Therefore, the action spectrum graph would show spikes above the wavelengths representing the colours red and blue.
The first action spectrum was made by T. W. Engelmann, who split light into its components by the prism and then illuminated Cladophora placed in a suspension of aerobic bacteria. He found that bacteria accumulated in the region of blue and red light of the split spectrum. He thus discovered the effect of the different wavelengths of light on photosynthesis and plotted the first action spectrum of photosynthesis.[2]
See also
References
External links