Overview of FSL
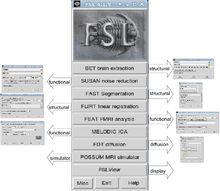
FSL is a comprehensive library of analysis tools for FMRI, MRI and DTI brain imaging data. It could be used either by FSL main GUI or the commond-lines. The advantage of the GUI lies in its simplicity but the drawback is the less flexibility comparing to the command-lines. FSLView as the display tool could be completely separate use from processing and analysis. Currently FSL only accepts the input files in NIFTI format, and the DICOM files need to be converted to NIFTI after acquisition and before processing. The convertion from DICOM to NIFIT could be fulfilled by several methods, such as dcm2nii from mricron or dcmstack. In the GUI there are nine popular modules are defined, and depending on the input file types, they fall into functional-oriented, structural-oriented or diffusion-oriented modules. The structural-oriented functions include "BET brain extraction", "FAST segmentation", "FLIRT: linear registration"; the functional-oriented functions invole "SUSAN noise reduction","FEAT FMRI analysis" and "MELODIC ICA"; the DTI-oriented functions incorporate "FDT diffusion". Besides these functional modules, there is a simulator called "POSSIUM MRI simulator", which is a software tool to produce realistic simulated MRI and FMRI images or time series. POSSUM (Physics-Oriented Simulated Scanner for Understanding MRI) includes tools for the pulse sequence generation, signal generation, noise addition and image reconstruction.
How to launch FSL
Suppose all the environmental vairables are settled well for FSL, there are two ways to lauch FSL, either from the user GUI or command-line.
User GUI
Just type fsl in the console and get access to the main GUI, from where you could reach to the modules by clicking on the options.
fsl
Depending on your operating system, you might need to do some additional steps prior to type in this starting command into your console/terminal
| operating system | preparing steps |
|---|---|
| Linux/Unix | to tell your terminal, that the following commands are referred to the fsl-toolbox, your need to type in
FSL in capital letters. Afterwards you will get a message, that your terminal will accept fsl-commands. |
| Windows | FSL is not running under Windows. Therefore you will need additional software, to emulate another operating system. FSL will run perfectly under a vitual machine like VMware Player[1] or VirtualBox[2] |
| Mac OS X | no prior steps needed |
If you want to jump to specific modules directly, then just type in the name starting with a capital letter, e.g. Melodic for Melodic ICA
Melodic
Command-line
If you want to launch a function from the command line, just type the function name in lowercase, along with the necessary arguments to the function.
melodic -i inputfile
FSL function overviews
Structural image processing
| Function | GUI/command | Aim | Online document |
|---|---|---|---|
| BET | Both | Brain extraction | http://fsl.fmrib.ox.ac.uk/fsl/fslwiki/BET |
| FAST | Both | Tissue segmentation | http://fsl.fmrib.ox.ac.uk/fsl/fslwiki/FAST |
| FIRST | Command | Subcortical segmentation | http://fsl.fmrib.ox.ac.uk/fsl/fslwiki/FIRST |
| FLIRT | Both | Linear registration | http://fsl.fmrib.ox.ac.uk/fsl/fslwiki/FLIRT |
| FNIRT | Command | Nonlinear registration | http://fsl.fmrib.ox.ac.uk/fsl/fslwiki/FNIRT |
| FUGUE | Command | EPI distortion correction | http://fsl.fmrib.ox.ac.uk/fsl/fslwiki/FUGUE |
| SIENA | Command | Atrophy analysis | http://fsl.fmrib.ox.ac.uk/fsl/fslwiki/SIENA |
| FSL-VBM | Command | Grey matter density | http://fsl.fmrib.ox.ac.uk/fsl/fslwiki/FSLVBM |
Functional MRI data analysis
In FSL, the functional images could be analyzed in two integration workflows, rather than step-by-step as in SPM and AFNI. Analysis for an experiment can be set up in less than 1 minute and finished in 5-20 minutes for the first-level session, producing a web page analysis report, including colour activation images and time-course plots of data vs model.
FEAT is based on general linear modelling (GLM). It allows to describe the experimental design; then a model is created that should fit the data, telling you where the brain has activated in response to the stimuli. In FEAT, the GLM method used on first-level (time-series) data is known as FILM. FILM uses a robust and accurate nonparametric estimation of time series autocorrelation to prewhiten each voxel's time series; this gives improved estimation efficiency compared with methods that do not pre-whiten.

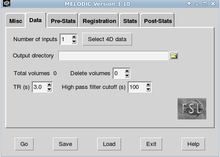
MELODIC is model-free analysis which uses Independent Component Analysis (ICA) to decompose a single or multiple 4D data sets into different spatial and temporal components. MELODIC can pick out different activation and artefactual components without any explicit time series model being specified.
FSLUTILS
FSLUTILS is a set of useful command-line utilities which allow the conversion, processing etc. of Analyze and Nifti format data sets. Many of them work on both 3D and 4D data. For each of these programs, type just the program name to get the usage help. Those commands could be broadly divided into four categories depending on their aims.
1. Mathematical manipulation of images
| Function | Aim | Examplary command |
|---|---|---|
| fslcc | Run cross-correlations between every volume in one 4D data set with every volume in another | fslcc input1.nii input2.nii (measure similarities in ICA outputs) |
| fslfft | Outputs the Fast-Fourier Transform (or inverse) for a complex input volume | fslfft input.vol output.vol |
| fslmaths | Simple but powerful program to allow mathematical manipulation of images | fslmaths func_data.nii -bptf 25.0 -1 func_data_tempfilt.nii (bandpass temporal filtering) |
| fslmeants | Output the average timeseries of a set of voxels | fslmeants -i input.nii -o mean.txt -m mask (preliminary step for seed-based correlelation) |
| fslroi | Extract region of interest (ROI) from an image | fslroi input.nii output_roi.nii 0 1 (extract the first volume) |
2. File combination and splitting
| Function | Aim | Examplary command |
|---|---|---|
| fslcomplex | Allow 3D or 4D complex image files to be split or constructed from corresponding real components | fslcomplex -complexsplit source dest 1 3 |
| fslinterleave | Interleave two inputs to form a combined image, and this combination is in Z axis only | fslinterleave input1 input2 output |
| fslmerge | Concatenate image files into a single output. This concatenation can be in time, X, Y or Z axis | fslmerge -t outfile infile1 infile2 (concatenate files in time series) |
| fslslice | Split a 3D file into lots of 2D files along Z-axis. | fslslice volfile slicefile |
| fslsplit | Split a 4D file into lots of 3D files in either time, X,Y,or Z axis | fslsplit -t input outfileprefix (split volumes along time series) |
3. Header-related utilities
| Function | Aim | Examplary command |
|---|---|---|
| fslcpgeom | Copy certain parts of the header information from one image to another with identical file type. | fslcpgeom source dest |
| fslcreatehd | Creates a new image header along with a zero intensity data image. | fslcreatehd |
| fslhd | Report every field of an Analyze or Nifti header | fslhd input.nii |
| fslinfo | Report a basic subset of an Analyze or Nifti header. | fslinfo input.nii |
| fslval | Report a particular parameter from an image header | fslval input.nii |
4. Orientation-related Utilities
| Function | Aim | Examplary command |
|---|---|---|
| fslreorient2std | Reorient an image to match the orientation of the standard template images (MNI152), but this only rotated to 90, 180 or 270 degree and can't substitute coregistration | fslreorient2std input output |
| fslorient | Advanced tool that reports or sets the orientation information in a file | fslorient -forceradiological input |
| fslswapdim | Advanced tool that re-orders the data storage to permit changes between axial, sagittal and coronal slicing | fslswapdim |
FSLView
The FSLView could be launched from terminal by typingː
fslview --help
1.Cursor view

Box-1ː show and control the cursor position in voxels
Box-2ː show and control the cursor position in mm
Box-3ː shows and controls the current volume in a 4D dataset
Box-4ː shows the value in the voxel at the current cursor position
2.FSL image overlay
Box-1ː The layer marked with chevrons to the right of it is the "main layer". This layer is the first one loaded during any given session and cannot be removed from the list as much of the viewer's display capabilities are determined from this layer's attributes.
Box-2ː Visibilty" checkbox controls whether or not a given layer is visible; "Lock" checkbox determines if a given layer can be edited or not; "Transparency" slider determines how the selected layer blends with the layers below it