scatter plot
See also: scatterplot
English
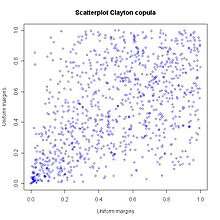
A scatter plot.
Noun
scatter plot (plural scatter plots)
- (statistics) A type of display using Cartesian coordinates to display values for two variables for a set of data.
This article is issued from
Wiktionary.
The text is licensed under Creative
Commons - Attribution - Sharealike.
Additional terms may apply for the media files.