box plot
See also: boxplot
English
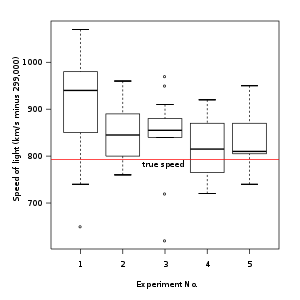
Figure 1. Box plot of data from the Michelson–Morley experiment
Alternative forms
Noun
- (statistics) A graphical summary of a numerical data sample through five statistics: median, lower quartile, upper quartile, and some indication of more extreme upper and lower values.
Synonyms
- box-and-whisker diagram
Translations
graphical summary of data
|
See also
This article is issued from
Wiktionary.
The text is licensed under Creative
Commons - Attribution - Sharealike.
Additional terms may apply for the media files.