Deutscher Handballbund
De Deutscher Handballbund (DHB) is de koepelorganisatie in Duitsland voor de beoefening van het handbal. De DHB organiseert het handbal in Duitsland en vertegenwoordigt het Duitse handbal op internationale sportevenementen.
Deutscher Handballbund
| ||||
| Duitse Handbalbond | ||||
| DHB | ||||
| Sport | ||||
| Land | ||||
| Algemene gegevens | ||||
| Voorzitter | Andreas Michelmann | |||
| Zetel | Dortmund | |||
| Oprichtingsjaar | 1 oktober 1949 | |||
| Aantal leden | 756.987 (2016) | |||
| Aantal verenigingen | 4.356 (2016) | |||
| Structuur | ||||
| Wereldbond | IHF | |||
| Europese bond | EHF | |||
| Olympisch comité | Duits Olympisch Comité | |||
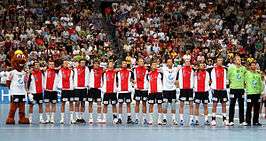 | ||||
Duits nationaal handbalteam in 2008 | ||||
| Website | ||||
| ||||
De bond is opgericht in 1949 en sinds 1950 lid van de Internationale Handbalfederatie. De DHB werd na de eenwording van Duitsland in 1991 ook lid van de Europese Handbalfederatie. Anno 2016 telde de federatie 756.987 leden, verspreid over 4.356 verenigingen. Daarmee is de DHB de grootste van alle nationale handbalbonden.
Nationale ploegen
- Duits handbalteam (mannen)
- Duits handbalteam (vrouwen)
- Duits handbalteam junioren (mannen)
- Duits handbalteam junioren (vrouwen)
- Duits handbalteam jeugd (mannen)
- Duits handbalteam jeugd (vrouwen)
Ledenaantallen
Hieronder de ontwikkeling van het ledenaantal en het aantal verenigingen:[1]
| Jaar | Ledenaantallen | Verenigingen | ||
|---|---|---|---|---|
| Mannen | Vrouwen | Totaal | ||
| 2016 | 472.652 | 284.335 | 756.987 | 4.356 |
| 2015 | 480.023 | 287.303 | 767.326 | 4.414 |
| 2014 | 492.735 | 294.013 | 786.748 | 4.467 |
| 2013 | 501.909 | 301.464 | 803.373 | 4.539 |
| 2012 | 511.499 | 307.141 | 818.640 | 4.587 |
| 2011 | 519.223 | 313.074 | 832.297 | 4.651 |
| 2010 | 527.589 | 318.770 | 846.359 | 4.712 |
| 2009 | 528.196 | 319.210 | 847.406 | 4.634 |
| 2008 | 526.844 | 315.226 | 842.070 | |
| 2007 | 509.731 | 309.813 | 819.544 | 3.196 |
| 2006 | 519.332 | 314.302 | 833.634 | |
| 2005 | 519.672 | 313.891 | 833.563 | 3.255 |
| 2004 | 516.425 | 310.190 | 826.615 | 3.745 |
| 2003 | 517.293 | 310.612 | 827.905 | |
| 2002 | 520.817 | 311.086 | 831.903 | |
| 2001 | 520.574 | 311.850 | 832.424 | |
| 2000 | 826.002 | |||
| 1936 | 184.829 | 19.036 | 203.865 | 5.494[2] |
Per deelstaat
| Jaar | Ledenaantallen | |||||||||||||||
|---|---|---|---|---|---|---|---|---|---|---|---|---|---|---|---|---|
| BW | BY | BE | BB | HB | HH | HE | MV | NI | NW | RP | SL | SN | ST | SH | TH | |
| 2018 | 162.050 | 9.177 | ||||||||||||||
| 2017 | 156.011 | 89.497 | 163.681 | 14.135 | ||||||||||||
| 2016 | 89.937 | 164.043 | 13.998 | |||||||||||||
| 2015 | 157.126 | 89.151 | 166.605 | 13.700 | ||||||||||||
| 2014 | 90.024 | 173.335 | 13.836 | |||||||||||||
| 2013 | 91.040 | 177.414 | 13.662 | |||||||||||||
| 2012 | 92.058 | 181.502 | 13.085 | |||||||||||||
| 2011 | 93.393 | 185.048 | 12.315 | |||||||||||||
| 2010 | 93.880 | 190.859 | 12.650 | |||||||||||||
| 2009 | 95.297 | 191.723 | ||||||||||||||
| 2008 | 94.432 | 190.077 | ||||||||||||||
| 2007 | 85.109 | 184.664 | ||||||||||||||
| 2006 | 90.784 | 186.350 | ||||||||||||||
| 2005 | 184.290 | |||||||||||||||
| 2004 | 181.613 | |||||||||||||||
| 2003 | 181.625 | |||||||||||||||
| 2002 | 181.932 | |||||||||||||||
| 2001 | 180.045 | |||||||||||||||
| 2000 | 183.206 | |||||||||||||||
| 1999 | 181.876 | |||||||||||||||
| 1998 | 183.512 | |||||||||||||||
| 1997 | 181.969 | |||||||||||||||
Mannen
| Jaar | Ledenaantallen | |||||||||||||||
|---|---|---|---|---|---|---|---|---|---|---|---|---|---|---|---|---|
| BW | BY | BE | BB | HB | HH | HE | MV | NI | NW | RP | SL | SN | ST | SH | TH | |
| 2018 | 103.568 | 6.129 | ||||||||||||||
| 2017 | 101.008 | 104.832 | 8.808 | |||||||||||||
| 2016 | 104.898 | 8.800 | ||||||||||||||
| 2015 | 102.289 | 107.031 | 8.687 | |||||||||||||
| 2014 | 112.114 | 8.706 | ||||||||||||||
| 2013 | 114.661 | 8.608 | ||||||||||||||
| 2012 | 117.387 | 8.237 | ||||||||||||||
| 2011 | 119.644 | 7.962 | ||||||||||||||
| 2010 | 122.763 | |||||||||||||||
| 2009 | 123.371 | |||||||||||||||
| 2008 | 122.158 | |||||||||||||||
| 2007 | 118.163 | |||||||||||||||
| 2006 | 119.799 | |||||||||||||||
| 2005 | 119.014 | |||||||||||||||
| 2004 | 117.012 | |||||||||||||||
| 2003 | 117.236 | |||||||||||||||
| 2002 | 117.468 | |||||||||||||||
| 2001 | 116.078 | |||||||||||||||
| 2000 | 118.587 | |||||||||||||||
| 1999 | 118.126 | |||||||||||||||
| 1998 | 119.821 | |||||||||||||||
| 1997 | 120.032 | |||||||||||||||
Vrouwen
| Jaar | Ledenaantallen | |||||||||||||||
|---|---|---|---|---|---|---|---|---|---|---|---|---|---|---|---|---|
| BW | BY | BE | BB | HB | HH | HE | MV | NI | NW | RP | SL | SN | ST | SH | TH | |
| 2018 | 58.482 | 3.048 | ||||||||||||||
| 2017 | 55.003 | 58.849 | 5.327 | |||||||||||||
| 2016 | 59.145 | 5.198 | ||||||||||||||
| 2015 | 54.837 | 59.574 | 5.013 | |||||||||||||
| 2014 | 61.221 | 5.130 | ||||||||||||||
| 2013 | 62.753 | 5.054 | ||||||||||||||
| 2012 | 64.115 | 4.848 | ||||||||||||||
| 2011 | 65.404 | 4.353 | ||||||||||||||
| 2010 | 68.096 | |||||||||||||||
| 2009 | 68.352 | |||||||||||||||
| 2008 | 67.919 | |||||||||||||||
| 2007 | 66.501 | |||||||||||||||
| 2006 | 66.551 | |||||||||||||||
| 2005 | 65.276 | |||||||||||||||
| 2004 | 64.601 | |||||||||||||||
| 2003 | 64.389 | |||||||||||||||
| 2002 | 64.464 | |||||||||||||||
| 2001 | 63.967 | |||||||||||||||
| 2000 | 64.619 | |||||||||||||||
| 1999 | 63.750 | |||||||||||||||
| 1998 | 63.691 | |||||||||||||||
| 1997 | 61.937 | |||||||||||||||
Verenigingen
| Jaar | Ledenaantallen | |||||||||||||||
|---|---|---|---|---|---|---|---|---|---|---|---|---|---|---|---|---|
| BW | BY | BE | BB | HB | HH | HE | MV | NI | NW | RP | SL | SN | ST | SH | TH | |
| 2018 | 791 | 92 | ||||||||||||||
| 2017 | 476 | 804 | 118 | |||||||||||||
| 2016 | 478 | 831 | 121 | |||||||||||||
| 2015 | 480 | 829 | 123 | |||||||||||||
| 2014 | 479 | 836 | 127 | |||||||||||||
| 2013 | 480 | 843 | 129 | |||||||||||||
| 2012 | 489 | 852 | 130 | |||||||||||||
| 2011 | 495 | 859 | 142 | |||||||||||||
| 2010 | 492 | 867 | 140 | |||||||||||||
| 2009 | 500 | 868 | ||||||||||||||
| 2008 | 499 | 878 | ||||||||||||||
| 2007 | 494 | 879 | ||||||||||||||
| 2006 | 505 | 881 | ||||||||||||||
| 2005 | 886 | |||||||||||||||
| 2004 | 882 | |||||||||||||||
| 2003 | 887 | |||||||||||||||
| 2002 | 892 | |||||||||||||||
| 2001 | 897 | |||||||||||||||
| 2000 | 907 | |||||||||||||||
| 1999 | 907 | |||||||||||||||
| 1998 | 922 | |||||||||||||||
| 1997 | 923 | |||||||||||||||
Per bond
| Jaar | Ledenaantallen | |||||||||||||||
|---|---|---|---|---|---|---|---|---|---|---|---|---|---|---|---|---|
| HVM | HVN | HVW | ||||||||||||||
| 2018 | 24.380 | 45.218 | 92.452 | |||||||||||||
| 2017 | 24.478 | 45.969 | 93.234 | |||||||||||||
| 2016 | 24.742 | 46.104 | 93.197 | |||||||||||||
| 2015 | 25.047 | 46.457 | 95.101 | |||||||||||||
| 2014 | 25.699 | 48.570 | 99.066 | |||||||||||||
| 2013 | 26.328 | 50.068 | 101.018 | |||||||||||||
| 2012 | 27.261 | 51.113 | 103.128 | |||||||||||||
| 2011 | 27.551 | 52.847 | 104.650 | |||||||||||||
| 2010 | 28.202 | 53.950 | 108.707 | |||||||||||||
| 2009 | 28.371 | 54.410 | 108.942 | |||||||||||||
| 2008 | 28.144 | 55.079 | 106.854 | |||||||||||||
| 2007 | 26.594 | 53.946 | 104.124 | |||||||||||||
| 2006 | 27.015 | 54.729 | 104.606 | |||||||||||||
| 2005 | 25.139 | 55.608 | 103.543 | |||||||||||||
| 2004 | 25.192 | 54.317 | 102.104 | |||||||||||||
| 2003 | 25.076 | 54.158 | 102.391 | |||||||||||||
| 2002 | 24.521 | 54.578 | 102.833 | |||||||||||||
| 2001 | 25.036 | 53.210 | 101.799 | |||||||||||||
| 2000 | 25.364 | 56.031 | 101.811 | |||||||||||||
| 1999 | 24.704 | 55.042 | 102.130 | |||||||||||||
| 1998 | 24.939 | 54.715 | 103.858 | |||||||||||||
| 1997 | 25.136 | 53.939 | 102.894 | |||||||||||||
Mannen
| Jaar | Ledenaantallen | |||||||||||||||
|---|---|---|---|---|---|---|---|---|---|---|---|---|---|---|---|---|
| HVM | HVN | HVW | ||||||||||||||
| 2018 | 16.247 | 29.201 | 58.120 | |||||||||||||
| 2017 | 16.297 | 29.900 | 58.635 | |||||||||||||
| 2016 | 16.247 | 30.012 | 58.639 | |||||||||||||
| 2015 | 16.512 | 30.305 | 60.214 | |||||||||||||
| 2014 | 17.157 | 31.981 | 62.976 | |||||||||||||
| 2013 | 17.691 | 32.802 | 64.168 | |||||||||||||
| 2012 | 18.337 | 33.558 | 65.492 | |||||||||||||
| 2011 | 18.756 | 34.560 | 66.328 | |||||||||||||
| 2010 | 19.039 | 35.249 | 68.475 | |||||||||||||
| 2009 | 19.013 | 35.631 | 68.727 | |||||||||||||
| 2008 | 18.851 | 35.961 | 67.346 | |||||||||||||
| 2007 | 17.778 | 34.780 | 65.605 | |||||||||||||
| 2006 | 18.033 | 35.498 | 66.268 | |||||||||||||
| 2005 | 17.067 | 36.174 | 65.773 | |||||||||||||
| 2004 | 16.816 | 35.281 | 64.915 | |||||||||||||
| 2003 | 16.730 | 35.405 | 65.101 | |||||||||||||
| 2002 | 16.420 | 35.583 | 65.465 | |||||||||||||
| 2001 | 16.682 | 34.474 | 64.922 | |||||||||||||
| 2000 | 16.976 | 35.949 | 65.662 | |||||||||||||
| 1999 | 16.707 | 35.123 | 66.296 | |||||||||||||
| 1998 | 16.903 | 35.446 | 67.472 | |||||||||||||
| 1997 | 17.165 | 35.512 | 67.355 | |||||||||||||
Vrouwen
| Jaar | Ledenaantallen | |||||||||||||||
|---|---|---|---|---|---|---|---|---|---|---|---|---|---|---|---|---|
| HVM | HVN | HVW | ||||||||||||||
| 2018 | 8.133 | 16.017 | 34.332 | |||||||||||||
| 2017 | 8.181 | 16.069 | 34.599 | |||||||||||||
| 2016 | 8.495 | 16.092 | 34.558 | |||||||||||||
| 2015 | 8.535 | 16.152 | 34.887 | |||||||||||||
| 2014 | 8.542 | 16.589 | 36.090 | |||||||||||||
| 2013 | 8.637 | 17.266 | 36.850 | |||||||||||||
| 2012 | 8.924 | 17.555 | 37.636 | |||||||||||||
| 2011 | 8.795 | 18.287 | 38.322 | |||||||||||||
| 2010 | 9.163 | 18.701 | 40.232 | |||||||||||||
| 2009 | 9.358 | 18.779 | 40.215 | |||||||||||||
| 2008 | 9.293 | 19.118 | 39.508 | |||||||||||||
| 2007 | 8.816 | 19.166 | 38.519 | |||||||||||||
| 2006 | 8.982 | 19.231 | 38.338 | |||||||||||||
| 2005 | 8.072 | 19.434 | 37.770 | |||||||||||||
| 2004 | 8.376 | 19.036 | 37.189 | |||||||||||||
| 2003 | 8.346 | 18.753 | 37.290 | |||||||||||||
| 2002 | 8.101 | 18.995 | 37.368 | |||||||||||||
| 2001 | 8.354 | 18.736 | 36.877 | |||||||||||||
| 2000 | 8.388 | 20.082 | 36.149 | |||||||||||||
| 1999 | 7.997 | 19.919 | 35.834 | |||||||||||||
| 1998 | 8.036 | 19.269 | 36.386 | |||||||||||||
| 1997 | 7.971 | 18.427 | 35.539 | |||||||||||||
Verenigingen
| Jaar | Ledenaantallen | |||||||||||||||
|---|---|---|---|---|---|---|---|---|---|---|---|---|---|---|---|---|
| HVM | HVN | HVW | ||||||||||||||
| 2018 | 124 | 245 | 422 | |||||||||||||
| 2017 | 129 | 250 | 425 | |||||||||||||
| 2016 | 129 | 256 | 446 | |||||||||||||
| 2015 | 130 | 256 | 443 | |||||||||||||
| 2014 | 130 | 256 | 450 | |||||||||||||
| 2013 | 131 | 259 | 453 | |||||||||||||
| 2012 | 133 | 261 | 458 | |||||||||||||
| 2011 | 134 | 262 | 463 | |||||||||||||
| 2010 | 134 | 265 | 468 | |||||||||||||
| 2009 | 134 | 268 | 466 | |||||||||||||
| 2008 | 134 | 271 | 473 | |||||||||||||
| 2007 | 132 | 273 | 474 | |||||||||||||
| 2006 | 132 | 272 | 477 | |||||||||||||
| 2005 | 133 | 276 | 477 | |||||||||||||
| 2004 | 130 | 275 | 477 | |||||||||||||
| 2003 | 135 | 274 | 478 | |||||||||||||
| 2002 | 135 | 275 | 482 | |||||||||||||
| 2001 | 137 | 279 | 481 | |||||||||||||
| 2000 | 139 | 283 | 485 | |||||||||||||
| 1999 | 138 | 282 | 487 | |||||||||||||
| 1998 | 143 | 289 | 490 | |||||||||||||
| 1997 | 144 | 291 | 488 | |||||||||||||
|
This article is issued from
Wikipedia.
The text is licensed under Creative
Commons - Attribution - Sharealike.
Additional terms may apply for the media files.