Sunspot
Sunspots are temporary phenomena on the Sun's photosphere that appear as spots darker than the surrounding areas. They are regions of reduced surface temperature caused by concentrations of magnetic field flux that inhibit convection. Sunspots usually appear in pairs of opposite magnetic polarity.[2] Their number varies according to the approximately 11-year solar cycle.
| ||||
| ||||

Individual sunspots or groups of sunspots may last anywhere from a few days to a few months, but eventually decay. Sunspots expand and contract as they move across the surface of the Sun, with diameters ranging from 16 km (10 mi)[3] to 160,000 km (100,000 mi).[4] Larger sunspots can be visible from Earth without the aid of a telescope.[5] They may travel at relative speeds, or proper motions, of a few hundred meters per second when they first emerge.
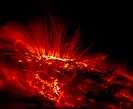
Indicating intense magnetic activity, sunspots accompany secondary phenomena such as coronal loops, prominences, and reconnection events. Most solar flares and coronal mass ejections originate in magnetically active regions around visible sunspot groupings. Similar phenomena indirectly observed on stars other than the Sun are commonly called starspots, and both light and dark spots have been measured.[6]
History
The earliest extant report of sunspots dates back to the Chinese Book of Changes, c. 800 BC.[7] The first clear mention of a sunspot in Western literature, around 300 BC, was by the ancient Greek scholar Theophrastus, student of Plato and Aristotle and successor to the latter.[8] The earliest surviving record of deliberate sunspot observation dates from 364 BC, based on comments by Chinese astronomer Gan De in a star catalogue.[9] By 28 BC, Chinese astronomers were regularly recording sunspot observations in official imperial records.[10] The first drawings of sunspots were made by an English monk named John of Worcester in December 1128.[11] Sunspots were first observed telescopically in late 1610 by English astronomer Thomas Harriot and Frisian astronomers Johannes and David Fabricius, who published a description in June 1611.[12]
Physics
| Heliophysics |
|---|
| Phenomena |
|
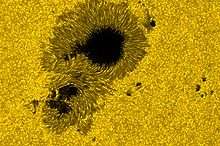
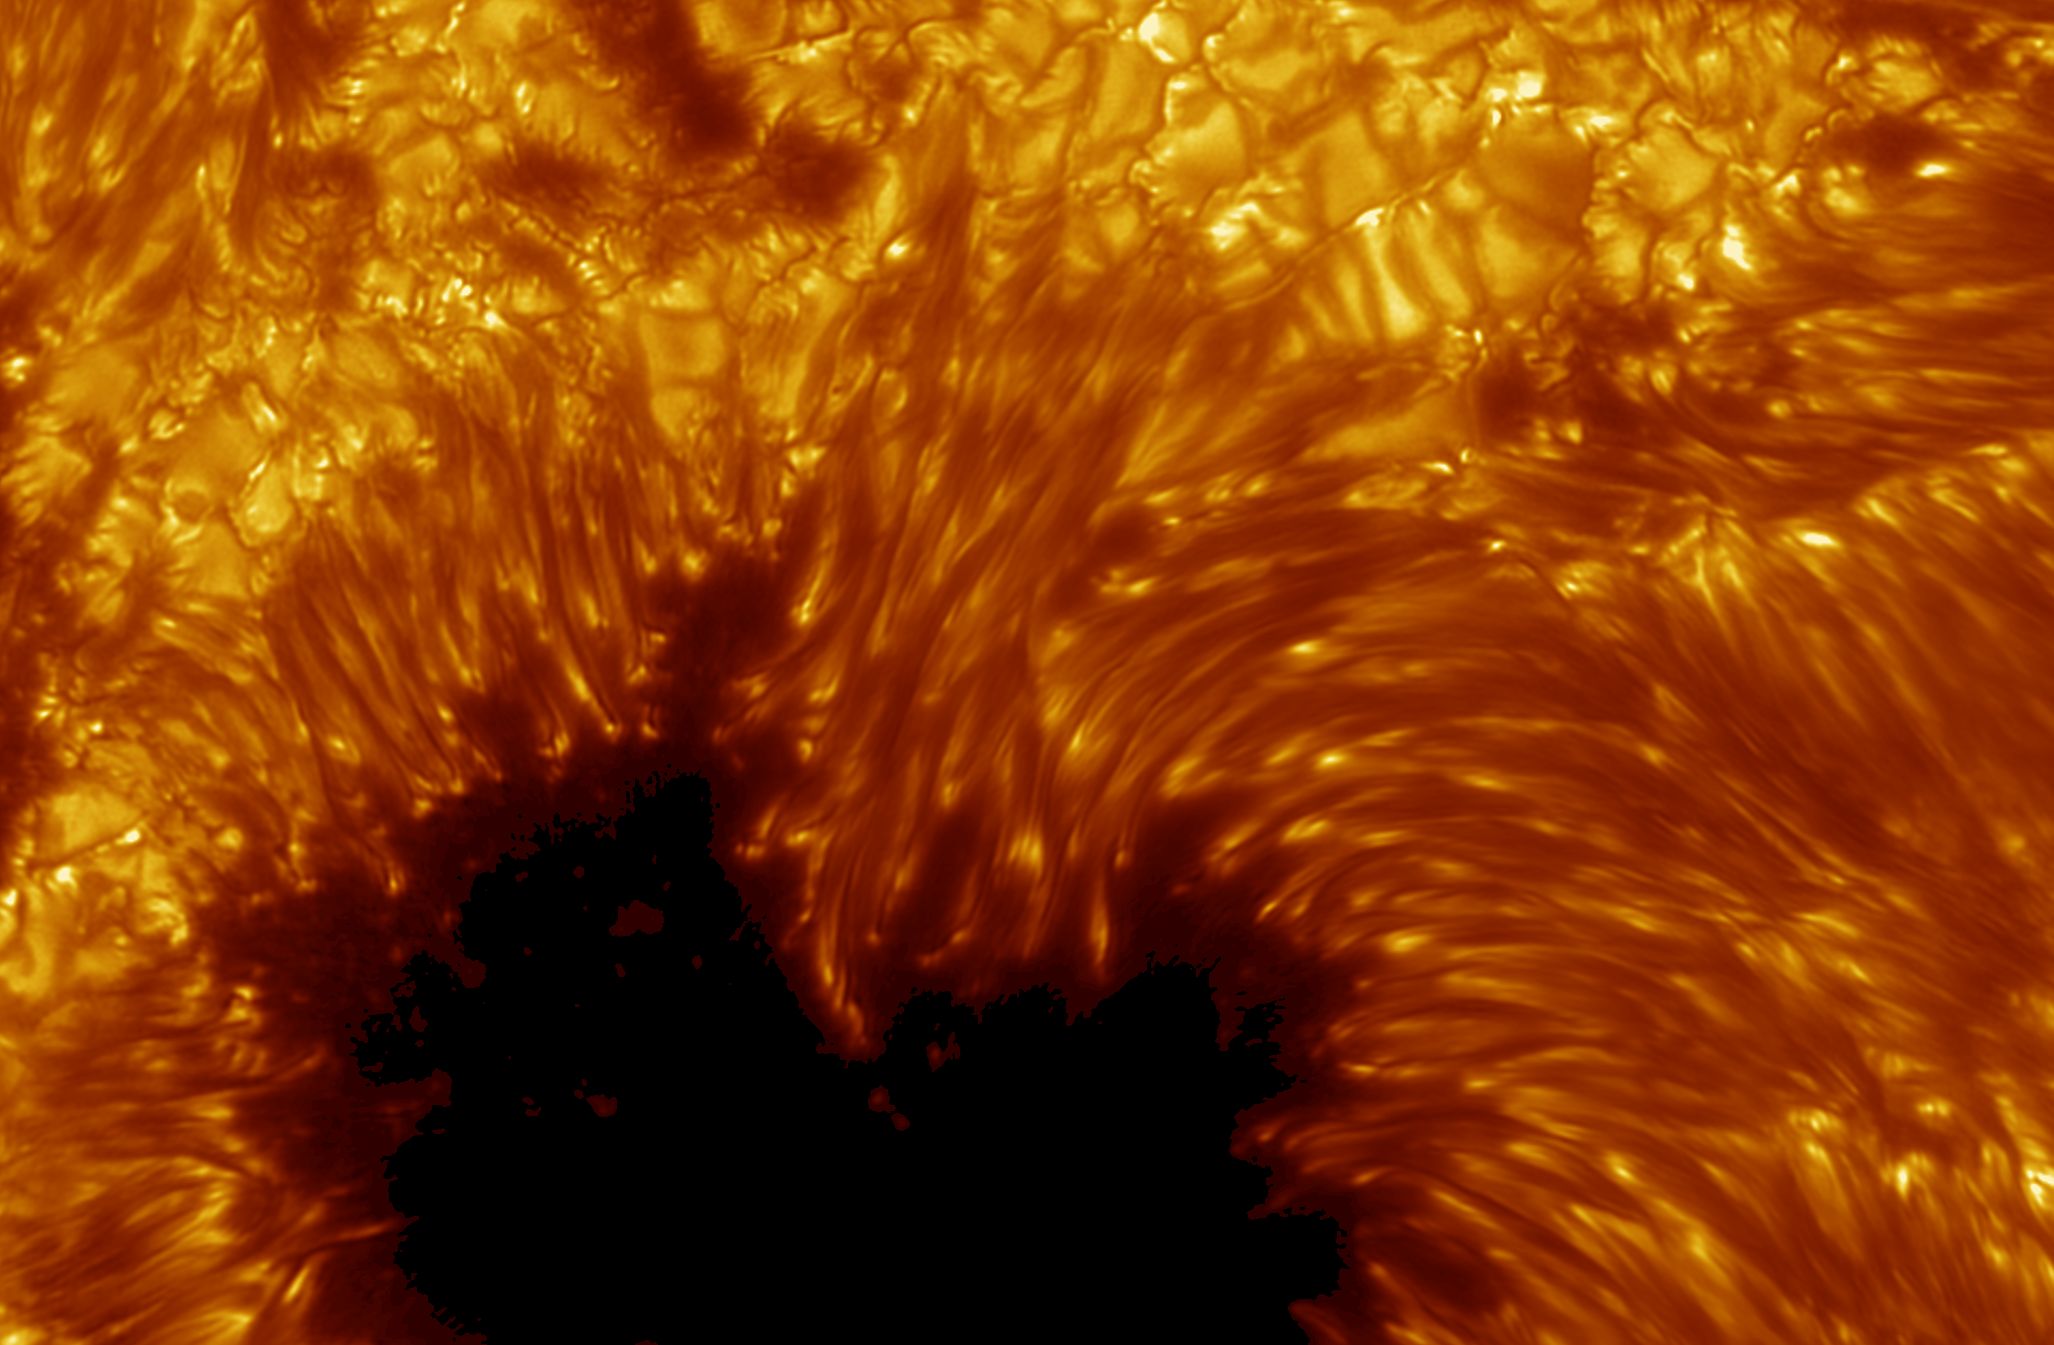
Although they are at temperatures of roughly 3,000–4,500 K (2,700–4,200 °C), the contrast with the surrounding material at about 5,780 K (5,500 °C) leaves sunspots clearly visible as dark spots. This is because the luminance (which is essentially "brightness" in visible light) of a heated black body (closely approximated by the photosphere) at these temperatures varies extremely with temperature—considerably more so than the (temperature to the fourth power) variation in the total black-body radiation at all wavelengths (see Stefan–Boltzmann law). Isolated from the surrounding photosphere a sunspot would be brighter than the Moon.[13]
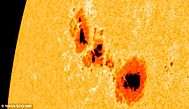
Sunspots have two parts: the central umbra, which is the darkest part, where the magnetic field is approximately vertical (normal to the Sun's surface) and the surrounding penumbra, which is lighter, where the magnetic field is more inclined.
Lifecycle
Any given appearance of a sunspot may last anywhere from a few days to a few months, though groups of sunspots and their active regions tend to last weeks or months, but all do eventually decay and disappear. Sunspots expand and contract as they move across the surface of the Sun, with diameters ranging from 16 km (10 mi) to 160,000 km (100,000 mi).
Although the details of sunspot generation are still a matter of research, it appears that sunspots are the visible counterparts of magnetic flux tubes in the Sun's convective zone that get "wound up" by differential rotation. If the stress on the tubes reaches a certain limit, they curl up and puncture the Sun's surface. Convection is inhibited at the puncture points; the energy flux from the Sun's interior decreases, and with it, surface temperature.
The Wilson effect implies that sunspots are depressions on the Sun's surface. Observations using the Zeeman effect show that prototypical sunspots come in pairs with opposite magnetic polarity. From cycle to cycle, the polarities of leading and trailing (with respect to the solar rotation) sunspots change from north/south to south/north and back. Sunspots usually appear in groups.
Magnetic pressure should tend to remove field concentrations, causing the sunspots to disperse, but sunspot lifetimes are measured in days to weeks. In 2001, observations from the Solar and Heliospheric Observatory (SOHO) using sound waves traveling below the photosphere (local helioseismology) were used to develop a three-dimensional image of the internal structure below sunspots; these observations show that a powerful downdraft underneath each sunspot, forms a rotating vortex that sustains the concentrated magnetic field.[14]
Solar cycle
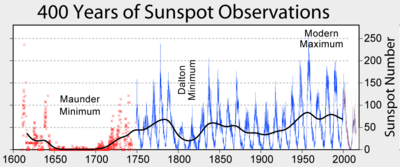
Sunspot activity cycles are about every eleven years, with some variation in length. Over the solar cycle, sunspot populations rise quickly and then fall more slowly. The point of highest sunspot activity during a cycle is known as solar maximum, and the point of lowest activity as solar minimum. This period is also observed in most other solar activity and is linked to a variation in the solar magnetic field that changes polarity with this period.
Early in the cycle, sunspots appear in the higher latitudes and then move towards the equator as the cycle approaches maximum, following Spörer's law. Spots from two adjacent cycles can co-exist for some time. Spots from adjacent cycles can be distinguished by direction of their magnetic field.
The Wolf number sunspot index counts the average number of sunspots and groups of sunspots during specific intervals. The 11-year solar cycles are numbered sequentially, starting with the observations made in the 1750s.[15]
George Ellery Hale first linked magnetic fields and sunspots in 1908.[16] Hale suggested that the sunspot cycle period is 22 years, covering two periods of increased and decreased sunspot numbers, accompanied by polar reversals of the solar magnetic dipole field. Horace W. Babcock later proposed a qualitative model for the dynamics of the solar outer layers. The Babcock Model explains that magnetic fields cause the behavior described by Spörer's law, as well as other effects, which are twisted by the Sun's rotation.
Longer-period trends
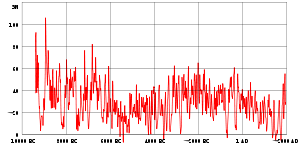
Sunspot number also changes over long periods. For example, from 1900 to the 1960s, the solar maxima trend of sunspot count was upwards; for the following decades it diminished.[17] However, the Sun was last as active as this period over 8,000 years ago.[18]
Sunspots number is correlated with the intensity of solar radiation over the period since 1979, when satellite measurements became available. The variation caused by the sunspot cycle to solar output is on the order of 0.1% of the solar constant (a peak-to-trough range of 1.3 W·m−2 compared with 1366 W·m−2 for the average solar constant).[19][20]
Modern observation
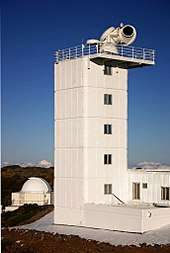
Sunspots are observed with land-based and Earth-orbiting solar telescopes. These telescopes use filtration and projection techniques for direct observation, in addition to various types of filtered cameras. Specialized tools such as spectroscopes and spectrohelioscopes are used to examine sunspots and sunspot areas. Artificial eclipses allow viewing of the circumference of the Sun as sunspots rotate through the horizon.
.jpg)
Since looking directly at the Sun with the naked eye permanently damages human vision, amateur observation of sunspots is generally conducted using projected images, or directly through protective filters. Small sections of very dark filter glass, such as a #14 welder's glass, are effective. A telescope eyepiece can project the image, without filtration, onto a white screen where it can be viewed indirectly, and even traced, to follow sunspot evolution. Special purpose hydrogen-alpha narrow bandpass filters and aluminum-coated glass attenuation filters (which have the appearance of mirrors due to their extremely high optical density) on the front of a telescope provide safe observation through the eyepiece.
Application
Due to its link to other kinds of solar activity, sunspot occurrence can be used to help predict space weather, the state of the ionosphere, and hence the conditions of short-wave radio propagation or satellite communications. High sunspot activity is celebrated by members of the amateur radio community as a harbinger of excellent ionospheric propagation conditions that greatly increase radio range in the HF bands. During sunspot peaks, worldwide radio communication can be possible on frequencies as high as the 6-meter VHF band.[22] Solar activity (and the solar cycle) have been implicated in global warming, originally the role of the Maunder Minimum of sunspot occurrence in the Little Ice Age in European winter climate.[23] Sunspots themselves, in terms of the magnitude of their radiant-energy deficit, have a weak effect on solar flux[24] however the total solar flux increases as "At solar maximum the Sun is some 0.1% brighter than its solar-minimum level". On longer time scales, such as the solar cycle, other magnetic phenomena (faculae and the chromospheric network) correlate with sunspot occurrence.[25]
Starspot
In 1947, G. E. Kron proposed that starspots were the reason for periodic changes in brightness on red dwarfs.[6] Since the mid-1990s, starspot observations have been made using increasingly powerful techniques yielding more and more detail: photometry showed starspot growth and decay and showed cyclic behavior similar to the Sun's; spectroscopy examined the structure of starspot regions by analyzing variations in spectral line splitting due to the Zeeman effect; Doppler imaging showed differential rotation of spots for several stars and distributions different from the Sun's; spectral line analysis measured the temperature range of spots and the stellar surfaces. For example, in 1999, Strassmeier reported the largest cool starspot ever seen rotating the giant K0 star XX Triangulum (HD 12545) with a temperature of 3,500 K (3,230 °C), together with a warm spot of 4,800 K (4,530 °C).[6][26]
Gallery
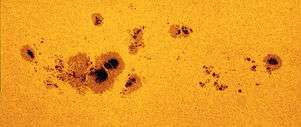
 Sunspots, September 2011.
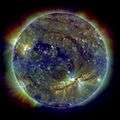 A view of the coronal structure above a different sunspot seen in October 2010.
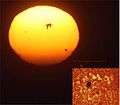 Sunspot 923 at sunset and in solar scope.
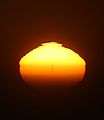 Sunset superior mirage of sunspot #930.
 Sunset in Bangladesh, January 2004.
 Tracking sunspots from Mars (animation; 8 July 2015).
Videos
See also
- Letters on Sunspots
- Joy's Law
- List of solar cycles
- Radio propagation
- Solar cycle
- Solar rotation
- Space weather
- Spörer's law (predictive)
- Starspot
- Wolf number sunspot number
References
- Gentle giant sunspot region 2192
- "Sunspots". NOAA. Retrieved 22 February 2013.
- "How Are Magnetic Fields Related To Sunspots?". NASA. Retrieved 22 February 2013.
- "Sun". HowStuffWorks. Retrieved 22 February 2013.
- harvard.edu
- Strassmeier, K. G. (10 June 1999). "Smallest KPNO Telescope Discovers Biggest Starspots (press release 990610)". University of Vienna. Archived from the original on 24 June 2010. Retrieved 20 February 2008.
starspots vary on the same (short) time scales as Sunspots do ... HD 12545 had a warm spot (350 K above photospheric temperature; the white area in the picture)
- "History of Solar Physics: A Time Line of Great Moments: 1223 BC–250 BC". High Altitude Observatory. University Corporation for Atmospheric Research. Archived from the original on 18 August 2014. Retrieved 15 August 2014.
- "Letter to the Editor: Sunspot observations by Theophrastus revisited"
- "Early Astronomy and the Beginnings of a Mathematical Science". NRICH (University of Cambridge). 2007. Retrieved 14 July 2010.
- "The Observation of Sunspots". UNESCO Courier. 1988. Archived from the original on 2 July 2011. Retrieved 14 July 2010.
- Stephenson, F. R.; Willis, D. M. (1999). "The earliest drawing of sunspots". Astronomy & Geophysics. 40 (6): 6.21–6.22. doi:10.1093/astrog/40.6.6.21. ISSN 1366-8781.
- "Great Moments in the History of Solar Physics 1". Great Moments in the History of Solar Physics. Archived from the original on 1 March 2006. Retrieved 19 March 2006.
- "Sunspots". NASA. 1 April 1998. Retrieved 22 February 2013.
- NASA News Release (6 November 2001). "SOHO reveals how sunspots take stranglehold on the Sun". SpaceFlight Now.
- Tribble, A. (2003). The Space Environment, Implications for Spacecraft Design. Princeton University Press. pp. 15–18.
- Hale, G. E. (1908). "On the Probable Existence of a Magnetic Field in Sun-Spots". The Astrophysical Journal. 28: 315. Bibcode:1908ApJ....28..315H. doi:10.1086/141602.
- "Sunspot index graphics". Solar Influences Data Analysis Center. Retrieved 27 September 2007.
- Solanki SK; Usoskin IG; Kromer B; Schüssler M; et al. (October 2004). "Unusual activity of the Sun during recent decades compared to the previous 11,000 years". Nature. 431 (7012): 1084–1087. Bibcode:2004Natur.431.1084S. doi:10.1038/nature02995. PMID 15510145.
- "Solar Forcing of Climate". Climate Change 2001: Working Group I: The Scientific Basis. Archived from the original on 15 March 2005. Retrieved 10 March 2005.
- Weart, Spencer (2006). Weart, Spencer (ed.). "The Discovery of Global Warming—Changing Sun, Changing Climate?". American Institute of Physics. Retrieved 14 April 2007.
- "ALMA Starts Observing the Sun". www.eso.org. Retrieved 23 January 2017.
- Stu Turner. "Sunspots and Propagation". Ham Radio School.com. Archived from the original on 26 June 2017. Retrieved 5 January 2020.
- Eddy J.A. (June 1976). "The Maunder Minimum". Science. 192 (4245): 1189–1202. Bibcode:1976Sci...192.1189E. doi:10.1126/science.192.4245.1189. PMID 17771739. PDF Copy Archived 16 February 2010 at the Wayback Machine
- Hudson H (2008). "Solar activity". Scholarpedia. Retrieved 27 January 2011.
- Willson, R. C.; Gulkis, S.; Janssen, M.; Hudson, H. S.; Chapman, G. A. (1981). "Observations of solar irradiance variability". Science. 211 (4483): 700–2. Bibcode:1981Sci...211..700W. doi:10.1126/science.211.4483.700. PMID 17776650.
- "Derived images showing rotation of cool and warm starspots". Leibniz Institute for Astrophysics. Archived from the original on 29 May 2010. Retrieved 14 January 2013.
- Puschmann, K. G.; Kneer, F.; Nicklas, H.; Wittmann, A. D. (2007). "From the "Göttingen" Fabry-Perot Interferometer to the GREGOR FPI". Modern Solar Facilities - Advanced Solar Science: 45. Bibcode:2007msfa.conf...45P.
- Sánchez-Andrade Nuño, B.; Puschmann, K. G.; Kneer, F. (2007). "Observations of a flaring active region in H[alpha]". Modern Solar Facilities - Advanced Solar Science: 273. Bibcode:2007msfa.conf..273S.
Further reading
External links
| Wikimedia Commons has media related to Sunspots. |
- Sunspot Database based on Terrestrial (GPR/DPD) and Satellite (SOHO/SDO) observations from 1872 to Nowadays with the newest data. (

- Solar Cycle 24 and VHF Aurora Website (www.solarcycle24.com)
- Belgium World Data Center for the sunspot index
- High resolution sunspot image
- Sunspot images in high-res Impressive collection of sunspot images
- NOAA Solar Cycle Progression: Current solar cycle.
- Current conditions: Space weather
- Lockheed Martin Solar and Astrophysics Lab
- Sun|trek website An educational resource for teachers and students about the Sun and its effect on the Earth
- Tools to display the current sunspot number in a browser
- The Sharpest View of the Sun
- Daily Sunspot Update and Picture of the Sun (www.spaceweather.com)
- Animated explanation of Sunspots in the Photosphere (University of South Wales)
Sunspot data
- "11,000 Year Sunspot Number Reconstruction". Global Change Master Directory. Retrieved 11 March 2005.
- "Unusual activity of the Sun during recent decades compared with the previous 11,000 years". WDC for Paleoclimatology. Retrieved 11 March 2005.
- "Sunspot Numbers from Ancient Times to Present from NOAA/NGDC". Global Change Master Directory. Retrieved 11 March 2005.
- "SUNSPOT NUMBERS". NOAA NGDC Solar Data Services. Retrieved 21 June 2010.
- International Sunspot Number—sunspot maximum and minimum 1610–present; annual numbers 1700–present; monthly numbers 1749–present; daily values 1818–present; and sunspot numbers by north and south hemisphere. The McNish–Lincoln sunspot prediction is also included.
- American sunspot numbers 1945–present
- Ancient sunspot data 165 BC to 1684 AD
- Group Sunspot Numbers (Doug Hoyt re-evaluation) 1610–1995
- "SUNSPOT NUMBERS". NOAA NGDC Solar Data Services. Retrieved 21 June 2010.
- Wilson, Robert M. (April 2014). Comparison of the Variations of Sunspot Number, Number of Sunspot Groups, and Sunspot Area, 1875-2013. Huntsville, AL: National Aeronautics and Space Administration, Marshall Space Flight Center. Retrieved 13 March 2015.
| Internal structure |
|  | |||||
|---|---|---|---|---|---|---|---|
| Atmosphere |
| ||||||
| Variation |
| ||||||
| Heliosphere |
| ||||||
| Related |
| ||||||
| |||||||