Sea level
Mean sea level (MSL) (often shortened to sea level) is an average level of the surface of one or more of Earth's bodies of water from which heights such as elevation may be measured. The global MSL is a type of vertical datum – a standardised geodetic datum – that is used, for example, as a chart datum in cartography and marine navigation, or, in aviation, as the standard sea level at which atmospheric pressure is measured to calibrate altitude and, consequently, aircraft flight levels. A common and relatively straightforward mean sea-level standard is instead the midpoint between a mean low and mean high tide at a particular location.[1]
Sea levels can be affected by many factors and are known to have varied greatly over geological time scales. However, 20th century and current millennium sea level rise is presumed to be caused by global warming,[2] and careful measurement of variations in MSL can offer insights into ongoing climate change.[3]
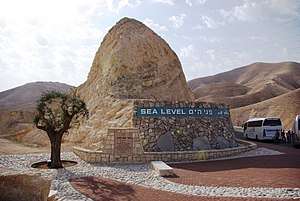
The term above sea level generally refers to above mean sea level (AMSL). The term APSL means Above Present Sea Level, comparing sea levels in the past with the level today.
Measurement
Precise determination of a "mean sea level" is difficult to achieve because of the many factors that affect sea level.[4] Instantaneous sea level varies quite a lot on several scales of time and space. This is because the sea is in constant motion, affected by the tides, wind, atmospheric pressure, local gravitational differences, temperature, salinity and so forth. The easiest way this may be calculated is by selecting a location and calculating the mean sea level at that point and use it as a datum. For example, a period of 19 years of hourly level observations may be averaged and used to determine the mean sea level at some measurement point.
Still-water level or still-water sea level (SWL) is the level of the sea with motions such as wind waves averaged out.[5] Then MSL implies the SWL further averaged over a period of time such that changes due to, e.g., the tides, also have zero mean. Global MSL refers to a spatial average over the entire ocean.
One often measures the values of MSL in respect to the land; hence a change in relative MSL can result from a real change in sea level, or from a change in the height of the land on which the tide gauge operates. In the UK, the Ordnance Datum (the 0 metres height on UK maps) is the mean sea level measured at Newlyn in Cornwall between 1915 and 1921. Before 1921, the vertical datum was MSL at the Victoria Dock, Liverpool. Since the times of the Russian Empire, in Russia and its other former parts, now independent states, the sea level is measured from the zero level of Kronstadt Sea-Gauge. In Hong Kong, "mPD" is a surveying term meaning "metres above Principal Datum" and refers to height of 1.230m below the average sea level. In France, the Marégraphe in Marseilles measures continuously the sea level since 1883 and offers the longest collated data about the sea level. It is used for a part of continental Europe and the main part of Africa as the official sea level. As for Spain, the reference to measure heights below or above sea level is placed in Alicante. Elsewhere in Europe vertical elevation references (European Vertical Reference System) are made to the Amsterdam Peil elevation, which dates back to the 1690s.
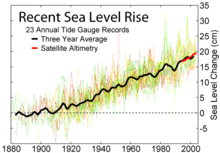
Satellite altimeters have been making precise measurements of sea level[6] since the launch of TOPEX/Poseidon in 1992. A joint mission of NASA and CNES, TOPEX/Poseidon was followed by Jason-1 in 2001 and the Ocean Surface Topography Mission on the Jason-2 satellite in 2008.
Height above mean sea level
Height above mean sea level (AMSL) is the elevation (on the ground) or altitude (in the air) of an object, relative to the average sea level datum. It is also used in aviation, where some heights are recorded and reported with respect to mean sea level (MSL) (contrast with flight level), and in the atmospheric sciences, and land surveying. An alternative is to base height measurements on an ellipsoid of the entire Earth, which is what systems such as GPS do. In aviation, the ellipsoid known as World Geodetic System 84 is increasingly used to define heights; however, differences up to 100 metres (328 feet) exist between this ellipsoid height and mean tidal height. The alternative is to use a geoid-based vertical datum such as NAVD88 and the global EGM96 (part of WGS84).
When referring to geographic features such as mountains on a topographic map, variations in elevation are shown by contour lines. The elevation of a mountain denotes the highest point or summit and is typically illustrated as a small circle on a topographic map with the AMSL height shown in metres, feet or both.
In the rare case that a location is below sea level, the elevation AMSL is negative. For one such case, see Amsterdam Airport Schiphol.
Difficulties in use
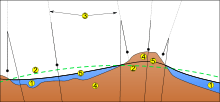
To extend this definition far from the sea means comparing the local height of the mean sea surface with a "level" reference surface, or geodetic datum, called the geoid. In a state of rest or absence of external forces, the mean sea level would coincide with this geoid surface, being an equipotential surface of the Earth's gravitational field which, in itself, does not conform to a simple sphere or ellipsoid and exhibits measurable variations such as those measured by NASA's | GRACE satellites to determine mass changes in ice-sheets and aquifers. In reality, this ideal does not occur due to ocean currents, air pressure variations, temperature and salinity variations, etc., not even as a long-term average. The location-dependent, but persistent in time, separation between mean sea level and the geoid is referred to as (mean) ocean surface topography. It varies globally in a range of ± 2 m.
Historically, adjustments were made to sea-level measurements to take into account the effects of the 235 lunar month Metonic cycle and the 223-month eclipse cycle on the tides.[7]
Dry land
Several terms are used to describe the changing relationships between sea level and dry land. When the term "relative" is used, it means change relative to a fixed point in the sediment pile. The term "eustatic" refers to global changes in sea level relative to a fixed point, such as the centre of the earth, for example as a result of melting ice-caps. The term "steric" refers to global changes in sea level due to thermal expansion and salinity variations. The term "isostatic" refers to changes in the level of the land relative to a fixed point in the earth, possibly due to thermal buoyancy or tectonic effects; it implies no change in the volume of water in the oceans. The melting of glaciers at the end of ice ages is one example of eustatic sea level rise. The subsidence of land due to the withdrawal of groundwater is an isostatic cause of relative sea level rise. Paleoclimatologists can track sea level by examining the rocks deposited along coasts that are very tectonically stable, like the east coast of North America. Areas like volcanic islands are experiencing relative sea level rise as a result of isostatic cooling of the rock which causes the land to sink.
On other planets that lack a liquid ocean, planetologists can calculate a "mean altitude" by averaging the heights of all points on the surface. This altitude, sometimes referred to as a "sea level" or zero-level elevation, serves equivalently as a reference for the height of planetary features.
Change
Local and eustatic
Local mean sea level (LMSL) is defined as the height of the sea with respect to a land benchmark, averaged over a period of time (such as a month or a year) long enough that fluctuations caused by waves and tides are smoothed out. One must adjust perceived changes in LMSL to account for vertical movements of the land, which can be of the same order (mm/yr) as sea level changes. Some land movements occur because of isostatic adjustment of the mantle to the melting of ice sheets at the end of the last ice age. The weight of the ice sheet depresses the underlying land, and when the ice melts away the land slowly rebounds. Changes in ground-based ice volume also affect local and regional sea levels by the readjustment of the geoid and true polar wander. Atmospheric pressure, ocean currents and local ocean temperature changes can affect LMSL as well.
Eustatic sea level change (as opposed to local change) results in an alteration to the global sea levels due to changes in either the volume of water in the world's oceans or net changes in the volume of the ocean basins.[8]
Short-term and periodic changes
.jpg)
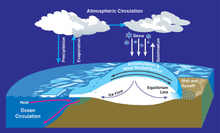
There are many factors which can produce short-term (a few minutes to 14 months) changes in sea level. Two major mechanisms are causing sea level to rise. First, shrinking land ice, such as mountain glaciers and polar ice sheets, is releasing water into the oceans. Second, as ocean temperatures rise, the warmer water expands.[9]
| Periodic sea level changes | ||
|---|---|---|
| Diurnal and semidiurnal astronomical tides | 12–24 h P | 0.2–10+ m |
| Long-period tides | ||
| Rotational variations (Chandler wobble) | 14-month P | |
| Meteorological and oceanographic fluctuations | ||
| Atmospheric pressure | Hours to months | −0.7 to 1.3 m |
| Winds (storm surges) | 1–5 days | Up to 5 m |
| Evaporation and precipitation (may also follow long-term pattern) | Days to weeks | |
| Ocean surface topography (changes in water density and currents) | Days to weeks | Up to 1 m |
| El Niño/southern oscillation | 6 mo every 5–10 yr | Up to 0.6 m |
| Seasonal variations | ||
| Seasonal water balance among oceans (Atlantic, Pacific, Indian) | ||
| Seasonal variations in slope of water surface | ||
| River runoff/floods | 2 months | 1 m |
| Seasonal water density changes (temperature and salinity) | 6 months | 0.2 m |
| Seiches | ||
| Seiches (standing waves) | Minutes to hours | Up to 2 m |
| Earthquakes | ||
| Tsunamis (generate catastrophic long-period waves) | Hours | Up to 10 m |
| Abrupt change in land level | Minutes | Up to 10 m |
Recent changes
For at least the last 100 years, sea level has been rising at an average rate of about 1.8 mm (0.07 in) per year.[10] Most of this rise can be attributed to the increase in temperature of the sea and the resulting slight thermal expansion of the upper 500 metres (1,640 feet) of sea water. Additional contributions, as much as one-quarter of the total, come from water sources on land, such as melting snow and glaciers and extraction of groundwater for irrigation and other agricultural and human uses.[11]
Aviation
Pilots can estimate height above sea level with an altimeter set to a defined barometric pressure. Generally, the pressure used to set the altimeter is the barometric pressure that would exist at MSL in the region being flown over. This pressure is referred to as either QNH or "altimeter" and is transmitted to the pilot by radio from air traffic control (ATC) or an automatic terminal information service (ATIS). Since the terrain elevation is also referenced to MSL, the pilot can estimate height above ground by subtracting the terrain altitude from the altimeter reading. Aviation charts are divided into boxes and the maximum terrain altitude from MSL in each box is clearly indicated. Once above the transition altitude, the altimeter is set to the international standard atmosphere (ISA) pressure at MSL which is 1013.25 hPa or 29.92 inHg.[12]
See also
- Above ground level
- Before Present – Calendar based on 1950 CE (around when radiocarbon dating was developed and nuclear weapons testing artificially altered the proportion of carbon isotopes)
- Chart datum – The level of water from which depths displayed on a nautical chart are measured
- Extreme points of Earth – List of geographical locations that extend farther in one direction than any other location
- Geopotential height
- Height above average terrain – Height based on large area surrounding object; often used in U.S. for antenna towers
- List of places on land with elevations below sea level – Wikipedia list article
- Raised beach, also known as Marine terrace – A beach or wave-cut platform raised above the shoreline by a relative fall in the sea level
- Meltwater pulse 1A – A period of rapid post-glacial sea level rise
- Metres above the Adriatic
- Amsterdam Ordnance Datum, also known as Normaal Amsterdams Peil – vertical datum in use in large parts of Western Europe, originally created for use in the Netherlands
- Normal height
- Normalhöhennull
- Normalnull
- North West Shelf Operational Oceanographic System – Facility that monitors physical, sedimentological and ecological variables for the North Sea area
- Ordnance datum – Vertical datum used as the basis for deriving altitudes on maps (UK and Ireland)
- Orthometric height
- Sea level equation
- Vertical datum – Reference surface for vertical positions
- World Geodetic System – Geodetic reference system
References
- What is "Mean Sea Level"? (Proudman Oceanographic Laboratory).
- USGCRP (2017). "Climate Science Special Report. Chapter 12: Sea Level Rise. Key finding 2". science2017.globalchange.gov. Retrieved 27 December 2018.
- "The strange science of melting ice sheets: three things you didn't know". The Guardian. 12 September 2018.
- US National Research Council, Bulletin of the National Research Council 1932 page 270
- "Still-water level - AMS Glossary". glossary.ametsoc.org.
- Glazman, Roman E; Greysukh, Alexander; Zlotnicki, Victor (1994). "Evaluating models of sea state bias in satellite altimetry". Journal of Geophysical Research. 99 (C6): 12581. Bibcode:1994JGR....9912581G. doi:10.1029/94JC00478.Roman Glazman Greysukh, A. M., Zlotnicki, V.
- "Stonehenge pt 3". www.celticnz.co.nz. Retrieved 18 February 2017.
- "Eustatic sea level". Oilfield Glossary. Schlumberger Limited. Retrieved 10 June 2011.
- "Global Warming Effects on Sea Level". www.climatehotmap.org. Retrieved 2 December 2016.
- Bruce C. Douglas (1997). "Global Sea Rise: A Redetermination". Surveys in Geophysics. 18 (2/3): 279–292. Bibcode:1997SGeo...18..279D. doi:10.1023/A:1006544227856.
- Bindoff, N.L.; Willebrand, J.; Artale, V.; Cazenave, A.; Gregory, J.; Gulev, S.; Hanawa, K.; Le Quéré, C.; Levitus, S.; Nojiri, Y.; Shum, C.K.; Talley, L.D.; Unnikrishnan, A. (2007). "Observations: Oceanic Climate Change and Sea Level" (PDF). In Solomon, S.; Qin, D.; Manning, M.; Chen, Z.; Marquis, M.; Averyt, K.B.; Tignor, M.; Miller, H.L. (eds.). Climate Change 2007: The Physical Science Basis. Contribution of Working Group I to the Fourth Assessment Report of the Intergovernmental Panel on Climate Change. Cambridge University Press.
- US Federal Aviation Administration, Code of Federal Regulations Sec. 91.121
External links
| The Wikibook Historical Geology has a page on the topic of: Sea level variations |
| Wikimedia Commons has media related to Sea level. |
- Sea Level Rise:Understanding the past – Improving projections for the future
- Permanent Service for Mean Sea Level
- Global sea level change: Determination and interpretation
- Environment Protection Agency Sea level rise reports
- Properties of isostasy and eustasy
- Measuring Sea Level from Space
- Rising Tide Video: Scripps Institution of Oceanography
- Sea Levels Online: National Ocean Service (CO-OPS)
- Système d'Observation du Niveau des Eaux Littorales (SONEL)
- Sea level rise – How much and how fast will sea level rise over the coming centuries?
Physical oceanography | ||
|---|---|---|
| Waves |
|   |
| Circulation |
| |
| Tides |
| |
| Landforms |
| |
| Plate tectonics |
| |
| Ocean zones | ||
| Sea level |
| |
| Acoustics |
| |
| Satellites |
| |
| Related |
| |
| ||