NCAA Division I Men's Basketball Tournament
The NCAA Division I Men's Basketball Tournament, also known and branded as NCAA March Madness, is a single-elimination tournament played each spring in the United States, currently featuring 68 college basketball teams from the Division I level of the National Collegiate Athletic Association (NCAA), to determine the national championship. The tournament was created in 1939 by the National Association of Basketball Coaches, and was the idea of Ohio State coach Harold Olsen.[1] Played mostly during March, it has become one of the most famous annual sporting events in the United States.
| Upcoming season or competition: | |
| Sport | Basketball |
|---|---|
| Founded | 1939 |
| No. of teams | 68 |
| Most recent champion(s) | Virginia (1st title) |
| Most titles | UCLA (11 titles) |
| TV partner(s) | NCAA March Madness (CBS/TBS/TNT/TruTV) CBS Sports Network (re-airs) Galavision (Spanish-coverage) |
| Official website | NCAA.com |
It has become extremely common in popular culture to predict the outcomes of each game, even among non-sports fans; it is estimated that tens of millions of Americans participate in a bracket pool contest every year. Mainstream media outlets such as ESPN, CBS Sports and Fox Sports host tournaments online where contestants can enter for free. Also, there are many sites that cater to corporate marketing and public relations to get in on the excitement such as BigTourney.com[2]. Employers have also noticed a change in the behavior of employees during this time: they have seen an increase in the number of sick days used, extended lunch breaks and even the rescheduling of conference calls to allow for more tournament watching.[3] There are also many handicappers and pundits which offer advice for winning their own bracket.[4][5]
The tournament teams include champions from 32 Division I conferences (which receive automatic bids), and 36 teams which are awarded at-large berths. These "at-large" teams are chosen by an NCAA selection committee, then announced in a nationally televised event on the Sunday preceding the "First Four" play-in games, currently held in Dayton, Ohio, and dubbed Selection Sunday. The 68 teams are divided into four regions and organized into a single-elimination "bracket", which pre-determines, when a team wins a game, which team it will face next. Each team is "seeded", or ranked, within its region from 1 to 16. After the First Four, the tournament occurs during the course of three weekends, at pre-selected neutral sites across the United States. Teams, seeded by rank, proceed through a single-game elimination bracket beginning with a "first four" consisting of 8 low-seeded teams playing in 4 games for a position in the first round the Tuesday and Wednesday before the first round begins, a first round consisting of 64 teams playing in 32 games over the course of a week, the "Sweet Sixteen" and "Elite Eight" rounds the next week and weekend, respectively, and – for the last weekend of the tournament – the "Final Four" round. The Final Four is usually played during the first weekend of April. These four teams, one from each region (East, South, Midwest, and West), compete in a preselected location for the national championship.
The tournament has been at least partially televised on network television since 1969.[6] Currently, the games are broadcast by CBS, TBS, TNT, and truTV under the trade-name NCAA March Madness. These networks paid the NCAA to broadcast the games in 2011. The contract was for 14 years and they paid $10,800 million. However, in 2018 that contract was extended for another seven years making it valid through the year 2032. The average payment over the years comes out to be $891 million annually.[7] Since 2011, all games are available for viewing nationwide and internationally. As television coverage has grown, so too has the tournament's popularity. Currently, millions of Americans fill out a bracket,[8] attempting to correctly predict the outcome of 63 games of the tournament (not including the First Four games).
With 11 national titles, UCLA has the record for the most NCAA Men's Division I Basketball Championships; John Wooden coached UCLA to 10 of its 11 titles. The University of Kentucky (UK) is second, with eight national titles. The University of North Carolina is third, with six national titles, and Duke University and Indiana University are tied for fourth with five national titles. The University of Connecticut is sixth with four national titles. The University of Kansas (KU) & Villanova University are tied for seventh with three national titles. The University of Cincinnati, the University of Florida, Michigan State University, North Carolina State, Oklahoma State, and the University of San Francisco all have two national titles. The tournament expanded to 64 teams in 1988, and to 68 in 2011.
The 2020 tournament was cancelled due to ongoing concerns about the coronavirus pandemic.[9]
Current tournament format
.jpg)
The NCAA has changed the tournament format several times since its inception, most often being an increase of the number of teams. This section describes the tournament as it has operated since 2011.
Qualifying
A total of 68 teams qualify for the tournament played during March and April. Thirty-two teams earn automatic bids as their respective conference champions. Of the 32 Division I "all-sports" conferences (defined as those that sponsor men's and women's basketball), all 32 currently hold championship tournaments to determine which team receives the automatic qualification. The Ivy League was the last Division I conference that did not conduct a tournament; through the 2015–16 season, it awarded its tournament berth to the regular-season champion. If two or more Ivies shared a regular-season championship, a one-game playoff (or series of such playoffs) was used to decide the tournament participant. Since 2017, the league conducts their own postseason tournament.[10]
The remaining 36 tournament slots are granted to at-large bids, which are determined by the Selection Committee in a nationally televised event on the Sunday preceding the First Four play-in tournament and dubbed Selection Sunday by the media and fans, by a group primarily of conference commissioners and school athletic directors who are appointed into service by the NCAA. The committee also determines where all sixty-eight teams are seeded and placed in the bracket.
Regions
The tournament is divided into four regions and each region has at least sixteen teams, but four additional teams are added per the decision of the Selection Committee. (See: First Four, below.) The committee is charged with making each of the four regions as close as possible in overall quality of teams from wherever they come from.
The names of the regions vary from year to year, and are broadly geographic (such as "East", "South", "Midwest" & "West"). From 1957 to 1984, the "Mideast", roughly corresponding to the Southeastern region of the United States, designation was used. From 1985 to 1997, the Mideast region was known as "Southeast" and again changed to "South" starting from 1998. The selected names roughly correspond to the location of the four cities hosting the regional finals. From 2004 to 2006, the regions were named after their host cities, e.g. the Phoenix Regional in 2004, the Chicago Regional in 2005, and the Minneapolis Regional in 2006, but reverted to the traditional geographic designations beginning in 2007. For example, during 2012, the regions were named South (Atlanta, Georgia), East (Boston, Massachusetts), Midwest (St. Louis, Missouri), and West (Phoenix, Arizona).[11]
Seeding and bracket
The selection committee ranks the whole field of 68 teams from 1 to 68. (It did not make this information public until 2012.) The committee then divides the teams amongst the regions. The top four teams will be distributed among the four regions, and each will receive a No. 1 seed within that region. The next four ranked teams will then be distributed among the four regions, each receiving a No. 2 seed in their region, and the process continues down the line, with some exceptions (as is explained below). Carried to its logical conclusion, this would give each region seventeen teams—seeded from No. 1 to No. 17—but, each region has only sixteen teams (from No. 1 to No. 16). As can be seen below, the actual seeding depends on (among other factors) the rankings of the eight teams that the committee selects for the "First Four" opening round (see the next paragraph and the "First Four" section below).
The selection committee is also instructed to place teams so that whenever possible, teams from the same conference cannot meet until the regional finals. Additionally, it is also instructed to avoid any possible rematches of regular-season or previous year's tournament games during the First and Second rounds.[12] Further restrictions are listed in the Venues section below. To comply with these other requirements, the selection committee may move one or several teams up or down one seed from their respective original seed line.[12] Thus, for example, the 40th overall ranked team, originally slated to be a No. 10 seed within a particular region, may instead be moved up to a No. 9 seed or moved down to a No. 11 seed. In addition, the rankings of the eight teams selected for the "First Four" play-in round will likewise affect the final seedlings.
The bracket is thus established, and during the semifinals, the champion of the top-ranked number 1 seed's region will play against the champion of the fourth-ranked number 1 seed's region, and the champion of the second-ranked number 1 seed's region will play against the champion of the third-ranked number 1 seed's region.[12]
Venues
In the men's tournament, all sites are nominally neutral; teams are prohibited from playing tournament games on their home courts prior to the Final Four (though in some cases, a team may be fortunate enough to play in or near its home state or city). By current NCAA rules, any court on which a team hosts more than three regular-season games (in other words, not including conference tournament games) is considered a "home court".[13] The exception to this rule is the University of Dayton, which would be allowed to play a game in the "First Four" round in their home arena[14] as they did in 2015.
However, while a team can be moved to a different region if its home court is being used during any of the first two weeks of the tournament, the Final Four venue is determined years in advance, and cannot be changed regardless of participants. For this reason a team could potentially play in a Final Four on its home court, though this is unlikely, since the Final Four is staged at venues larger than most college basketball arenas. (The most recent team to play the Final Four in its home city was Butler during 2010; its home court then seated only 10,000, as opposed to the 70,000-plus capacity of Lucas Oil Stadium, the Final Four venue.)
Rounds
The tournament consists of several rounds. They are currently named, in order of first to last:
- The First Four
- The First Round (the Round of 64)
- The Second Round (the Round of 32)
- The Regional Semi-finals (participating teams are known popularly as the "Sweet Sixteen")
- The Regional Finals (participating teams are known commonly as the "Elite Eight")
- The National Semi-finals (participating teams are referred to officially as the "Final Four")
- The National Championship
The tournament is single-elimination, which increases the chance of an underdog and lower-seeded "Cinderella team" advancing to subsequent rounds. Although these lower-ranked teams are forced to play stronger teams, they need only one win to advance (instead of needing to win a majority of games in a series, as in professional basketball).
First Four
First held during 2011, the First Four are games between the four lowest-ranked at-large teams and the four lowest-ranked automatic-bid (conference-champion) teams.
- First Four At-large seeds
- Note: Each year, the four lowest-ranked automatic-bid teams compete to receive No. 16 seeds, while the four lowest-ranked at-large teams compete for to be No. 11 seeds. From 2011 through 2014, the at-large teams competed in the First-Four games for a No. 11, 12, 13, or 14 seed in one of the regions. The table below shows the years in which each of those four seeds were claimed by one of the two at-large winners.
| Seed | Count | Years |
|---|---|---|
| 11 | 3 | 2011, 2013, 2014 |
| 12 | 3 | 2011, 2012, 2014 |
| 13 | 1 | 2013 |
| 14 | 1 | 2012 |
First and Second Rounds
During the First Round (the Round of 64), the No. 1 seed plays the No. 16 seed in all regions; the No. 2 team plays the No. 15, and so on. The effect of this seeding structure ensures that the better a team is ranked (and therefore seeded), the worse-ranked (and presumably weaker) their opponents will be. Sixteen first-round games are played on the Thursday following the "First Four" round. The remaining sixteen first-round games are played Friday. At this point the contestants are reduced to 32 teams.
The Second Round (the Round of 32) is played on Saturday and Sunday immediately after the first round. The second round consists of Thursday's winners playing in eight games on Saturday, followed by Friday's winners playing in the remaining eight second-round games on Sunday. Thus, after the first weekend, 16 teams remain, commonly known as the "Sweet Sixteen."
Regional semifinals and finals
The teams that are still competing after the first weekend advance to the regional semifinals (the Sweet Sixteen) and finals (the Elite Eight), which are played during the second weekend of the tournament (again, the games are split into Thursday/Saturday and Friday/Sunday). Unlike hockey, teams are not re-seeded where the number one seed in each conference would play the lowest ranked. Four regional semi-final games are played Thursday and four are played Friday. After Friday's games, 8 teams (the Elite Eight) remain. Saturday features two regional final games matching Thursday's winners and Sunday's two final games match Friday's winners. After the second weekend of the tournament, the four regional champions are the "Final Four."
Final Four
The winners of each region advance to the Final Four, where the national semifinals are played on Saturday and the national championship is played on Monday. As is noted above, which regional champion will play which, and in which semifinal they play, is determined by the overall rankings of the four No. 1 seeds in the original bracket, not on the ranks of the eventual Final Four teams themselves.
Winners
Titles by year
Titles by school
Carolina
Cross
- The following is a list of all schools that have won at least one NCAA Men's Basketball Tournament, along with the year(s) in which they won their championship(s).
| School | Titles | Years |
|---|---|---|
| UCLA | 11 | 1964, 1965, 1967, 1968, 1969, 1970, 1971, 1972, 1973, 1975, 1995 |
| Kentucky | 8 | 1948, 1949, 1951, 1958, 1978, 1996, 1998, 2012 |
| North Carolina | 6 | 1957, 1982, 1993, 2005, 2009, 2017 |
| Duke | 5 | 1991, 1992, 2001, 2010, 2015 |
| Indiana | 5 | 1940, 1953, 1976, 1981, 1987 |
| UConn | 4 | 1999, 2004, 2011, 2014 |
| Kansas | 3 | 1952, 1988, 2008 |
| Villanova | 3 | 1985, 2016, 2018 |
| Cincinnati | 2 | 1961, 1962 |
| Florida | 2 | 2006, 2007 |
| Louisville | 2* | 1980, 1986 |
| Michigan State | 2 | 1979, 2000 |
| NC State | 2 | 1974, 1983 |
| Oklahoma State | 2 | 1945, 1946 |
| San Francisco | 2 | 1955, 1956 |
| Arizona | 1 | 1997 |
| Arkansas | 1 | 1994 |
| California | 1 | 1959 |
| CCNY | 1 | 1950 |
| Georgetown | 1 | 1984 |
| Holy Cross | 1 | 1947 |
| La Salle | 1 | 1954 |
| Loyola-Chicago | 1 | 1963 |
| Marquette | 1 | 1977 |
| Maryland | 1 | 2002 |
| Michigan | 1 | 1989 |
| Ohio State | 1 | 1960 |
| Oregon | 1 | 1939 |
| UNLV | 1 | 1990 |
| Stanford | 1 | 1942 |
| Syracuse | 1 | 2003 |
| UTEP | 1 | 1966 |
| Utah | 1 | 1944 |
| Virginia | 1 | 2019 |
| Wisconsin | 1 | 1941 |
| Wyoming | 1 | 1943 |
* 2013 title vacated by NCAA.
Tournament history
Mid-major teams
Mid-major teams—which are defined as teams from the America East Conference (America East), Atlantic Sun Conference (ASUN), Big Sky Conference (Big Sky), Big South Conference (Big South), Big West Conference (Big West), Colonial Athletic Conference (CAA), Conference USA (C-USA), Horizon League (Horizon), Ivy League (Ivy), Metro Atlantic Athletic Conference (MAAC), Mid-American Conference (MAC), Mid-Eastern Athletic Conference (MEAC), Missouri Valley Conference (MVC), Mountain West Conference (MW), Northeast Conference (NEC), Ohio Valley Conference (OVC), Patriot League (Patriot), Southern Conference (SoCon), Southland Conference (Southland), Southwestern Athletic Conference (SWAC), Summit League (Summit), Sun Belt Conference (Sun Belt), West Coast Conference (WCC), and the Western Athletic Conference (WAC)—have experienced success in the tournament at various times.[15]
The last time, as of 2020, a mid-major team won the National Championship was 1990 when UNLV won with a 103–73 win over Duke, since UNLV was then a member of the Big West and since 1999 has been a member of the MW; the Big West was not then considered a power conference, nor is the MW today. However, during the tenure of UNLV's coach at the time, Jerry Tarkanian, the Runnin' Rebels were widely viewed as a major program despite their conference affiliation (a situation similar to that of Gonzaga in the 2010s). The last time, as of 2020, an independent mid-major team won the National Championship was 1977 when Marquette won with a 67–59 win over North Carolina. However, at the time, a significant minority of NCAA Division I schools were still independents, with several of these, including Marquette, being traditional basketball powers. (Marquette is now a member of the Big East Conference, the one non-football league that is universally considered a major basketball conference.) The last time, as of 2020, a mid-major team from a small media market (defined as a market out of the top 25 television markets in the United States in 2019) won the National Championship was arguably 1962 when Cincinnati, then in the MVC, won 71–59 over Ohio State of the Big Ten, since Cincinnati's TV market is listed 35th in the nation as of 2019. However, there was much less of a division between "major" and "mid-major" conferences in 1962, and the MVC was generally seen in that day as a major basketball conference.
The last time the Final Four was composed, as of 2020, of at least 75% mid-major teams (3/4), i.e. excluding all present-day major conferences or their predecessors, was 1979, where Indiana State, then as now of the Missouri Valley Conference (which had lost several of its most prominent programs, among them Cincinnati, earlier in the decade); Penn, then as now in the Ivy League; and DePaul, then an independent, participated in the Final Four, only to see Indiana State lose to Michigan State. The last time, as of 2020, the Final Four has been composed of at least 50% mid-major teams (2/4) was 2011, when VCU, then of the Colonial Athletic Association, and Butler, then of the Horizon League, participated in the Final Four, only to see Butler lose to Connecticut. Two of the three most recent Final Fours have involved a single "mid-major" team by the definition used here—the 2017 and 2018 tournaments, in which Gonzaga and Loyola–Chicago were respectively involved (although by 2017 Gonzaga, which has appeared in every NCAA tournament in the 21st century, was generally considered a major program despite its membership in the mid-major WCC[lower-alpha 1]). To date, as of 2020, no Final Four has been composed of 100% mid-major teams (4/4), therefore guaranteeing a mid-major team winning the National Championship.
Arguably the tournament with the most mid-major success was the 1970 tournament, where the Sweet Sixteen, Elite Eight, Final Four, and National Championship Game had 63% representation of mid-major teams in the Sweet 16 (10/16), 75% representation in the Elite 8 (6/8), 75% representation in the Final 4 (3/4), and 50% representation in the National Championship Game (1/2). Jacksonville lost to UCLA in the National Championship, with New Mexico State defeating St. Bonaventure for third place.
Below is a table that shows the performance of mid-major teams from the Sweet Sixteen round to the National Championship Game from 1939—the tournament's first year—to the present day.
- Notes
- The first column is a list of every mid-major conference. For the conferences that have predecessor names, a footnote (below the table) lists those names and years. Opposite each conference's name are the schools that have appeared in the tournament from the Sweet Sixteen onwards when the school was a member of the conference or a predecessor conference.
- Some of the conferences that are now considered mid-majors were regarded as major conferences in the past. For example:
- The Missouri Valley Conference was considered a major basketball conference until many of its most prominent members left in the mid-1970s (before Indiana State's 1979 run to the title game).
- Conference USA was considered a major conference at its formation in 1995. It arguably became a mid-major in 2005, when several of its more prominent teams left for the Big East Conference, and unquestionably became a mid-major during the early-2010s realignment cycle.
- The WAC was considered a major conference until 1999, when 8 of its 16 members left to form the Mountain West Conference.
- The MW was considered a major basketball conference until 2011, when two of its most prominent basketball programs (BYU and Utah) left for other conferences (West Coast Conference and Pac-12, respectively).
- As alluded to above, certain programs that were members of "mid-major" conferences during deep tournament runs are nonetheless widely viewed as having been major programs at that time. The same applies to many programs that were independent before the 1980s. Examples include (but are not limited to) San Francisco in the 1950s, Marquette in the 1970s, UNLV in the last part of the 20th century, and Gonzaga today.
| Mid-Major Conference | Sweet Sixteen | Elite Eight | Final Four | Championship Game | National Champion |
|---|---|---|---|---|---|
| America East[nb 1] | – | – | – | – | – |
| ASUN [nb 2] | Florida Gulf Coast (2013) | – | – | – | – |
| Big Sky | Weber State (1969, 1972), Montana (1975), Idaho (1982) | Idaho State (1977) | – | – | – |
| Big South | – | – | – | – | – |
| Big West[nb 3] | Long Beach State (1973), UNLV (1975, 1976, 1984, 1986), Fresno State (1982), New Mexico State (1992) | Long Beach State (1972), Cal State Fullerton (1978), UNLV (1989) | UNLV (1977, 1987, 1991) | – | UNLV (1990) |
| CAA[nb 4] | Navy (1986), Richmond (1988) | – | George Mason (2006), VCU (2011) | – | |
| C-USA | Louisville (1996), Cincinnati (2001), UAB (2004), Memphis (2009) | Cincinnati (1996), Louisville (1997), Memphis (2006, 2007) | Marquette (2003), Louisville (2005) | Memphis (2008[nb 5]) | – |
| Horizon[nb 6] | Loyola (Chicago) (1985), Xavier (1990), Butler (2003, 2007), Milwaukee (2005) | – | – | Butler (2010, 2011) | – |
| Ivy | Princeton (1967), Columbia (1968), Cornell (2010) | Dartmouth (1958) | Princeton (1965), Penn (1979) | – | – |
| MAAC | – | – | – | – | – |
| MAC | Bowling Green (1963), Central Michigan (1975), Western Michigan (1976), Toledo (1979), Ball State (1990), Eastern Michigan (1991), Miami (Ohio) (1999), Ohio (2012) | Ohio (1964), Kent State (2002) | – | – | – |
| MEAC | – | – | – | – | – |
| MVC | Saint Louis (1957), Cincinnati (1958, 1966), Creighton (1962, 1964, 1974), Tulsa (1994, 1995), Southwest Missouri State (1999), Southern Illinois (1977, 2002, 2007), Wichita State (2006, 2015), Bradley (2006), Northern Iowa (2010) | Creighton (1941), Saint Louis (1952), Bradley (1955), Wichita State (1964, 1981), Drake (1970, 1971) | Oklahoma A&M (1949), Cincinnati (1960), Wichita State (1965, 2013), Drake (1969), Loyola–Chicago (2018) | Bradley (1950, 1954), Cincinnati (1963), Indiana State (1979) | Oklahoma A&M (1945, 1946), Cincinnati (1961, 1962) |
| MW | Utah (2005), UNLV (2007), BYU (2011), San Diego State (2011, 2014), Nevada (2018) | – | – | – | – |
| NEC | – | – | – | – | – |
| OVC | Morehead State (1961), Austin Peay (1973) | – | – | – | – |
| Patriot[nb 7] | – | – | – | – | – |
| SoCon | East Tennessee State (1968), Furman (1974), VMI (1977), Chattanooga (1997) | VMI (1976), Davidson (1968, 1969, 2008) | – | – | – |
| Southland | Lamar (1980), Louisiana Tech (1985) | – | – | – | – |
| SWAC | – | – | – | – | – |
| Summit[nb 8] | Cleveland State (1986), Valparaiso (1998) | – | – | – | – |
| Sun Belt | Western Kentucky (1993, 2008) | UAB (1982) | UNC Charlotte (1977) | – | – |
| WCC[nb 9] | Santa Clara (1970), Pacific (1971), Pepperdine (1976), San Francisco (1979), Gonzaga (2000, 2001, 2006, 2009, 2016, 2018), St. Mary's (California) (2010) | St. Mary's (California) (1959), Pacific (1967), Santa Clara (1969), San Francisco (1974), Loyola Marymount (1990), Gonzaga (1999, 2015, 2019) | Santa Clara (1952), San Francisco (1957) | Gonzaga (2017) | San Francisco (1955, 1956) |
| WAC | Colorado State (1969), New Mexico (1974), Wyoming (1987), Utah (1991, 1996), UTEP (1992), Nevada (2004) | BYU (1981), Utah (1997), Tulsa (2000) | Utah (1966) | Utah (1998) | Texas Western (1966) |
- Known as the Eastern College Athletic Conference-North from 1979 to 1988 and the North Atlantic Conference from 1988 to 1996.
- Known as the Trans America Athletic Conference (TAAC) from 1978 to 2001.
- Known as the Pacific Coast Athletic Association (PCAA) from 1969 to 1988.
- Known as the Eastern College Athletic Conference-South from 1979 to 1985.
- Vacated due to academic ineligibility and impermissible benefits given to Derrick Rose
- Known as the Midwestern City Conference from 1979 to 1985 and the Midwestern Collegiate Conference from 1985 to 2001.
- Known as the Colonial League from 1986 to 1990, a period in which it was a football-only conference.
- Known as the Association of Mid-Continent Universities from 1982 to 1989 and the Mid-Continent Conference (MCC) until 2007.
- Known as the California Basketball Association from 1952 to 1956 and the West Coast Athletic Conference (WCAC) from 1956 to 1989.
Defunct conferences and independents
This table shows mid-major teams that saw success in the tournament from now-defunct conferences or were independents.
The Metro Conference, which operated from 1975 to 1995, is not listed here because it was considered a major basketball conference throughout its history. Most notably, Louisville, which was a member for the league's entire existence, won both of its NCAA-recognized titles (1980, 1986) while in the Metro.
| Mid-Major Conference | Sweet Sixteen | Elite Eight | Final Four | Championship Game | National Champion |
|---|---|---|---|---|---|
| Border Intercollegiate Athletic Conference[nb 1] | New Mexico State (1952) | Arizona State (1961) | – | – | – |
| East Coast Conference[nb 2] | – | Saint Joseph's (1981) | – | – | – |
| Eastern Intercollegiate Basketball League[nb 3] | – | Dartmouth (1941) | – | Dartmouth (1942, 1944) | – |
| Great Midwest Conference[nb 4] | Marquette (1994), Memphis (1995) | Memphis State (1992), Cincinnati (1993) | Cincinnati (1992) | – | – |
| Metropolitan New York Conference[nb 5] | NYU (1943, 1946, 1951, 1962, 1963), Manhattan (1958) | City College of New York (1947) | NYU (1960) | NYU (1952) | City College of New York (1950) |
| Middle Atlantic Conference[nb 6] | Saint Joseph's (1959, 1960, 1962, 1965, 1966) | Saint Joseph's (1963) | Saint Joseph's (1961) | – | – |
| Mountain States Conference[nb 7] | BYU (1950, 1951, 1957) | Wyoming (1941) | Utah State (1939) | – | Wyoming (1943) |
| New Jersey-New York 7 Conference[nb 8] | – | St. John's (1979) | – | – | – |
| Southern Intercollegiate Athletic Association[nb 9] | – | Western Kentucky (1940) | – | – | – |
| Southwest Conference[nb 10] | – | Rice (1942) | – | – | – |
| Western New York Little Three Conference[nb 11] | Canisius (1957) | Canisius (1955, 1956) | – | – | – |
| Yankee Conference[nb 12] | UConn (1956, 1976) | UConn (1964) | – | – | – |
| Independents | Montana State (1951), Dayton (1952, 1965, 1966, 1974), DePaul (1953, 1959, 1960, 1965, 1976, 1984, 1986[nb 13], 1987[nb 13]), Seattle (1953, 1955, 1956, 1964), Butler (1962), Utah State (1962, 1964), Niagara (1970), Cincinnati (1975), Detroit (1977) | Brown (1939), Springfield (1940), Oklahoma City (1957), Boston University (1959), Utah State (1970), DePaul (1978), Dayton (1984) | Duquesne (1940), DePaul (1943, 1979), Bradley (1955), New Mexico State (1970), St. Bonaventure (1970), Rutgers (1976) | Bradley (1954), La Salle (1955), Seattle (1958), Dayton (1967), Jacksonville (1970) | Utah (1944), Holy Cross (1947), La Salle (1954), Loyola (Chicago) (1963), Texas Western (1966), Marquette (1977) |
- Established in 1931 and dissolved in 1962.
- Established in 1958 and dissolved in 1994.
- Established in 1901 and dissolved in 1955, though claimed by the Ivy League as a part of its own history.
- Established in 1990 and merged into Conference USA in 1995.
- Established in 1933 and dissolved in 1963.
- Established in 1912 and became a Division III conference after 1974.
- Established in 1938 and known as the Skyline Conference from 1951 to 1962 before the conference dissolved in early 1962.
- Established in 1976 and dissolved in 1979.
- Established in 1894 and dissolved in 1942.
- Established in 1914 and dissolved in 1996.
- Established in 1946 and dissolved in 1958.
- Established in 1946 by former members of the New England Conference, which was founded in 1938 but never placed a team in the NCAA Tournament; became a football-only conference in 1976 and dissolved in 1997.
- Vacated by the NCAA
Tournament droughts
List of schools with the longest time between NCAA tournament appearances (minimum 20-year drought):
| School | Appearance | Next Appearance | Years |
|---|---|---|---|
| Harvard | 1946 | 2012 | 66 years |
| Dartmouth | 1959 | – | 59 years & ongoing |
| Yale | 1962 | 2016 | 54 years |
| Tennessee Tech | 1963 | - | 55 years & ongoing |
| Bowling Green | 1968 | 50 years & ongoing | |
| Columbia | |||
| Seattle | 1969 | 49 years & ongoing (not in Division I in 29 of those years) | |
| Rice | 1970 | 48 years & ongoing | |
| Stanford | 1942 | 1989 | 47 years |
| Brown | 1939 | 1986 | 47 years (also 32 years & ongoing since 1987) |
| Wisconsin | 1947 | 1994 | 47 years |
| Air Force | 1962 | 2004 | 42 years |
| Iowa State | 1944 | 1985 | 41 years |
| Duquesne | 1977 | - | 41 years & ongoing |
| VMI | |||
| Washington State | 1941 | 1980 | 39 years |
| Baylor | 1950 | 1988 | 38 years |
| Toledo | 1980 | – | 38 years & ongoing |
| Drake | 1971 | 2008 | 37 years |
| Portland | 1959 | 1996 | 37 years (also 22 years & ongoing since 1997) |
| Oregon | 1961 | 1995 | 34 years[17] |
| Loyola-Chicago | 1985 | 2018 | 33 years |
| Georgetown | 1943 | 1975 | 32 years |
| Marist | 1987 | – | 31 years & ongoing |
| Marshall | 1987 | 2018 | 31 years |
| Massachusetts | 1962 | 1992 | 30 years |
| California | 1960 | 1990 | 30 years |
| Cal State Fullerton | 1978 | 2008 | 30 years |
| Saint Mary's | 1959 | 1989 | 30 years |
| Mercer | 1985 | 2014 | 29 years |
| Idaho | 1990 | – | 28 years & ongoing |
| Loyola Marymount | |||
| Mississippi State | 1963 | 1991 | 28 years |
| Gonzaga | 1967 | 1994 | 27 years [lower-roman 1] |
| Louisiana Tech | 1991 | – | 27 years & ongoing |
| Rutgers | |||
| Fordham | 1992 | – | 26 years & ongoing |
| Oregon State | 1990 | 2016 | 26 years |
| Penn State | 1965 | 1991 | |
| East Carolina | 1993 | – | 26 years & ongoing |
| Georgia Tech | 1960 | 1985 | 25 years |
| Navy | 1960 | 1985 | |
| LSU | 1954 | 1979 | |
| Northeastern | 1991 | 2015 | 24 years |
| FIU | 1995 | – | 23 years & ongoing |
| Tulane | |||
| Santa Clara | 1996 | – | 22 years & ongoing |
| Northern Illinois | |||
| Southern Methodist | 1993 | 2015 | 22 years |
| East Carolina | 1972 | 1993 | 21 years |
| Southern Miss | 1991 | 2012 | |
| Baylor | 1988 | 2008 | 20 years |
| Cornell | |||
| Green Bay | 1996 | 2016 | |
| Navy | 1998 | – | 20 years & ongoing |
| Illinois State | 1998 | – | 20 years & ongoing |
- Gonzaga also has an ongoing streak of 21 consecutive tournament appearances (1999–2019).
Through 2018, four schools that were considered "major college" by the Associated Press when it published its first college basketball rankings in 1948, and have been continuously in the AP's "major" classification, have yet to reach the national tournament. While the NCAA did not split into divisions until 1956 (university and college), the AP has distinguished "major colleges" from "small colleges" throughout the history of its basketball rankings.
| School |
|---|
| Army |
| The Citadel |
| St. Francis Brooklyn |
| William & Mary |
Evolution of the tournament
The NCAA tournament has changed its format many times over the years, many of which are listed below.
Expansion of field
The NCAA tournament field has expanded a number of times throughout its history.
Years Teams Byes Play-in
games1939–1950 8 1951–1952 16 1953–1968 22–25 7–10 1969–1974 25 7 1975–1978 32 0 1979 40 24 1980–1982 48 16 1983 52 16 4 1984 53 16 5 1985–2000 64 0 0 2001–2010 65 0 1 2011– 68 0 4
After the conclusion of the 2010 tournament, there was speculation about increasing the tournament size to as many as 128 teams. On April 1, the NCAA announced that it was looking at expanding to 96 teams for 2011. On April 22, the NCAA announced a new television contract with CBS/Turner that expanded the field to 68 teams.
From 2011 to 2015, the round of 64 was deemed to be the second round; beginning in 2016, the round of 64 was again deemed to be the first round.
Seeding history and statistics
The process of seeding was first used in 1978 for automatically qualified (Q) and at-large (L) teams respectively, and then for all teams within their respective region in 1979. Starting in 2004, the NCAA began releasing full seeding numbers making known the overall #1 seed.
No. 1 seeds by year and region
When seeding, the NCAA has used the following names for the four regions with the exception of 2004 to 2006 when they were named after host cities:
- East
- West
- Midwest ("Southwest" in 2011)
- South (1998–2010 and 2012–present, "Mideast" 1957–1984, "Southeast" 1985–1999 and 2011)
| Year | East | Midwest | South | West |
|---|---|---|---|---|
| 1979 | North Carolina | Indiana State | Notre Dame | UCLA |
| 1980 | Syracuse | LSU | Kentucky | DePaul |
| 1981 | Virginia | LSU | DePaul | Oregon State* |
| 1982 | North Carolina | DePaul | Virginia | Georgetown |
| 1983 | St. John's | Houston | Louisville | Virginia |
| 1984 | North Carolina | DePaul | Kentucky | Georgetown |
| 1985 | Georgetown | Oklahoma | Michigan | St. John's |
| 1986 | Duke | Kansas | Kentucky | St. John's |
| 1987 | North Carolina | Indiana | Georgetown | UNLV |
| 1988 | Temple | Purdue | Oklahoma | Arizona |
| 1989 | Georgetown | Illinois | Oklahoma | Arizona |
| 1990 | Connecticut | Oklahoma | Michigan State | UNLV |
| 1991 | North Carolina | Ohio State | Arkansas | UNLV |
| 1992 | Duke | Kansas | Ohio State | UCLA |
| 1993 | North Carolina | Indiana | Kentucky | Michigan* |
| 1994 | North Carolina | Arkansas | Purdue | Missouri |
| 1995 | Wake Forest | Kansas | Kentucky | UCLA |
| 1996 | Massachusetts* | Kentucky | Connecticut | Purdue |
| 1997 | North Carolina | Minnesota* | Kansas | Kentucky |
| 1998 | North Carolina | Kansas | Duke | Arizona |
| 1999 | Duke | Michigan State | Auburn | Connecticut |
| 2000 | Duke | Michigan State | Stanford | Arizona |
| 2001 | Duke | Illinois | Michigan State | Stanford |
| 2002 | Maryland | Kansas | Duke | Cincinnati |
| 2003 | Oklahoma | Kentucky | Texas | Arizona |
| 2004 | St. Joseph's | Kentucky† | Duke | Stanford |
| 2005 | North Carolina | Illinois† | Duke | Washington |
| 2006 | Connecticut | Villanova | Duke† | Memphis |
| 2007 | North Carolina | Florida† | Ohio State | Kansas |
| 2008 | North Carolina† | Kansas | Memphis* | UCLA |
| 2009 | Pittsburgh | Louisville† | North Carolina | Connecticut |
| 2010 | Kentucky | Kansas† | Duke | Syracuse |
| 2011 | Ohio State† | Kansas | Pittsburgh | Duke |
| 2012 | Syracuse | North Carolina | Kentucky† | Michigan State |
| 2013 | Indiana | Louisville*† | Kansas | Gonzaga |
| 2014 | Virginia | Wichita State | Florida† | Arizona |
| 2015 | Villanova | Kentucky† | Duke | Wisconsin |
| 2016 | North Carolina | Virginia | Kansas† | Oregon |
| 2017 | Villanova† | Kansas | North Carolina | Gonzaga |
| 2018 | Villanova | Kansas | Virginia† | Xavier |
| 2019 | Duke† | North Carolina | Virginia | Gonzaga |
| 2020 | Tournament cancelled due to the COVID-19 outbreak | |||
* Vacated.
Bold denotes team also won tournament.
† Overall #1 Seed starting in 2004.
To date, only Kentucky and Virginia have had a #1 seed in each of the four regions
Number of #1 seeds by school
| #1 Seeds | School |
|---|---|
| 17 | North Carolina |
| 14 | Kansas, Duke |
| 12 | Kentucky |
| 7 | Virginia |
| 6 | Arizona |
| 5 | UConn, Georgetown, Michigan State, Oklahoma |
| 4 | DePaul, Ohio State, UCLA, Villanova |
| 3 | Illinois, Indiana, Purdue, St. John's, Stanford, Syracuse, UNLV, Gonzaga |
| 2 | Arkansas, Florida, Louisville*, LSU, Pittsburgh |
| 1 | Auburn, Cincinnati, Houston, Indiana State, Maryland, Memphis*, Michigan*, Missouri, Notre Dame, Oregon, St. Joseph's, Temple, Texas, Wake Forest, Washington, Wichita State, Wisconsin, Xavier |
Last updated through 2018 tournament.
* Vacated appearances excluded (see #1 seeds by year and region).
Venues
For a list of all the cities and arenas that have hosted the Final Four, go to Host cities, below.
Municipal Auditorium in Kansas City, Missouri, hosted the Final Four nine times, followed by the third Madison Square Garden in New York City, which hosted seven times, and Louisville's Freedom Hall, which hosted six times. Additionally, Indianapolis has hosted the Final Four seven times, across three venues.
Stadium size and domes
From 1997 to 2013, the NCAA required that all Final Four sessions take place in domed stadiums with a minimum capacity of 40,000, usually having only half of the dome in use. The Metrodome in Minneapolis, which usually hosted baseball and football, had one of the long ends of the court along the first baseline with temporary stands surrounding the court so that much of the outfield is isolated from the action. The same was true of football stadiums like the Alamodome in San Antonio and the RCA Dome in Indianapolis. The last NBA arena to host the Final Four was the Meadowlands Arena, then known as Continental Airlines Arena, in 1996. As of 2009, the minimum was increased to 70,000, by adding additional seating on the floor of the dome, and raising the court on a platform three feet above the dome's floor, which is usually crowned for football, like the setup at Ford Field in Detroit which hosted 2009 Final Four.
In September 2012, the NCAA began preliminary discussions on the possibility of returning occasional Final Fours to basketball-specific arenas in major metropolitan areas. According to ESPN.com writer Andy Katz, when Mark Lewis was hired as NCAA executive vice president for championships during 2012, "he took out a United States map and saw that both coasts are largely left off from hosting the Final Four."[18] Lewis added in an interview with Katz,
I don't know where this will lead, if anywhere, but the right thing is to sit down and have these conversations and see if we want our championship in more than eight cities or do we like playing exclusively in domes. None of the cities where we play our championship is named New York, Boston, Los Angeles, Chicago or Miami. We don't play on a campus. We play in professional football arenas.[18]
Under then-current criteria, only eleven stadiums, all but two of which are current NFL venues, could be considered as Final Four locations:[18]
- AT&T Stadium, Arlington (opened in 2009)
- AT&T Stadium, originally known as Cowboys Stadium, holds the world record basketball attendance when 108,713 attended the 2010 NBA All-Star Game.[19]
- Allegiant Stadium, Las Vegas (opening in 2020)
- The Dome at America's Center, St. Louis (opened in 1995)
- Ford Field, Detroit (opened in 2002)
- Lucas Oil Stadium, Indianapolis (opened in 2008)
- Mercedes-Benz Stadium, Atlanta (opened in 2017)
- replaced the Georgia Dome, operational August 1992 to March 2017
- Mercedes-Benz Superdome, New Orleans (opened in 1975)
- NRG Stadium, Houston (opened in 2002)
- State Farm Stadium, Glendale (opened in 2007)
- SoFi Stadium
- U.S. Bank Stadium, Minneapolis (opened in 2016)
- replaced the Hubert H. Humphrey Metrodome, operational April 1982 to January 2014
- Alamodome, San Antonio (opened in 1990)
Two domed stadiums that have hosted past Final Fours—the Alamodome (1998, 2004, 2008, 2018) and Tropicana Field in St. Petersburg, Florida (1999)—were considered too small to be eligible to host, despite the Alamodome being a college football stadium and having a permanent seating capacity of 65,000. The basketball setup at the Alamodome prior to 2018 used only half of the stadium and had a capacity of 39,500. This was changed for the 2018 Final Four to place a raised court at the center of the stadium as has been done with other football facilities.[18]
The first instance of a domed stadium being used for an NCAA Tournament Final Four was the Houston Astrodome in 1971, but the Final Four would not return to a dome until 1982 when the Louisiana Superdome in New Orleans hosted the event for the first time.
On June 12, 2013, Katz reported that the NCAA had changed its policy. In July 2013, the NCAA had a portal available on its website for venues to make Final Four proposals in the 2017–2020 period, and there were no restrictions on proposals based on venue size. Also, the NCAA decided that future regionals will no longer be held in domes. In Katz' report, Lewis indicated that the use of domes for regionals was intended as a dry run for future Final Four venues, but this particular policy was no longer necessary because all of the Final Four sites from 2014 to 2016 had already hosted regionals.[20] At least one other report indicated that the new policy would still allow a completely new domed stadium, or an existing dome that has never hosted a Final Four (such as State Farm Stadium), to receive a regional if it is awarded a future Final Four. In November 2014, reflecting the new policy's effect, the NCAA announced that what is now State Farm Stadium would host the Final Four in 2017.[21][22]
Other changes
Bids per conferences
Prior to 1975, only one team per conference could be in the NCAA tournament. However, after several highly ranked teams in the country were denied entrance into the tournament (e.g., South Carolina, which was 14–0 in ACC regular season play during 1970 but lost in the ACC tournament; Southern Cal, which was ranked #2 in the nation during 1971; and Maryland, which was ranked #3 in the nation in 1974 but lost the ACC tournament championship game to eventual national champion North Carolina State), the NCAA began to place at-large teams in the tournament, instead of just conference champions. At times during the pre-at-large era, the NIT tournament competed for prestige with the NCAA tournament. However, in the 1950s the NCAA ruled that no team could compete in both tournaments.[23] But when 8th ranked Marquette declined its invitation in 1970 after coach Al McGuire complained about the Warriors' regional placement and instead went to the NIT (which it won), the NCAA changed the rule to forbid a team that declines an NCAA Tournament bid from participating in any post-season tournament. Since then, the NCAA tournament has clearly been the major one, with conference champions and the majority of the top-ranked teams participating in it.[24]
Consolation games
A third-place game was held from 1946 to 1981. Additionally, when the tournament was first held in 1939 with only two regionals (East and West), the West held a third-place game, but the East did not. The East began holding its own third-place game in 1941, and from then on every regional held a third-place game through the 1975 tournament.
Play-In games
Beginning in 2001, the field was expanded from 64 to 65 teams, adding to the tournament what was informally known as the "play-in game." This was in response to the creation of the Mountain West Conference during 1999. Originally, the winner of the Mountain West's tournament did not receive an automatic bid, and doing so would mean the elimination of one of the at-large bids. As an alternative to eliminating an at-large bid, the NCAA expanded the tournament to 65 teams. The #64 and #65 seeds were seeded in a regional bracket as the 16a/16b seeds, and then played the NCAA Division I Men's Basketball Opening Round Game (the "play-in game") on the Tuesday preceding the first weekend of the tournament. This game was always played at the University of Dayton Arena in Dayton, Ohio.
During 2011, the tournament expanded to 68 teams. Four "play-in" games are now played, officially known as the "First Four".[25] However, the teams playing in the First Four are not automatically seeded #16; their seeding is determined by the committee on Selection Sunday. Explaining the reasoning for this format, selection committee chairman Dan Guerrero said, "We felt if we were going to expand the field it would create better drama for the tournament if the First Four was much more exciting. They could all be on the 10 line or the 12 line or the 11 line."[25]
Play-In round naming
From 1985 to 2010, the round consisting of 64 teams and 32 games was called the "first round", while the round consisting of 32 teams and 16 games was called the "second round". From 2011 to 2015, the "First Four" became the first round. The round after the "First Four", the round of 64 played on Thursday and Friday, was called the "second round"; the round of 32 was then called the "third round", consisting of games played on Saturday and Sunday.[25] In 2016, the naming reverted to the round of 64 being the "first round" once again, and the round of 32 being the "second round".[26]
Pod system
For the 1985 to 2001 tournaments, all teams playing at a first- or second-round site fed into the same regional site. Since 2002, the tournament has used the "pod system" designed to limit the early-round travel of as many teams as possible. In the pod system, each of the eight first- and second-round sites is assigned two pods, where each group of four teams play each other. A host site's pods may be from different regions, and thus the winners of each pod would advance into separate regional tournaments.
The possible pods by seeding are:
- Pod #1: 1v16, 8v9
- Pod #2: 2v15, 7v10
- Pod #3: 3v14, 6v11
- Pod #4: 4v13, 5v12
National Semifinal seeding
Since 2004, the semi-final matches during the first day of the Final Four weekend have been determined by a procedure based upon the original seeding of the full field. From 1973 through 2003, the pitting of regional champions in the semi-finals was on a rotational basis. Prior to 1973, one semifinal matched the champions of the eastern regions, and the other matched the champions of the western regions.
Other notes
Home court advantage
On several occasions NCAA tournament teams played their games in their home arena. In 1959, Louisville played at its regular home of Freedom Hall; however, the Cardinals lost to West Virginia in the semifinals. In 1984, Kentucky defeated Illinois, 54–51 in the Elite Eight on its home court of Rupp Arena. In 1985, Dayton played its first-round game against Villanova (it lost 51–49) on its home floor. In 1986 (beating Brown before losing to Navy) and '87 (beating Georgia Southern and Western Kentucky), Syracuse played the first 2 rounds of the NCAA tournament in the Carrier Dome. Also in 1986, LSU played in Baton Rouge on its home floor for the first 2 rounds despite being an 11th seed (beating Purdue and Memphis State). In 1987, Arizona lost to UTEP on its home floor in the first round. In 2015, Dayton played at its regular home of UD Arena, and the Flyers beat Boise State in the First Four.
Since the inception of the modern Final Four in 1952, only once has a team played a Final Four on its actual home court—Louisville in 1959. But through the 2015 tournament, three other teams have played the Final Four in their home cities, one other team has played in its metropolitan area, and six additional teams have played the Final Four in their home states through the 2015 tournament. Kentucky (1958 in Louisville), UCLA (1968 and 1972 in Los Angeles, 1975 in San Diego), and North Carolina State (1974 in Greensboro) won the national title; Louisville (1959 at its home arena, Freedom Hall); Purdue (1980 in Indianapolis) lost in the Final Four; and California (1960 in suburban San Francisco), Duke (1994 in Charlotte), Michigan State (2009 in Detroit), and Butler (2010 in Indianapolis) lost in the final.
In 1960, Cal had nearly as large an edge as Louisville had the previous year, only having to cross the San Francisco Bay to play in the Final Four at the Cow Palace in Daly City; the Golden Bears lost in the championship game to Ohio State. UCLA had a similar advantage in 1968 and 1972 when it advanced to the Final Four at the Los Angeles Memorial Sports Arena, not many miles from the Bruins' homecourt of Pauley Pavilion (also UCLA's home arena before the latter venue opened in 1965, and again during the 2011–12 season while Pauley was closed for renovations); unlike Louisville and Cal, the Bruins won the national title on both occasions. Butler lost the 2010 title 6 miles (9.7 km) from its Indianapolis campus and was regarded as the host school, as it is most times whenever the NCAA holds a tournament in Indianapolis (in the 2013 tournament, Butler's former conference, the Horizon League, was considered the host for the Midwest Regional rather than Butler).
Before the Final Four was established, the East and West regionals were held at separate sites, with the winners advancing to the title game. During that era, three New York City teams, all from Manhattan, played in the East Regional at Madison Square Garden—frequently used as a "big-game" venue by each team—and advanced at least to the national semifinals. NYU won the East Regional in 1945 but lost in the title game, also held at the Garden, to Oklahoma A&M. CCNY played in the East Regional in both 1947 and 1950; the Beavers lost in the 1947 East final to eventual champion Holy Cross but won the 1950 East Regional and national titles at the Garden.
In 1974, North Carolina State won the NCAA tournament without leaving its home state of North Carolina. The team was put in the East Region, and played its regional games at its home arena Reynolds Coliseum. NC State played the final four and national championship games at nearby Greensboro Coliseum.
While not its home state, Kansas has played in the championship game in Kansas City, Missouri, only 45 minutes from the campus in Lawrence, Kansas, not just once, but four times. In 1940, 1953, and 1957 the Jayhawks lost the championship game each time at Municipal Auditorium. In 1988, playing at Kansas City's Kemper Arena, Kansas won the championship, over Big Eight–rival Oklahoma. Similarly, in 2005, Illinois played in St. Louis, Missouri, where it enjoyed a noticeable homecourt advantage, yet still lost in the championship game to North Carolina.
Flag controversy
The NCAA had banned the Bon Secours Wellness Arena, originally known as Bi-Lo Center, and Colonial Life Arena, originally Colonial Center, in South Carolina from hosting tournament games, despite their sizes (16,000 and 18,000 seats, respectively) because of an NAACP protest at the Bi-Lo Center during the 2002 first and second round tournament games over that state's refusal to completely remove the Confederate Battle Flag from the state capitol grounds, although it had already been relocated from atop the capitol dome to a less prominent place in 2000. Following requests by the NAACP and Black Coaches Association, the Bi-Lo Center, and the newly built Colonial Center, which was built for purposes of hosting the tournament, were banned from hosting any future tournament events.[27] As a result of the removal of the battle flag from the South Carolina State Capitol, the NCAA lifted its ban on South Carolina hosting games in 2015, and it was able to host in 2017 due to House Bill 2 (see next section).[28]
House Bill 2
On September 12, 2016, the NCAA stripped the State of North Carolina of hosting rights for seven upcoming college sports tournaments and championships held by the association, including early round games of the 2017 NCAA Division I Men's Basketball Tournament scheduled for the Greensboro Coliseum. The NCAA argued that House Bill 2 made it "challenging to guarantee that host communities can help deliver [an inclusive atmosphere]".[29][30] Bon Secours Wellness Arena was able to secure the bid to be the replacement site.[31]
Rituals and influence
Cutting down the nets
As a tournament ritual, the winning team cuts down the nets at the end of regional championship games as well as the national championship game. Starting with the seniors, and moving down by classes, players each cut a single strand off of each net; the head coach cuts the last strand connecting the net to the hoop, claiming the net itself.[32] An exception to the head coach cutting the last strand came in 2013, when Louisville head coach Rick Pitino gave that honor to Kevin Ware, who had suffered a catastrophic leg injury during the tournament.[33] This tradition is credited to Everett Case, the coach of North Carolina State, who stood on his players' shoulders to accomplish the feat after the Wolfpack won the Southern Conference tournament in 1947.[34] CBS, since 1987 and yearly to 2015, in the odd-numbered years since 2017, and TBS, since 2016, the even-numbered years, close out the tournament with "One Shining Moment", performed by Luther Vandross.
Team awards
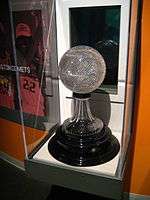
Just as the Olympics awards gold, silver, and bronze medals for 1st, 2nd, and 3rd place, respectively, the NCAA awards the National Champions a gold-plated Wooden NCAA National Championship trophy. The loser of the championship game receives a silver-plated National Runner-Up trophy for second place. Since 2006, all four Final Four teams receive a bronze plated NCAA Regional Championship trophy; prior to 2006, only the teams who did not make the title game received bronze plated trophies for being a semifinalist.
The champions also receive a commemorative gold championship ring, and the other three Final Four teams receive Final Four rings.
The National Association of Basketball Coaches also presents a more elaborate marble/crystal trophy to the winning team. Ostensibly, this award is given for taking the top position in the NABC's end-of-season poll, but this is invariably the same as the NCAA championship game winner. In 2005, Siemens AG acquired naming rights to the NABC trophy, which is now called the Siemens Trophy. Formerly, the NABC trophy was presented right after the standard NCAA championship trophy, but this caused some confusion.[35] Since 2006, the Siemens/NABC Trophy has been presented separately at a press conference the day after the game.[36]
Most Outstanding Player
After the championship trophy is awarded, one player is selected and then awarded the Most Outstanding Player award (which almost always comes from the championship team). It is not intended to be the same as a Most Valuable Player award although it is sometimes informally referred to as such.
Influence on the NBA draft
Because the National Basketball Association Draft takes place just three months after the NCAA tournament, NBA executives have to decide how players' performances in a maximum of seven games, from the First Four to the championship game, should affect their draft decisions. A 2012 study for the National Bureau of Economic Research explores how the March tournament affects the way that professional teams behave in the June draft. The study is based on data from 1997 to 2010 that looks at how college tournament standouts performed at the NBA level.[37][38]
The researchers determined that a player who outperforms his regular season averages or who is on a team that wins more games than its seed would indicate will be drafted higher than he otherwise would have been. At the same time, the study indicated that professional teams don't take college tournament performance into consideration as much as they should, as success in the tournament correlates with elite professional accomplishment, particularly top-level success, where a player makes the NBA All-Star Team three or more times. "If anything, NBA teams undervalue the signal provided by unexpected performance in the NCAA March Madness tournament as a predictor of future NBA success."[37][38]
Television coverage and revenues
Current television contracts
Since 2010, the NCAA has had a joint contract with CBS and Turner Broadcasting. The coverage of the tournament is split between CBS, TNT, TBS, and truTV.[39]
Broadcasters from CBS, TBS, and TNT's sports coverage are shared across all four networks, with CBS' college basketball teams supplemented with Turner's NBA teams, while studio segments take place at the CBS Broadcast Center in New York City and Turner's studios in Atlanta. In the New York-based studio shows, CBS' Greg Gumbel and Clark Kellogg are joined by Ernie Johnson, Jr., Kenny Smith, and Charles Barkley of TNT's Inside the NBA while Seth Davis of CBS assists with Casey Stern and various NBA TV personalities. While two of Turner's NBA voices, Kevin Harlan and Ian Eagle, are already employed by CBS in other capacities, they also lend analysts Reggie Miller, Chris Webber, Grant Hill, and Steve Smith and secondary play-by-play man Brian Anderson to CBS. In turn, CBS announcers Jim Nantz, Brad Nessler, Spero Dedes, Andrew Catalon, and Carter Blackburn appear on Turner network broadcasts along with analysts Jim Spanarkel, Bill Raftery, and Dan Bonner.
The current contract runs through 2024 and, for the first time in history, provides for the nationwide broadcast each year of all games of the tournament. All First Four games air on truTV. A featured first- or second-round game in each time "window" is broadcast on CBS, while all other games are shown either on TBS, TNT or truTV. The regional semifinals, better known as the Sweet Sixteen, are split between CBS and TBS. CBS had the exclusive rights to the regional finals, also known as the Elite Eight, through 2014. That exclusivity extended to the entire Final Four as well, but after the 2013 tournament Turner Sports elected to exercise a contractual option for 2014 and 2015 giving TBS broadcast rights to the national semifinal matchups.[40] CBS kept its national championship game rights.[40]
Since 2015, CBS and TBS split coverage of the Elite Eight. Since 2016 CBS and TBS alternate coverage of the Final Four and national championship game, with TBS getting the final two rounds in even-numbered years, and CBS getting the games in odd-numbered years. March Madness On Demand would remain unchanged, although Turner was allowed to develop their own service.[41]
The CBS broadcast provides the NCAA with over $500 million annually, and makes up over 90% of the NCAA's annual revenue.[42] The revenues from the multibillion-dollar television contract are divided among the Division I basketball playing schools and conferences as follows:[43]
- 1/6 of the money goes directly to the schools based on how many sports they play (one "share" for each sport starting with 14, which is the minimum needed for Division I membership).
- 1/3 of the money goes directly to the schools based on how many scholarships they give out (one share for each of the first 50, two for each of the next 50, ten for each of the next 50, and 20 for each scholarship above 150).
- 1/2 of the money goes to the conferences based on how well they did in the six previous men's basketball tournaments (counting each year separately, one share for each team getting in, and one share for each win except in the Final Four and, prior to the 2008 tournament, the Play-in game). In 2007, based on the 2001 through 2006 tournaments, the Big East received over $14.85 million, while the eight conferences that did not win a first-round game in those six years received slightly more than $1 million each. Most conferences distribute most of the revenue evenly to its member institutions, regardless of performance.[44]
The Division I Men's Basketball tournament is the only NCAA championship tournament where the NCAA does not keep the profits.
History of television coverage
CBS has been the major partner of the NCAA in televising the tournament since 1982, but there have been many changes in coverage since the tournament was first broadcast in 1969.
Early broadcast coverage
From 1969 to 1981, the NCAA tournament aired on NBC, but not all games were televised. The early rounds, in particular, were not always seen on TV.
In 1982, CBS obtained broadcast television rights to the NCAA tournament.
ESPN & CBS share coverage
In 1980, ESPN began showing the opening rounds of the tournament. This was the network's first contract signed with the NCAA for a major sport, and helped to establish ESPN's following among college basketball fans. ESPN showed six first-round games on Thursday and again on Friday, with CBS, from 1982 to 1990, then picking up a seventh game at 11:30 pm ET. Thus, 14 of 32 first-round games were televised. ESPN also re-ran games overnight. At the time, there was only one ESPN network, with no ability to split its signal regionally, so ESPN showed only the most competitive games. During the 1980s, the tournament's popularity on television soared.
CBS takes over
However, ESPN became a victim of its own success, as CBS was awarded the rights to cover all games of the NCAA tournament, starting in 1991. Only with the introduction of the so-called "play-in" game (between the 64 seed and the 65 seed) in the 2000s, did ESPN get back in the game (and actually, the first time this "play-in" game was played in 2001, the game was aired on The National Network, using CBS graphics and announcers, as both CBS and TNN were both owned by Viacom at the time.[45]
Through 2010, CBS broadcast the remaining 63 games of the NCAA tournament proper. Most areas saw only eight of 32 first-round games, seven of 16 second-round games, and four of eight regional semifinal games (out of the possible 56 games during these rounds; there would be some exceptions to this rule in the 2000s). Coverage preempted regular programming on the network, except during a 2-hour window from about 5 ET until 7 ET when the local affiliates could show programming. The CBS format resulted in far fewer hours of first-round coverage than under the old ESPN format but allowed the games to reach a much larger audience than ESPN was able to reach.
During this period of near-exclusivity by CBS, the network provided to its local affiliates three types of feeds from each venue: constant feed, swing feed, and flex feed. Constant feeds remained primarily on a given game, and were used primarily by stations with a clear local interest in a particular game. Despite its name, a constant feed occasionally veered away to other games for brief updates (as is typical in most American sports coverage), but coverage generally remained with the initial game. A swing feed tended to stay on games believed to be of natural interest to the locality, such as teams from local conferences, but may leave that game to go to other games that during their progress become close matches. On a flex feed, coverage bounced around from one venue to another, depending on action at the various games in progress. If one game was a blowout, coverage could switch to a more competitive game. A flex feed was provided when there were no games with a significant natural local interest for the stations carrying them, which allowed the flex game to be the best game in progress. Station feeds were planned in advance and stations had the option of requesting either constant or flex feed for various games.
Viewing options emerge
In 1999, DirecTV began broadcasting all games otherwise not shown on local television with its Mega March Madness premium package. The DirecTV system used the subscriber's ZIP code to black out games which could be seen on broadcast television. Prior to that, all games were available on C-Band satellite and were picked up by sports bars.
In 2003, CBS struck a deal with Yahoo! to offer live streaming of the first three rounds of games under its Yahoo! Platinum service, for $16.95 a month.[46] In 2004, CBS began selling viewers access to March Madness On Demand, which provided games not otherwise shown on broadcast television; the service was free for AOL subscribers. In 2006, March Madness On Demand was made free, and continued to be so to online users through the 2011 tournament. For 2012, it once again became a pay service, with a single payment of $3.99 providing access to all 67 tournament games. In 2013, the service, now renamed March Madness Live, was again made free, but uses Turner's rights and infrastructure for TV Everywhere, which requires sign-in though the password of a customer's cable or satellite provider to watch games, both via PC/Mac and mobile devices. Those that do not have a cable or satellite service or one not participating in Turner's TV Everywhere are restricted to games carried on the CBS national feed and three hours (originally four) of other games without sign-in, or coverage via Westwood One's radio coverage. Effective with the 2018 tournament, the national semifinals and final are under TV Everywhere restrictions if they are aired by Turner networks; before then, those particular games were not subject to said restrictions.
In addition, CBS Sports Network (formerly CBS College Sports Network) had broadcast two "late early" games that would not otherwise be broadcast nationally. These were the second games in the daytime session in the Pacific Time Zone, to avoid starting games before 10 AM. These games are also available via March Madness Live and on CBS affiliates in the market areas of the team playing. In other markets, newscasts, local programming or preempted CBS morning programming are aired. CBSSN is scheduled to continue broadcasting the official pregame and postgame shows and press conferences from the teams involved, along with overnight replays.[47]
HDTV coverage
The Final Four has been broadcast in HDTV since 1999. From 2000 to 2004, only one first/second round site and one regional site were designated as HDTV sites. In 2005, all regional games were broadcast in HDTV, and four first and second round sites were designated for HDTV coverage. Local stations broadcasting in both digital and analog had the option of airing separate games on their HD and SD channels, to take advantage of the available high definition coverage. Beginning in 2007, all games in the tournament (including all first and second-round games) were available in high definition, and local stations were required to air the same game on both their analog and digital channels. However, due to satellite limitations, first round "constant" feeds were only available in standard definition.[48] Moreover, some digital television stations, such as WRAL-TV in Raleigh, North Carolina, choose to not participate in HDTV broadcasts of the first and second rounds and the regional semifinals, and used their available bandwidth to split their signal into digital subchannels to show all games going on simultaneously.[49] By 2008, upgrades at the CBS broadcast center allowed all feeds, flex and constant, to be in HD for the tournament.
International broadcasts
As of 2011, ESPN International holds international broadcast rights to the tournament, distributing coverage to its co-owned networks and other broadcasters. ESPN produces the world feed for broadcasts of the Final Four and championship game, produced using ESPN College Basketball staff and commentators.[50][51][52]
Tournament statistics
Low seeded teams
Most successful low seeds
Best outcomes for low seeds since expansion to 64 teams in 1985:
| Seed | 2nd Round | Sweet Sixteen | Elite Eight | Final Four | Championship Game | National Champion |
|---|---|---|---|---|---|---|
| No. 16 | UMBC (2018) | – | – | – | – | – |
| No. 15 |
Middle Tennessee (2016) |
Florida Gulf Coast (2013) |
– | – | – | – |
| No. 14 | numerous (19 teams) |
|
– | – | – | – |
| No. 13 | numerous (22 teams) |
|
– | – | – | – |
| No. 12 | numerous (27 teams) |
numerous (19 teams) |
|
– | – | – |
| No. 11 | numerous (29 teams) |
numerous (14 teams) |
|
– | – | |
| No. 10 | numerous (29 teams) |
numerous (17 teams) |
|
|
– | – |
| No. 9 | numerous (61 teams) |
|
– | – | ||
| No. 8 | N/A |
|
|
| ||
| No. 7 | N/A | numerous (15 teams) |
|
Best performances by No. 16 seeds
In 2018, UMBC became the first No. 16 seed to defeat a No. 1 seed in the men's tournament, shocking Virginia 74–54. Before this breakthrough, five other 16 seeds lost by 4 or fewer points:
- While ultimately Murray State lost to Michigan State by 4 points (75–71) in 1990, it was the only No. 16 team to take a game into overtime.
- East Tennessee State lost to Oklahoma in 1989 (1 point, 72–71)
- Princeton lost to Georgetown in 1989 (1 point, 50–49)
- Western Carolina lost to Purdue in 1996 (2 points, 73–71)
- Fairleigh Dickinson lost to Michigan in 1985 (4 points, 59–55)
Additional low-seed stats
- Villanova in 1985, a No. 8 seed, was the lowest seeded team to win the tournament.
- The lowest-seeded combination in the national championship game is the 2014 pairing of No. 7 seed UConn and No. 8 seed Kentucky. UConn won, to become the second-lowest-seeded team to win the tournament.
- The pairing of No. 8 seed Butler and No. 11 seed VCU in the 2011 National Semifinals game had the lowest seeded combination (No. 8 v. No. 11) to play in a National Semifinals game.
- Penn's 1979 Final Four appearance is also notable as they made it as a No. 9 seed—out of 10 teams in their region—making them the lowest seed to make the Final Four in the pre-64-team era.[53]
- Butler is the only team to make consecutive Final Fours (let alone Championship Games) while not being a No. 1 or No. 2 seed either time (No. 5 in 2010, No. 8 in 2011).
- 1991, 2013, and 2016 were the only years where at least one team of every seed (other than the No. 16s) advanced to the Round of 32.
- Richmond is the only team to win first-round games ranked as a No. 15, No. 14, No. 13, and No. 12 seed.
- 2012 was the only tournament to feature two upsets by No. 15 seeds over No. 2 seeds in the round of 64 (there have been eight all-time).
- 1986, 1995, and 2015 were the only tournaments to feature two upsets by No. 14 seeds over No. 3 seeds in the round of 64.
- 2014 produced the highest total seed differential in an NCAA Tournament, with 111 across all the rounds of play. That is, the aggregate seed difference among the 22 games won by lower-seeded teams (e.g., No. 14 Mercer over No. 3 Duke, No. 8 Kentucky over No. 1 Wichita State) was 111.
- 2013 was the only tournament to have three teams seeded No. 12 or lower in the Sweet Sixteen: No. 12 Oregon, No. 13 La Salle, and No. 15 Florida Gulf Coast.
- 2017, South Carolina entering as a 7th seed in their region, beat Duke a No. 2 seed, Baylor, a No. 3 seed and Florida, a No. 4 seed to reach the Final Four.
- The 2018 South Region was the first regional since seeding began in 1979 in which no top-4 seed advanced to the Sweet Sixteen (No. 5 Kentucky, No. 7 Nevada, No. 9 Kansas State, No. 11 Loyola–Chicago).
- Furthermore, the Elite Eight pairing of No. 9 Kansas State and No. 11 Loyola-Chicago was the lowest-seeded pairing to play in a Regional Final.
- Georgetown is the only team to lose in five consecutive tournament appearances against a team seeded at least five spots lower:
- 2008 (Round of 32): No. 10 Davidson 74, No. 2 Georgetown 70.
- 2010 (Round of 64): No. 14 Ohio 97, No. 3 Georgetown 83.
- 2011 (Round of 64): No. 11 VCU 74, No. 6 Georgetown 56.
- 2012 (Round of 32): No. 11 NC State 66, No. 3 Georgetown 63.
- 2013 (Round of 64): No. 15 Florida Gulf Coast 78, No. 2 Georgetown 68.
Notable point spread upsets
As noted above, despite numerous instances of early-round tournament upsets, only one No. 1 seed has lost in the first round to a No. 16 seed. However, while seeding is one way of measuring the impact of an upset, prior to the implementation of seeding, point spread was the better determinant of an upset, and a loss by a highly favored team remains for many the definition of "upset". As the NCAA forbids any association with gambling, and point spreads vary depending on the bookie taking the bets, these are unofficial.
- Biggest point-spread upsets since expansion to 64 teams in 1985:
- Norfolk State +21.5 over Missouri 86–84 in 2012[54]
- UMBC +20.5 over Virginia 74–54 in 2018[55]
- Santa Clara +20 over Arizona 64–61 in 1993.[54]
- Coppin State +18.5 over South Carolina 78–65 in 1997
- Arkansas–Little Rock +17.5 over Notre Dame 90–83 in 1986[54]
- Hampton +17.5 over Iowa State 58–57 in 2001[54]
- Biggest point-spread upsets in NCAA Championship Game history:
- Connecticut +9.5 over Duke, 77–74, in 1999
- Villanova +9 over Georgetown, 66–64, in 1985
- Kansas +8 over Oklahoma, 83–79, in 1988
- North Carolina State +7.5 over Houston, 54–52 in 1983
- Texas Western +6.5 over Kentucky, 72–65 in 1966
Highly seeded teams
All No. 1 seeds in the Final Four
It has happened only once that all four No. 1 seeds made it to the Final Four:
- 2008 – Kansas (champion), North Carolina, UCLA, Memphis
Final Fours without a No. 1 seed
Thrice (twice since the field expanded to 64 teams) the Final Four has been without a No. 1 seed:
- 1980 – No. 2 Louisville (champion), No. 5 Iowa, No. 6 Purdue, No. 8 UCLA
- 2006 – No. 2 UCLA, No. 3 Florida (champion), No. 4 LSU, No. 11 George Mason
- 2011 – No. 3 Connecticut (champion), No. 4 Kentucky, No. 8 Butler, No. 11 VCU
Since 1985, there have been 4 instances of three No. 1 seeds reaching the Final Four; 13 instances of two No. 1 seeds making it; and 14 instances of just one No. 1 seed reaching the Final Four.
No. 1 seeds in the Championship Game
There have been eight occasions (seven times since the field expanded to 64) that the championship game has been played between two No. 1 seeds:
- 1982 – North Carolina beat Georgetown
- 1993 – North Carolina beat Michigan
- 1999 – Connecticut beat Duke
- 2005 – North Carolina beat Illinois
- 2007 – Florida beat Ohio State
- 2008 – Kansas beat Memphis
- 2015 – Duke beat Wisconsin
- 2017 – North Carolina beat Gonzaga
Since 1985 there have been 18 instances of one No. 1 seed reaching the Championship Game (No. 1 seeds are 13–5 against other seeds in the title game) and 8 instances where no No. 1 seed made it to the title game.
Additional No. 1 seed stats
- In 1997, Arizona achieved a record when it became the only team to beat three No. 1 seeds in a single tournament. Arizona (No. 4 seed) beat Kansas in its own Southeast region, then beat North Carolina in the Final Four and finally Kentucky in the Championship game. The most No. 1 seeds any team can face in the tournament is three (provided that the team itself is not a No. 1 seed, in which case it can only face two No. 1 seeds in the tournament).
- In 2011, the highest seed to advance to the Final Four was No. 3 seed Connecticut, making the 2011 tournament the only time that neither a No. 1 seed nor a No. 2 seed advanced into the final weekend of play. In the same tournament, Butler made history as the first program to make consecutive Final Fours while not being seeded No. 1 or No. 2 in either season.
- There have been 16 teams that have entered the tournament unbeaten. Four of those teams were from UCLA, and all those Bruin teams won each of those tournaments. However, of the other 12 teams entering the tournament unbeaten, just three went on to win the tournament. For details, see table below.
- In 1980, 1981, and 1982, when the tournament was 48 teams, DePaul was seeded No. 1 but was defeated in the first round.
- Theoretically, a No. 1 seed's most difficult six-game path to win the tournament is to defeat a No. 16, a No. 8, a No. 4, a No. 2, a No. 1, and a No. 1 – the highest possible opposing seeds in successive rounds. No No. 1 seed has ever won all six such games, though two teams have won the first five.
- In the 2002 tournament, Maryland reached the final after defeating teams seeded 16/8/4/2/1; they won the tournament after defeating No. 5 Indiana in the final.
- In the 2015 tournament, Wisconsin reached the final after defeating teams seeded 16/8/4/2/1. In the final, they faced No. 1 Duke with a chance to complete the full six-game path. However, Wisconsin lost the final.
Teams No. 1 in national polls
The following teams entered the tournament ranked No. 1 in at least one of the AP, UPI, or USA Today polls and won the tournament:[56]
- 1949: Kentucky (AP)
- 1951: Kentucky (AP/UPI)
- 1953: Indiana (AP/UPI)
- 1955: San Francisco (AP/UPI)
- 1956: San Francisco (AP/UPI)
- 1957: North Carolina (AP/UPI)
- 1964: UCLA (AP/UPI)
- 1967: UCLA (AP/UPI)
- 1969: UCLA (AP/UPI)
- 1971: UCLA (AP/UPI)
- 1972: UCLA (AP/UPI)
- 1973: UCLA (AP/UPI)
- 1974: NC State (AP/UPI)
- 1976: Indiana (AP/UPI)
- 1978: Kentucky (AP/UPI)
- 1982: North Carolina (AP/UPI)
- 1992: Duke (AP/UPI)
- 1994: Arkansas (USA Today)
- 1995: UCLA (AP/USA Today)
- 2001: Duke (AP/USA Today)
- 2012: Kentucky (AP/USA Today)
Performance of undefeated teams
The team's record here refers to their record before the first game of the NCAA tournament.
| Year | Team | Record | Result |
|---|---|---|---|
| 1951 | Columbia | 21–0 | Lost Sweet 16 game to Illinois |
| 1956 | San Francisco | 24–0 | Won the tournament, beat Iowa |
| 1957 | North Carolina | 27–0 | Won the tournament, beat Kansas |
| 1961 | Ohio State | 24–0 | Lost in championship game to Cincinnati |
| 1964 | UCLA | 26–0 | Won the tournament, beat Duke |
| 1967 | UCLA | 26–0 | Won the tournament, beat Dayton |
| 1968 | Houston | 28–0 | Lost in national semifinal game to UCLA |
| 1968 | St. Bonaventure | 22–0 | Lost Sweet 16 game to North Carolina |
| 1971 | Pennsylvania | 26–0 | Lost Elite 8 game to Villanova |
| 1971 | Marquette | 26–0 | Lost Sweet 16 game to Ohio State |
| 1972 | UCLA | 26–0 | Won the tournament, beat Florida State |
| 1973 | UCLA | 26–0 | Won the tournament, beat Memphis State |
| 1975 | Indiana | 29–0 | Lost Elite 8 game to Kentucky |
| 1976 | Indiana | 27–0 | Won the tournament, beat Michigan |
| 1976 | Rutgers | 27–0 | Lost in national semifinal game to Michigan |
| 1979 | Indiana State | 28–0 | Lost in championship game to Michigan State |
| 1991 | UNLV | 30–0 | Lost in national semifinal game to Duke |
| 2014 | Wichita State | 34–0 | Lost in Round of 32 to Kentucky |
| 2015 | Kentucky | 34–0 | Lost in national semifinal game to Wisconsin |
Undefeated teams not in the tournament
The NCAA tournament has undergone dramatic expansion since 1975, and since the tournament was expanded to 48 teams in 1980, no unbeaten teams have failed to qualify. (As, by definition, a team would have to win its conference tournament, and thus secure an automatic bid to the tournament, to be undefeated in a season, the only way a team could finish undefeated and not reach the tournament is if the team is banned from postseason play; as of 2016, no team banned from postseason play has finished undefeated since 1980. Other possibilities for an undefeated team to fail to qualify: the team is independent, or the conference does not yet have an automatic bid.) Before that, there were occasions on which a team achieved perfection in the regular season, yet did not appear in the NCAA tournament.
- During 1939, Long Island University finished the regular season unbeaten but decided to accept instead an invitation to the second NIT (which they won) instead of the first and only NABC tournament (later called the NCAA tournament), as the NIT was more prestigious at the time. It wasn't until the mid-1950s that the NCAA required that its tournament would have "first choice" in determining teams for their field. Before then, many of the more successful teams during the regular season chose to play in the NIT instead of the NCAA tournament.
- During 1940, Seton Hall finished the regular season 19–0, but their record had been built largely against weak teams and thus did not earn them an invitation to the postseason tournament.
- During 1941, Milwaukee State finished the regular season 16–0, but their record had been built largely against weak teams and thus did not earn them an invitation to the postseason tournament.
- During 1944, Army finished the regular season unbeaten. But owing to World War II, the Cadets did not accept an invitation to postseason play.
- During 1954, Kentucky finished 25–0 and were invited to the tournament, but declined the invitation.
- During 1973 the North Carolina State Wolfpack finished the regular season 27–0 and ranked #2 (behind undefeated and eventual tournament champion UCLA) but were barred from participating in the NCAA tournament while on probation for recruiting violations.
- During 1979, the Alcorn State Braves finished the regular season 27–0, but did not receive an invitation to the NCAA Tournament. The Braves accepted a bid to the NIT, where they lost in the second round to eventual NIT champion Indiana.[57]
Champions absent the next year
There have been nine times in which the tournament did not include the reigning champion (the previous year's winner):
- 1978 champion Kentucky went 19–12 in 1979. The Wildcats accepted an invitation to the National Invitation Tournament, losing their first-round game in overtime to Clemson, 68–67.
- Both 1979 champion Michigan State (12–15) and 1979 runner up Indiana State (16–11) failed to qualify for the 1980 NCAA Tournament. Furthermore, neither was invited to the National Invitation Tournament, and Michigan State is the only team to finish the subsequent season with a losing record. Following the 1979 NCAA tournament, Indiana State lost Larry Bird to graduation, and Magic Johnson left Michigan State after his sophomore season to enter the NBA draft.
- 1983 champion North Carolina State went 19–13 in 1984. The Wolfpack accepted an invitation to the National Invitation Tournament, losing their first-round game to Florida State, 74–71 in Reynolds Coliseum.
- 1986 champion Louisville went 18–14 in 1987. The team declined an invitation to the postseason National Invitation Tournament.
- 1988 champion Kansas went 19–12 in 1989. However, the team was ineligible for participation in the 1989 NCAA Tournament due to NCAA sanctions for recruiting violations.
- 2007 (and 2006) champion Florida and 2007 runner up Ohio State both failed to qualify for the NCAA Tournament in 2008. Both accepted invitations to that year's postseason National Invitation Tournament, and both made it to the semifinals. Florida fell to Massachusetts in the semifinals, and Ohio State beat UMass in the NIT Championship Game to win the tournament.
- 2009 champion North Carolina went 20–17 in 2010.[58][59] The Tar Heels accepted an invitation to the National Invitation Tournament, and reached the finals, losing to Dayton.
- 2012 champion Kentucky went 21–11 in 2013 and failed to make that tournament. The Wildcats were invited to the National Invitation Tournament, where they lost to Robert Morris in the first round of the tournament.
- 2014 champion UConn went 20–14 in 2015 and failed to make that tournament. The Huskies were invited to the National Invitation Tournament and lost to Arizona State in the first round.
Coaches
Most national championships
- 10 National Championships
- John Wooden (1964, 1965, 1967, 1968, 1969, 1970, 1971, 1972, 1973, 1975)
- 5 National Championships
- Mike Krzyzewski (1991, 1992, 2001, 2010, 2015)[60]
- 4 National Championships
- Adolph Rupp (1948, 1949, 1951, 1958)
- 3 National Championships
- Jim Calhoun (1999, 2004, 2011)
- Bob Knight (1976, 1981, 1987)
- Roy Williams (2005, 2009, 2017)
- 2 National Championships
- Denny Crum (1980, 1986)
- Billy Donovan (2006, 2007)
- Henry Iba (1945, 1946)
- Ed Jucker (1961, 1962)
- Branch McCracken (1940, 1953)
- Dean Smith (1982, 1993)
- Phil Woolpert (1955, 1956)
- Jay Wright (2016, 2018)
- 1 National Championship
- Phog Allen (1952)
- Tony Bennett (2019)
- Jim Boeheim (2003)
- Larry Brown (1988)
- John Calipari (2012)
- Everett Dean (1942)
- Steve Fisher (1989)
- Bud Foster (1941)
- Joe B. Hall (1978)
- Jim Harrick (1995)
- Don Haskins (1966)
- Jud Heathcote (1979)
- Howard Hobson (1939)
- Nat Holman (1950)
- George Ireland (1963)
- Tom Izzo (2000)
- Doggie Julian (1947)
- Ken Loeffler (1954)
- Rollie Massimino (1985)
- Al McGuire (1977)
- Frank McGuire (1957)
- Pete Newell (1959)
- Kevin Ollie (2014)
- Lute Olson (1997)
- Vadal Peterson (1944)
- Rick Pitino (1996)[lower-alpha 2]
- Nolan Richardson (1994)
- Bill Self (2008)
- Everett Shelton (1943)
- Norm Sloan (1974)
- Tubby Smith (1998)
- Jerry Tarkanian (1990)
- Fred Taylor (1960)
- John Thompson (1984)
- Jim Valvano (1983)
- Gary Williams (2002)
National championships among active coaches
- 5 Mike Krzyzewski (1991, 1992, 2001, 2010, 2015)[60]
- 3 Roy Williams (2005, 2009, 2017)
- 3 Jim Calhoun (1999, 2004, 2011)
- 2 Jay Wright (2016, 2018)
- 1 Tony Bennett (2019)
- 1 Jim Boeheim (2003)
- 1 John Calipari (2012)
- 1 Tom Izzo (2000)
- 1 Bill Self (2008)
- 1 Tubby Smith (1998)
Schools winning a national championship under multiple coaches
- Five coaches
- Kentucky: Adolph Rupp, Joe B. Hall, Rick Pitino, Tubby Smith, and John Calipari
- Three coaches
- Kansas: Phog Allen, Larry Brown, and Bill Self
- North Carolina: Frank McGuire, Dean Smith, and Roy Williams
- Two coaches
- UConn: Jim Calhoun and Kevin Ollie
- Indiana: Branch McCracken and Bob Knight
- Michigan State: Jud Heathcote and Tom Izzo
- North Carolina State: Norm Sloan and Jim Valvano
- UCLA: John Wooden and Jim Harrick
- Villanova: Rollie Massimino and Jay Wright
Most teams from different schools taken to the Final Four
Rick Pitino is the only coach to have officially taken three teams to the Final Four: Providence (1987), Kentucky (1993, 1996, 1997) and Louisville (2005).
- John Calipari has also taken three teams to the Final Four, but has had his runs with UMass and Memphis vacated due to NCAA violations.[61]
There are 12 coaches who have officially coached two schools to the Final Four – Roy Williams, Eddie Sutton, Frank McGuire, Lon Kruger, Hugh Durham, Jack Gardner, Lute Olson, Gene Bartow, Forddy Anderson, Lee Rose, Bob Huggins, and Lou Henson.
- Larry Brown took UCLA to the Final Four in 1980, but it was vacated due to NCAA violations. He also took Kansas in 1986 and 1988.
Point differentials
Point differentials, or margin of victory, can be viewed either by the championship game, or by a team's performance over the whole tournament.
Championship victory margins
- Largest margin of victory in a championship game
30 points, by UNLV in 1990 (103–73, over Duke)
- Overtime games in a championship game
Eight times the championship game has been tied at the end of regulation. On one of those occasions (1957) the game went into double and then triple overtime.
- North Carolina 54, Kansas 53/3OT (1957)
- Utah 42, Dartmouth 40 (1944)
- Cincinnati 65, Ohio St. 60 (1961)
- Loyola 60, Cincinnati 58 (1963)
- Michigan 80, Seton Hall 79 (1989)
- Arizona 84, Kentucky 79 (1997)
- Kansas 75, Memphis 68 (2008)
- Virginia 85, Texas Tech 77 (2019)
- Smallest margin of victory in a championship game
1 point, on six occasions
- Indiana 69, Kansas 68 (1953)
- North Carolina 54, Kansas 53/3OT (1957)
- California 71, West Virginia 70 (1959)
- North Carolina 63, Georgetown 62 (1982)
- Indiana 74, Syracuse 73 (1987)
- Michigan 80, Seton Hall 79/OT (1989)
Accumulated victory margins
- Largest point differential accumulated over the entire tournament by championship teams
Teams that played 6 games
- +129 Kentucky 1996
- +124 Villanova 2016
- +121 North Carolina 2009
- +112 UNLV 1990
- +106 Villanova 2018
Teams that played 5 games
- +115 Loyola of Chicago 1963
- +113 Indiana 1981
- +104 Michigan State 1979
- +69 San Francisco 1955
- +66 Indiana 1976
Teams that played 4 games
- +95 UCLA 1967
- +85 UCLA 1968
- +78 Ohio State 1960
- +76 UCLA 1969
- +72 UCLA 1970
- +72 UCLA 1972
Teams that played 3 games
- +56 Oklahoma A&M 1945
- +52 Kentucky 1949
- +51 Indiana 1940
- +47 Kentucky 1948
- +46 Oregon 1939
- Teams winning the championship and obtaining a margin of 10 points in every game of the tournament
Achieved 13 times by 10 schools
Seed pairing results
Since the inception of the 64-team tournament in 1985, each seed-pairing has played 140 games in the Round of 64, with the following results:
Round of 64 results
- The No. 1 seed is 139–1 against the No. 16 seed (.993)
- The No. 2 seed is 132–8 against the No. 15 seed (.943)
- The No. 3 seed is 119–21 against the No. 14 seed (.850)
- The No. 4 seed is 111–29 against the No. 13 seed (.793)
- The No. 5 seed is 90–50 against the No. 12 seed (.643)
- The No. 6 seed is 88–52 against the No. 11 seed (.629)
- The No. 7 seed is 85–55 against the No. 10 seed (.607)
- The No. 8 seed is 68–72 against the No. 9 seed (.486)
Round of 32 results
- In the 1/16 vs. 8/9 bracket:
| vs. No. 8 | vs. No. 9 | Total | |
|---|---|---|---|
| No. 1 | 55–13 (.809) | 65–6 (.915) | 120–19 (.863) |
| No. 16 | – | 0–1 (.000) | 0–1 (.000) |
| Total | 13–55 (.191) | 7–65 (.097) |
- In the 2/15 vs. 7/10 bracket:
| vs. No. 7 | vs. No. 10 | Total | |
|---|---|---|---|
| No. 2 | 57–25 (.695) | 32–18 (.640) | 89–43 (.674) |
| No. 15 | 1–2 (.333) | 0–5 (.000) | 1–7 (.125) |
| Total | 27–58 (.301) | 23–32 (.418) |
- In the 3/14 vs. 6/11 bracket:
| vs. No. 6 | vs. No. 11 | Total | |
|---|---|---|---|
| No. 3 | 44–28 (.611) | 30–17 (.638) | 74–45 (.622) |
| No. 14 | 2–14 (.125) | 0–5 (.000) | 2–19 (.095) |
| Total | 42–46 (.477) | 22–30 (.423) |
- In the 4/13 vs. 5/12 bracket:
| vs. No. 5 | vs. No. 12 | Total | |
|---|---|---|---|
| No. 4 | 40–33 (.548) | 26–12 (.684) | 66–45 (.595) |
| No. 13 | 3–14 (.176) | 3–9 (.250) | 6–23 (.207) |
| Total | 47–43 (.522) | 21–29 (.420) |
Round of 16 results
- In the 1/8/9/16 vs. 4/5/12/13 bracket:
| vs. No. 4 | vs. No. 5 | vs. No. 12 | vs. No. 13 | Total | |
|---|---|---|---|---|---|
| No. 1 | 39–15 (.722) | 34–8 (.810) | 20–0 (1.000) | 4–0 (1.000) | 97–23 (.808) |
| No. 8 | 5–4 (.556) | 2–0 (1.000) | 0–1 (.000) | 1–0 (1.000) | 8–5 (.615) |
| No. 9 | 1–2 (.333) | 2–1 (.667) | – | 1–0 (1.000) | 4–3 (.571) |
| No. 16 | – | – | – | – | – |
| Total | 21–45 (.318) | 9–38 (.191) | 1–20 (.048) | 0–6 (.000) |
- In the 2/7/10/15 vs. 3/6/11/14 bracket:
| vs. No. 3 | vs. No. 6 | vs. No. 11 | vs. No. 14 | Total | |
|---|---|---|---|---|---|
| No. 2 | 28–17 (.622) | 23–6 (.793) | 13–2 (.867) | – | 64–25 (.719) |
| No. 7 | 6–9 (.400) | 3–4 (.429) | 0–4 (.000) | 1–0 (1.000) | 10–17 (.370) |
| No. 10 | 4–9 (.308) | 2–4 (.333) | 1–2 (.333) | 1–0 (1.000) | 8–15 (.348) |
| No. 15 | 0–1 (.000) | – | – | – | 0–1 (.000) |
| Total | 36–38 (.486) | 14–28 (.333) | 8–14 (.364) | 0–2 (.000) |
Regional finals results
| vs. No. 2 | vs. No. 3 | vs. No. 6 | vs. No. 7 | vs. No. 10 | vs. No. 11 | vs. No. 14 | vs. No. 15 | Total | |
|---|---|---|---|---|---|---|---|---|---|
| No. 1 | 23–24 (.489) | 15–10 (.600) | 7–2 (.778) | 4–0 (1.000) | 4–1 (.800) | 4–3 (.571) | – | – | 57–40 (.588) |
| No. 4 | 4–2 (.667) | 3–2 (.600) | 2–1 (.667) | 2–3 (.400) | 2–0 (1.000) | – | – | – | 13–8 (.619) |
| No. 5 | 4–0 (1.000) | 1–2 (.333) | 1–0 (1.000) | – | 1–0 (1.000) | – | – | – | 7–2 (.778) |
| No. 8 | 3–2 (.600) | 0–1 (.000) | 1–0 (1.000) | 1–0 (1.000) | – | – | – | – | 5–3 (.625) |
| No. 9 | 1–0 (1.000) | 0–2 (.000) | – | – | – | 0–1 (.000) | – | – | 1–3 (.250) |
| No. 12 | 0–1 (.000) | – | – | – | – | – | – | – | 0–1 (.000) |
| No. 13 | – | – | – | – | – | – | – | – | – |
| No. 16 | – | – | – | – | – | – | – | – | – |
| Total | 29–35 (.453) | 17–19 (.472) | 3–11 (.214) | 3–7 (.300) | 1–7 (.125) | 4–4 (.500) | – | – |
Host cities
This table lists all the cities that have hosted or will host the Final Four, as well as the venues in which the Final Four was or will be played. For additional information about a particular year's tournament, click on the year to go directly to that year's NCAA Men's Basketball Tournament or go to the main article.
| Year | City | Venue | Champion |
|---|---|---|---|
| 1939 | Evanston, Illinois | Patten Gymnasium | Oregon |
| 1940 | Kansas City | Municipal Auditorium | Indiana |
| 1941 | Wisconsin | ||
| 1942 | Stanford | ||
| 1943 | New York City | Madison Square Garden | Wyoming |
| 1944 | Utah | ||
| 1945 | Oklahoma A&M | ||
| 1946 | |||
| 1947 | Holy Cross | ||
| 1948 | Kentucky | ||
| 1949 | Seattle | Hec Edmundson Pavilion | |
| 1950 | New York City | Madison Square Garden | CCNY |
| 1951 | Minneapolis | Williams Arena | Kentucky |
| 1952 | Seattle | Hec Edmundson Pavilion | Kansas |
| 1953 | Kansas City | Municipal Auditorium | Indiana |
| 1954 | La Salle | ||
| 1955 | San Francisco | ||
| 1956 | Evanston, Illinois | McGaw Hall | |
| 1957 | Kansas City | Municipal Auditorium | North Carolina |
| 1958 | Louisville | Freedom Hall | Kentucky |
| 1959 | California | ||
| 1960 | Daly City, California | Cow Palace | Ohio State |
| 1961 | Kansas City | Municipal Auditorium | Cincinnati |
| 1962 | Louisville | Freedom Hall | |
| 1963 | Loyola (Chicago) | ||
| 1964 | Kansas City | Municipal Auditorium | UCLA |
| 1965 | Portland | Memorial Coliseum | |
| 1966 | College Park, Maryland | Cole Field House | Texas Western |
| 1967 | Louisville | Freedom Hall | UCLA |
| 1968 | Los Angeles | Memorial Sports Arena | |
| 1969 | Louisville | Freedom Hall | |
| 1970 | College Park, Maryland | Cole Field House | |
| 1971 | Houston | Astrodome | |
| 1972 | Los Angeles | Memorial Sports Arena | |
| 1973 | St. Louis | St. Louis Arena | |
| 1974 | Greensboro | Greensboro Coliseum | NC State |
| 1975 | San Diego | San Diego Sports Arena | UCLA |
| 1976 | Philadelphia | The Spectrum | Indiana |
| 1977 | Atlanta | The Omni | Marquette |
| 1978 | St. Louis | The Checkerdome | Kentucky |
| 1979 | Salt Lake City | Special Events Center | Michigan State |
| 1980 | Indianapolis | Market Square Arena | Louisville |
| 1981 | Philadelphia | The Spectrum | Indiana |
| 1982 | New Orleans | Louisiana Superdome | North Carolina |
| 1983 | Albuquerque | University Arena | NC State |
| 1984 | Seattle | Kingdome | Georgetown |
| 1985 | Lexington | Rupp Arena | Villanova |
| 1986 | Dallas | Reunion Arena | Louisville |
| 1987 | New Orleans | Louisiana Superdome | Indiana |
| 1988 | Kansas City | Kemper Arena | Kansas |
| 1989 | Seattle | Kingdome | Michigan |
| 1990 | Denver | McNichols Sports Arena | UNLV |
| 1991 | Indianapolis | Hoosier Dome | Duke |
| 1992 | Minneapolis | HHH Metrodome | |
| 1993 | New Orleans | Louisiana Superdome | North Carolina |
| 1994 | Charlotte | Charlotte Coliseum | Arkansas |
| 1995 | Seattle | Kingdome | UCLA |
| 1996 | East Rutherford | Continental Airlines Arena | Kentucky |
| 1997 | Indianapolis | RCA Dome | Arizona |
| 1998 | San Antonio | Alamodome | Kentucky |
| 1999 | St. Petersburg | Tropicana Field | Connecticut |
| 2000 | Indianapolis | RCA Dome | Michigan State |
| 2001 | Minneapolis | HHH Metrodome | Duke |
| 2002 | Atlanta | Georgia Dome | Maryland |
| 2003 | New Orleans | Louisiana Superdome | Syracuse |
| 2004 | San Antonio | Alamodome | Connecticut |
| 2005 | St. Louis | Edward Jones Dome | North Carolina |
| 2006 | Indianapolis | RCA Dome | Florida |
| 2007 | Atlanta | Georgia Dome | |
| 2008 | San Antonio | Alamodome | Kansas |
| 2009 | Detroit | Ford Field | North Carolina |
| 2010 | Indianapolis | Lucas Oil Stadium | Duke |
| 2011 | Houston | Reliant Stadium | Connecticut |
| 2012 | New Orleans | Mercedes-Benz Superdome | Kentucky |
| 2013 | Atlanta | Georgia Dome | Louisville[lower-alpha 3] |
| 2014 | Dallas | AT&T Stadium | Connecticut |
| 2015 | Indianapolis | Lucas Oil Stadium | Duke |
| 2016 | Houston | NRG Stadium | Villanova |
| 2017 | Phoenix | University of Phoenix Stadium | North Carolina |
| 2018 | San Antonio | Alamodome | Villanova |
| 2019 | Minneapolis | U.S. Bank Stadium | Virginia |
| 2020 | Atlanta | Mercedes-Benz Stadium | Not held because of the COVID-19 Pandemic |
| 2021 | Indianapolis | Lucas Oil Stadium | |
| 2022 | New Orleans | Mercedes-Benz Superdome | |
| 2023 | Houston | NRG Stadium | |
| 2024 | Glendale, Arizona | State Farm Stadium | |
| 2025 | San Antonio | Alamodome | |
| 2026 | Indianapolis | Lucas Oil Stadium |
Popular culture
Bracketology and pools
There are pools or private gambling-related contests as to who can predict the tournament most correctly. The filling out of a tournament bracket has been referred to as a "national pastime." Filling out a tournament bracket with predictions is called the practice of "bracketology" and sports programming during the tournament is rife with commentators comparing the accuracy of their predictions. On The Dan Patrick Show, a wide variety of celebrities from various fields (such as Darius Rucker, Charlie Sheen, Neil Patrick Harris, Ellen DeGeneres, Dave Grohl, and Brooklyn Decker) have posted full brackets with predictions. Former President Barack Obama's bracket was posted on the White House website.
There are many tournament prediction scoring systems. Most award points for correctly picking the winning team in a particular match up, with increasingly more points being given for correctly predicting later round winners. Some provide bonus points for correctly predicting upsets, the amount of the bonus varying based on the degree of upset. Some just provide points for wins by correctly picked teams in the brackets.
There are 2^63 or 9.2 quintillion possibilities for the possible winners in a 64-team NCAA bracket, making the odds of randomly picking a perfect bracket (i.e. without weighting for seed number) 9.2 quintillion to 1.[62] With the expansion of the tournament field to 68 teams in 2011, there are now 2^67 or 147.57 quintillion possibilities if one includes the first four opening round games.
There are numerous awards and prizes given by companies for anyone who can make the perfect bracket. One of the largest was done by a partnership between Quicken Loans and Berkshire Hathaway, which was backed by Warren Buffett, with a $1 billion prize to any person(s) who could correctly predict the outcome of the 2014 tournament. No one was able to complete the challenge and win the $1 billion prize.[63]
Tournament associated terms
As indicated below, none of these phrases are exclusively used in regard to the NCAA tournament. Nonetheless, they are associated widely with the tournament, sometimes for legal reasons, sometimes just because it's become part of the American sports vernacular.
March Madness
March Madness is a popular on-ending basketball tournaments played in March. March Madness is also a registered trademark currently owned exclusively by the NCAA.
H. V. Porter, an official with the Illinois High School Association (and later a member of the Basketball Hall of Fame), was the first person to use March Madness to describe a basketball tournament. Porter published an essay named March Madness during 1939, and during 1942, he used the phrase in a poem, Basketball Ides of March. Through the years the use of March Madness was increased, especially in Illinois, Indiana, and other parts of the Midwest. During this period the term was used almost exclusively in reference to state high school tournaments. During 1977, Jim Enright published a book about the Illinois tournament entitled March Madness.[64]
Fans began associating the term with the NCAA tournament during the early 1980s. Evidence suggests that CBS sportscaster Brent Musburger, who had worked for many years in Chicago before joining CBS, popularized the term during the annual tournament broadcasts. The NCAA has credited Bob Walsh of the Seattle Organizing Committee for starting the March Madness celebration in 1984.[65]
Only during the 1990s did either the IHSA or the NCAA think about trademarking the term, and by that time a small television production company named Intersport had already trademarked it. IHSA eventually bought the trademark rights from Intersport, and then went to court to establish its primacy. IHSA sued GTE Vantage, an NCAA licensee that used the name March Madness for a computer game based on the college tournament. During 1996, in a historic ruling, Illinois High School Association v. GTE Vantage, Inc., the United States Court of Appeals for the Seventh Circuit created the concept of a "dual-use trademark", granting both the IHSA and NCAA the right to trademark the term for their own purposes.
After the ruling, the NCAA and IHSA joined forces and created the March Madness Athletic Association to coordinate the licensing of the trademark and investigate possible trademark infringement. One such case involved a company that had obtained the internet domain name marchmadness.com and was using it to post information about the NCAA tournament. During 2003, by March Madness Athletic Association v. Netfire, Inc., the United States Court of Appeals for the Fifth Circuit decided that March Madness was not a generic term, and ordered Netfire to relinquish the domain name to the NCAA.[66]
Later during the 2000s, the IHSA relinquished its ownership share in the trademark, although it retained the right to use the term in association with high school championships. During October 2010, the NCAA reached a settlement with Intersport, paying $17.2 million for the latter company's license to use the trademark.[67]
Sweet Sixteen
This is a popular term for the regional semifinal round of the tournament, consisting of the final 16 teams. As in the case of "March Madness", this was first used by a high school federation—in this case, the Kentucky High School Athletic Association (KHSAA), which has used the term for decades to describe its own season-ending tournaments. It officially registered the trademark in 1988. Unlike the situation with "March Madness", the KHSAA has retained sole ownership of the "Sweet Sixteen" trademark; it licenses the term to the NCAA for use in collegiate tournaments.[68]
Final Four
The term Final Four refers to the last four teams remaining in the playoff tournament. These are the champions of the tournament's four regional brackets, and are the only teams remaining on the tournament's final weekend. (While the term "Final Four" was not used during the early decades of the tournament, the term has been applied retroactively to include the last four teams in tournaments from earlier years, even when only two brackets existed.)
Some claim that the phrase Final Four was first used to describe the final games of Indiana's annual high school basketball tournament. But the NCAA, which has a trademark on the term, says Final Four was originated by a Plain Dealer sportswriter, Ed Chay, in a 1975 article that appeared in the Official Collegiate Basketball Guide.[69] The article stated that Marquette University "was one of the final four" of the 1974 tournament. The NCAA started capitalizing the term during 1978 and converting it to a trademark several years later.
During recent years, the term Final Four has been used for other sports besides basketball. Tournaments which use Final Four include the EuroLeague in basketball, national basketball competitions in several European countries, and the now-defunct European Hockey League. Together with the name Final Four, these tournaments have adopted an NCAA-style format in which the four surviving teams compete in a single-elimination tournament held in one place, typically, during one weekend. The derivative term "Frozen Four" is used by the NCAA to refer to the final rounds of the Division I men's and women's ice hockey tournaments. Until 1999, it was just a popular nickname for the last two rounds of the hockey tournament; officially, it was also known as the Final Four.
Cinderella team
Although there is not any official definition of what constitutes a Cinderella team, there does seem to be a consensus that such teams represent small schools, are usually low-seeded in the tournament, and achieves at least one unexpected win in the tournament. A recent example of this is Florida Gulf Coast University, a relatively new school that held its first classes in 1997 and became Division I postseason eligible in 2011. They made their first appearance in the 2013 tournament, winning two games to become the first #15 seed to advance to the Sweet Sixteen. The term was popularized as a result of City College of New York's successful run in the 1950 tournament.[70]
Notes
- In a 2019 story on the rise of Murray State point guard Ja Morant, noted sportswriter Pat Forde argued that as early as 2006, Gonzaga was no longer a mid-major program. Forde stated that Morant could be the first "true mid-major" player to be selected in the top five of the NBA draft since 1998, specifically saying that 2006 third pick Adam Morrison was from "decided non-mid-major Gonzaga."[16]
- Under Pitino, Louisville won the title in 2013, but the NCAA vacated the 2013 title in February 2018 as a result of a 2015 sex scandal.
References
- "Key Dates in NABC History". National Association of Basketball Coaches. Retrieved February 27, 2017.
- Gregoire, Mike (Jan 20, 2020). "March Madness for the Corporate World". USA Today. Retrieved Jan 20, 2020.
- Petrecca, Laura (March 15, 2012). "March Madness in the Office: Work Come in Second". USA Today. Retrieved July 21, 2013.
- Trotter, Ryan (March 18, 2013). "Geeks Can Win March Madness Pools". Retrieved March 10, 2014.
- Boudway, Ira (March 18, 2013). "How to Win Your March Madness Pool". Business Week. Retrieved July 21, 2013.
- "TV coverage history of the NCAA Tournament (1969–present)". Classic Sports TV and Media. 18 March 2013. Retrieved 20 March 2013.
- "How much money does march madness make". 24/7 Wall St. Paul Ausick. 18 March 2019. Retrieved 18 March 2019.
- Shear, Michael D. (March 19, 2011). "Obama's N.C.A.A. Bracket Is One of the Best". The New York Times. Retrieved March 19, 2011.
- https://www.usatoday.com/story/sports/ncaab/2020/03/12/ncaa-tournament-canceled-amid-coronavirus-concerns-march-madness/5030185002/
- "The Ivy League Adds Men's, Women's Basketball Tournaments Beginning in 2017" (Press release). Ivy League. March 10, 2016. Archived from the original on March 11, 2016. Retrieved March 10, 2016.
- "NCAA.com – The Official Website of NCAA Championships - NCAA.com". www.ncaa.com. Retrieved 9 April 2019.
- "NCAA DIVISION I MEN'S BASKETBALL CHAMPIONSHIP – PRINCIPLES AND PROCEDURES FOR ESTABLISHING THE BRACKET" (PDF). NCAA. March 28, 2011. Retrieved March 28, 2011.
- "Tournament History". NCAA. Retrieved 2009-08-10.
- "NCAA OK with Dayton Flyers playing in First Four at home". ESPN.com. February 27, 2014. Retrieved February 27, 2015.
- Parrott, Joshua (November 13, 2016). "College Basketball Question: What is a Mid-Major?". Hero College Sports News. Retrieved 18 March 2017.
- Forde, Pat (January 29, 2019). "How a hungry coach led to the discovery of viral college sensation Ja Morant". Yahoo Sports. Retrieved January 30, 2019.
- Staff, KOIN 6 News (2017-03-28). "Can Ducks echo The Tall Firs after 78 years?". KOIN 6. Retrieved 2017-03-28.
- Katz, Andy (September 7, 2012). "Talks of move-in early stages". ESPN.com. Retrieved September 27, 2012.
- "2010 All-Star Game recap". National Basketball Association. 2011-12-05. Retrieved 2012-11-03.
- Katz, Andy (June 12, 2013). "3-point shot: UConn gets APR on track". ESPN.com. College Basketball Nation Blog. Retrieved June 12, 2013.
- Norlander, Matt (June 12, 2013). "Report: NCAA ditching domes prior to Final Four". CBSSports.com. Eye on College Basketball. Retrieved June 12, 2013.
- "Metro Phoenix lands 2017 NCAA Final Four". azcentral.com. November 14, 2014. Retrieved December 30, 2015.
- McPhee, John (1999). A Sense of Where You Are: Bill Bradley at Princeton. Farrar, Straus and Giroux, New York. pp. 114–115. ISBN 0374526893.
- Fraley, Oscar (March 5, 1951). "Scandal Brings More Prestige to NCAA". The Times-News. Hendersonville, North Carolina. Retrieved March 21, 2013.
- NCAA reveals format of new 68-team tournament – ESPN. Sports.espn.go.com (2010-07-13). Retrieved on 2013-08-17.
- Leger, Justin (November 17, 2014). "NCAA To Rename 'Rounds of 64 and 32' To 'First And Second Rounds' In 2016". NESN. Retrieved December 15, 2014.
- "Colonial Life Arena History". Retrieved March 16, 2014.
- "NCAA lifts ban on holding championships in South Carolina - NCAA.com". www.ncaa.com. Retrieved 9 April 2019.
- "NCAA moving tournament games from North Carolina starting this December". Outsports (SB Nation). Vox Media. Retrieved 13 September 2016.
- Stack, Liam (12 September 2016). "N.C.A.A. Moves Championship Events From North Carolina, Citing Anti-Gay Laws". The New York Times. Retrieved 13 September 2016.
- "NCAA picks Greenville, S.C., as replacement site for Greensboro for 2017 tournament". NCAA BB (CBS Sports). CBS Broadcasting Inc. Retrieved 20 November 2016.
- Gluskin, Michael (March 23, 2005). "The tournament trim". USA Today.
- O'Neil, Dana (April 9, 2013). "Louisville's song finishes in glory". ESPN.com. Retrieved April 9, 2013.
And at one end of the court, there was Kevin Ware on his crutches, the net lowered to accommodate him and his crutches, making the final snip on the only nets Louisville has cut all season.
- "Why do NCAA teams cut down the nets?". CNN. April 5, 2011.
- NCAA Men's Basketball Trophy Visits UT Medical Center, University of Tennessee press release, January 15, 2007
- NABC Basic Info Archived 2009-02-22 at the Wayback Machine
- "Does March Madness Lead to Irrational Exuberance in the NBA Draft?". JournalistsResource.org, retrieved April 13, 2012
- Ichniowski, Casey; Preston, Anne E. (2012). "Does March Madness Lead to Irrational Exuberance in the NBA Draft? High-Value Employee Selection Decisions and Decision-Making Bias". National Bureau of Economic Research.
- "CBS Sports, Turner Broadcasting, NCAA Reach 14-Year Agreement" (Press release). National Collegiate Athletic Association. April 22, 2010. Archived from the original on 2013-11-09. Retrieved January 12, 2011.
- DeCourcy, Mike (May 7, 2013). "Putting Final Four games on cable saved college hoops from 96-team mess". Sporting News. Retrieved May 13, 2013.
- "CBS, Turner win TV rights to tourney". ESPN. Retrieved 22 April 2010.
- "NCAA, TV talk about bigger men's tourney".
- "NCAA 2006–07 Revenue Distribution Plan". NCAA. 2007. Archived from the original on 2007-03-15. Retrieved 2007-03-12.
- "Distribution of Basketball-Related Funds According to Number of Units by Conference, 2001–2006". NCAA. 2007. Archived from the original on 2007-03-05. Retrieved 2007-03-12.
- Romano, Alison (22 February 2002). "ESPN gets jump on NCAA basketball rights". Broadcasting & Cable. Retrieved 30 June 2019.
- "Yahoo unveils Platinum paid service". CNET News.com. Retrieved 2007-03-17.
- "COLLEGE SPORTS OFFICIAL ATHLETIC SITE – Men's Basketball". www.cstv.com. Retrieved 9 April 2019.
- "Mercury News – San Diego Hotels Review". www.hotelsinacapulco.net. Retrieved 9 April 2019.
- "WRAL Digital Airs Entire NCAA Basketball Tournament – Capitol Broadcasting Company". Retrieved 9 April 2019.
- Dowbiggin, Bruce (February 24, 2011). "TSN catches March Madness". Globe and Mail. Toronto. Archived from the original on March 3, 2011. Retrieved March 14, 2011.
- chappelll (2011-03-10). "ESPN Europe » ESPN America Tipping Off Exclusive Coverage of NCAA® March Madness®". Espnmediazone3.com. Archived from the original on 2011-09-09. Retrieved 2014-03-01.
- "Dick Vitale, finally, to call NCAA Final Four action". USA Today. Retrieved 24 September 2014.
- "NCAA Final Four Tournament Seeds". Retrieved 30 March 2011.
- Kraemer, Mackenzie; Nelson, Rob (March 16, 2018). "Biggest NCAA tournament upsets of the 64-team era". ESPN.com. Retrieved March 16, 2018.
- "Summary: UMBC vs. Virginia". ESPN.com. March 16, 2018. Retrieved March 17, 2018.
- "Final Four Record Book" (PDF). Retrieved 9 April 2019.
- MacMullan, Jackie (March 7, 2004). "Undefeated and unnoticed". The Boston Globe.
- "2009–2010 North Carolina Tar Heels Men's Basketball". Goheels.com. Archived from the original (PDF) on 2013-01-31. Retrieved 2013-03-19.
- "2009–2010 North Carolina Tar Heels Men's Basketball" (PDF). ESPN.com. Retrieved 2013-03-19.
- Garcia, Marlen (March 24, 2011). "Duke's Mike Krzyzewski looks golden in chase for fifth title". USA Today.
- Garcia, Marlen. (2009-08-24) Two vacated Final Four runs put on stain Calipari's career – USATODAY.com. Usatoday30.usatoday.com. Retrieved on 2013-08-17.
- Ask Dr. Math, The Math Forum @ Drexel; March 14, 2001; accessed March 7, 2010
- Ogul, David. "Perfect NCAA Bracket Could Win You $1B Thanks to Warren Buffett". Moneynews.com. Retrieved 2014-01-22.
- James Enright: Shaping the Game From Inside and Out Archived 2011-05-01 at the Wayback Machine. Nbra.net (2006-06-01). Retrieved on 2013-08-17.
- Quote from Jim Host, former Radio and Television and Marketing Director, NCAA ISBN 1-883697-67-0 Page 103
- Baker Botts L.L.P. | Newsroom | Resources | The Trademark "March Madness" Withstands a Genericness Attack Archived 2011-03-17 at the Wayback Machine. Bakerbotts.com. Retrieved on 2013-08-17.
- Weiberg, Steve (May 10, 2011). "NCAA paid $17M to protect 'March Madness' term". USA Today. Retrieved May 13, 2011.
- Garmon, Jay (April 6, 2004). "Geek Trivia: Basket cases". TechRepublic.com. Retrieved March 27, 2013.
- "NCAA March Madness Directory Sportslynx.com/march-madness.html". sportslynx.com. Archived from the original on February 24, 2013. Retrieved March 1, 2013.
- ESPN College Basketball Encyclopedia: The Complete History of the Men's Game – Google Boeken. Books.google.com. Retrieved on 2013-08-17.
| NCAA |
| |
|---|---|---|
| Division I |
| |
| Division II |
| |
| Division III |
| |
| Single-division sports and championships |
| |
Events listed in italics have been discontinued. | ||