La Niña
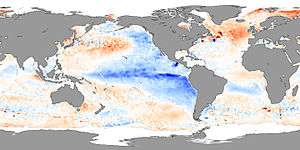
La Niña (/lɑːˈniːnjə/, Spanish pronunciation: [la ˈniɲa]) is a coupled ocean-atmosphere phenomenon that is the colder counterpart of El Niño, as part of the broader El Niño–Southern Oscillation climate pattern. The name La Niña originates from Spanish, meaning "the little girl", analogous to El Niño meaning "the little boy". It has also in the past been called anti-El Niño,[1] and El Viejo (meaning "the old man").[2] During a period of La Niña, the sea surface temperature across the equatorial Eastern Central Pacific Ocean will be lower than normal by 3 to 5 °C (5.4 to 9 °F). An appearance of La Niña persists for at least five months. It has extensive effects on the weather across the globe, particularly in North America, even affecting the Atlantic and Pacific hurricane seasons, in which more tropical cyclones in the Atlantic basin due to low wind shear and warmer sea surface temperatures, while reducing tropical cyclogenesis in the Pacific Ocean during a La Niña.
Definition
La Niña is the positive and cold phase of the El Niño–Southern Oscillation, and is associated with cooler-than-average sea surface temperatures in the central and eastern tropical Pacific Ocean.[3] However, each country and island nation has a different threshold for what constitutes a La Niña event, which is tailored to their specific interests.[4] For example, the Australian Bureau of Meteorology looks at the trade winds, SOI, weather models and sea surface temperatures in the Niño 3 and 3.4 regions before declaring that a La Niña event has started.[5] However, the Japan Meteorological Agency declares that a La Niña event has started when the average five-month sea surface temperature deviation for the NINO.3 region is more than 0.5 °C (0.90 °F) cooler for six consecutive months or longer.[6]
Occurrences

A timeline of all La Niña episodes between 1900 and 2019.[7][8]
There was a relatively strong La Niña episode during 1988–1989. La Niña also formed in late 1983,[9] in 1995, and a protracted La Niña event that lasted from mid-1998 through early 2001. This was followed by a neutral period between 2001 and 2002. The La Niña which developed in mid-2007, and lasted until almost 2009, was a moderate one. The strength of La Niña made the 2008 Atlantic hurricane season one of the five most active since 1944; sixteen named storms had winds of at least 39 miles per hour (63 km/h), eight of which became 74-mile-per-hour (119 km/h) or greater hurricanes.[10]
A new La Niña episode developed quite quickly in the eastern and central tropical Pacific in mid-2010,[11] and lasted until early 2011.[12] It intensified again in mid-2011 and lasted until early 2012.[13] This La Niña, combined with record-high ocean temperatures in the north-eastern Indian Ocean, was a large factor in the 2010–11 Queensland floods,[14] and the quartet of recent heavy snowstorms in North America starting with the December 2010 North American blizzard. The same La Niña event was also a likely cause of a series of tornadoes of above-average severity that struck the Midwestern and Southern United States in the spring of 2011, and drought conditions in the South Central states including Texas, Oklahoma and Arkansas.[15] Meanwhile, a series of major storms caused extensive flooding in California in December 2010, with seven consecutive days of non-stop rainfall, leading to one of the wettest Decembers in over 120 years of records. This is in contrast to the drier-than-normal conditions typically associated with La Niña in California, especially in the south.[16]
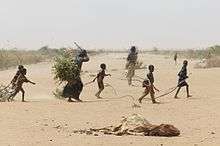
In 2011, on a global scale, La Niña events helped keep the average global temperature below recent trends. As a result, 2011 tied with 1997 for the eleventh-warmest year on record. It was the second-coolest year of the 21st century to date, and tied with the second-warmest year of the 20th century. A relatively strong phase of La Niña opened the year, dissipated in the spring before re-emerging in October and lasted through the end of the year. When compared to previous La Niña years, the 2011 global surface temperature was the warmest observed. The 2011 globally-averaged precipitation over land was the second-wettest year on record, behind 2010. Precipitation varied greatly across the globe. This La Niña contributed to severe drought in East Africa and to Australia's third-wettest year in its 112-year period of records.[17]
La Niñas occurred in 1904, 1908, 1910, 1916, 1924, 1928, 1938, 1949–51,[18] 1954–56, 1964, 1970–72, 1973–76, 1983–85,[9] 1988–89, 1995–96, 1998–2001, 2005–06, 2007–08, 2008–09, 2010–12, 2016, and 2017–18.[11][19][20]
Impacts on the global climate
La Niña impacts the global climate and disrupts normal weather patterns, which as a result can lead to intense storms in some places and droughts in others.[21]
Regional impacts
Observations of La Niña events since 1950, show that impacts associated with La Niña events depend on what season it is.[22] However, while certain events and impacts are expected to occur during events, it is not certain or guaranteed that they will occur.[22]
Africa
La Niña results in wetter-than-normal conditions in Southern Africa from December to February, and drier-than-normal conditions over equatorial East Africa over the same period.[24]
Asia
During La Niña years, the formation of tropical cyclones, along with the subtropical ridge position, shifts westward across the western Pacific Ocean, which increases the landfall threat in China.[25] In March 2008, La Niña caused a drop in sea surface temperatures over Southeast Asia by 2 °C (36 °F). It also caused heavy rains over Malaysia, the Philippines, and Indonesia.[26]
North America
La Niña causes mostly the opposite effects of El Niño, above-average precipitation across the northern Midwest, the northern Rockies, Northern California, and the Pacific Northwest's southern and eastern regions. Meanwhile, precipitation in the southwestern and southeastern states, as well as Southern California, is below average.[27] This also allows for the development of many stronger-than-average hurricanes in the Atlantic and fewer in the Pacific.
The synoptic condition for Tehuantepecer winds is associated with high-pressure system forming in Sierra Madre of Mexico in the wake of an advancing cold front, which causes winds to accelerate through the Isthmus of Tehuantepec. Tehuantepecers primarily occur during the cold season months for the region in the wake of cold fronts, between October and February, with a summer maximum in July caused by the westward extension of the Azores-Bermuda high pressure system. Wind magnitude is weaker during La Niña years than El Niño years, due to the less frequent cold frontal incursions during La Niña winters,[28] with its effects can last from a few hours to six days.[29] Between 1942 and 1957, La Niña had an impact that caused isotope changes in the plants of Baja California.[30]
In Canada, La Niña will, in general, cause a cooler, snowier winter, such as the near-record-breaking amounts of snow recorded in La Niña winter of 2007/2008 in Eastern Canada.[31][32]
South America
During a time of La Niña, drought plagues the coastal regions of Peru and Chile.[33] From December to February, northern Brazil is wetter than normal.[33] La Niña causes higher than normal rainfall in the central Andes, which in turn causes catastrophic flooding on the Llanos de Mojos of Beni Department, Bolivia. Such flooding is documented from 1853, 1865, 1872, 1873, 1886, 1895, 1896, 1907, 1921, 1928, 1929 and 1931.[34]
Diversity
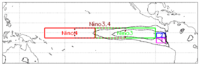
The traditional La Niña, also called Eastern Pacific (EP) La Niña,[35] involves temperature anomalies in the Eastern Pacific. However, in the last two decades, nontraditional La Niña were observed, in which the usual place of the temperature anomaly (Niño 1 and 2) is not affected, but an anomaly arises in the central Pacific (Niño 3.4).[36] The phenomenon is called Central Pacific (CP) La Niña,[35] "dateline" La Niña (because the anomaly arises near the dateline), or La Niña "Modoki" (Modoki is Japanese for "similar, but different").[37][38] There are flavors of ENSO additional to EP and CP types and some scientists argue that ENSO exists as a continuum often with hybrid types.[39]
The effects of the CP La Niña are different from those of the traditional EP La Niña—e.g., the recently discovered La Niña leads to a rainfall increase over northwestern Australia and northern Murray-Darling basin, rather than over the east as in a conventional La Niña.[38] Also, La Niña Modoki increases the frequency of cyclonic storms over Bay of Bengal, but decreases the occurrence of severe storms in the Indian Ocean overall, with the Arabian Sea becoming severely non-conductive to tropical cyclone formation.[40][41]
The recent discovery of ENSO Modoki has some scientists believing it to be linked to global warming.[42] However, comprehensive satellite data go back only to 1979. Generally, there is no scientific consensus on how/if climate change may affect ENSO.[43]
There is also a scientific debate on the very existence of this "new" ENSO. A number of studies dispute the reality of this statistical distinction or its increasing occurrence, or both, either arguing the reliable record is too short to detect such a distinction,[44][45] finding no distinction or trend using other statistical approaches,[46][47][48][49][50] or that other types should be distinguished, such as standard and extreme ENSO.[51][52]
Recent years when La Niña Modoki events occurred include 1973–74, 1975–76, 1983–84, 1988–89, 1998–99, 2000–01, 2008–09, 2010–11 and 2016–17.[37][53][54][55][56][57]
See also
- 2010 Pakistan floods (attributed to La Niña)
- 2010–11 Queensland floods (attributed to La Niña)
- 2010–12 La Niña event
- 2010–13 Southern United States and Mexico drought (attributed to La Niña)
- 2011 East Africa drought (attributed to La Niña)
- El Niño–Southern Oscillation, the atmospheric component of La Niña–El Niño cycle
- Walker circulation
References
- "What are El Nino and La Nina?". oceanservice.noaa.gov. Retrieved 9 November 2017.
- Tropical Atmosphere Ocean project (24 March 2008). "What is La Niña?". Pacific Marine Environmental Laboratory. Retrieved 17 July 2009.
- "Australian Climate Influences: La Niña". Australian Bureau of Meteorology. Retrieved 4 April 2016.
- Becker, Emily (4 December 2014). "December's ENSO Update: Close, but no cigar". ENSO Blog. Archived from the original on 22 March 2016. Retrieved 4 April 2016.
- "ENSO Tracker: About ENSO and the Tracker". Australian Bureau of Meteorology. Retrieved 4 April 2016.
- "Historical El Niño and La Niña Events". Japan Meteorological Agency. Retrieved 4 April 2016.
- "Cold and warm episodes by season". Climate Prediction Center NOAA. Archived from the original on 6 December 2010. Retrieved 12 January 2011.
- "La Niña – Detailed Australian Analysis". Australian Bureau of Meteorology. Retrieved 3 April 2016.
- La Niña and Winter Weather (Report). NOAA. Retrieved 14 March 2014.
- Brian K. Sullivan (6 May 2010). "El Niño Warning Will Fade Out by June, U.S. Says (Update 1)". Bloomberg Businessweek. Retrieved 31 May 2010.
- "Climate Prediction Center – Monitoring & Data: ENSO Impacts on the U.S. – Previous Events". Cpc.noaa.gov. 4 November 2015. Archived from the original on 6 December 2010. Retrieved 3 January 2017.
- "ENSO Diagnostic Discussion". NOAA's Climate Prediction Center. Archived from the original on 26 June 2014. Retrieved 10 January 2011.
- "La Niña is back". NOAA’s Climate Prediction Center. 8 September 2011. Retrieved 10 December 2011.
- "Why is Queensland flooded?". BBC News. 13 January 2011.
- "Tornadoes whipped up by wind, not climate: officials". physorg.com. Retrieved 30 April 2011.
- "Heavy Precipitation Event California and Nevada December 16 – 23, 2010". California Nevada River Forecast Center. Retrieved 8 November 2014.
- "NOAA: 2011 a year of climate extremes in the United States". Climate Prediction Center NOAA. Retrieved 22 January 2012.
- "La Nina Years". The Noaa News. Retrieved 20 April 2016.
- "La Niña Information". Archived from the original on 12 August 2014. Retrieved 31 May 2010.
- Sutherland, Scott (16 February 2017). "La Niña calls it quits. Is El Niño paying us a return visit?". The Weather Network. Retrieved 17 February 2017.
- "El Niño and La Niña". New Zealand's National Institute of Water and Atmospheric Research. 27 February 2007. Archived from the original on 19 March 2016. Retrieved 11 April 2016.
- Barnston, Anthony (19 May 2014). "How ENSO leads to a cascade of global impacts". ENSO Blog. Archived from the original on 26 May 2016.
- "Slow response to East Africa famine 'cost 'lives'". BBC News. 18 January 2012.
- La Niña Weather Likely To Last For Months | Scoop News. Scoop.co.nz (12 October 2010).
- Wu, M. C.; Chang, W. L.; Leung, W. M. (2004). "Impacts of El Niño–Southern Oscillation Events on Tropical Cyclone Landfalling Activity in the Western North Pacific". Journal of Climate. 17 (6): 1419–28. Bibcode:2004JCli...17.1419W. CiteSeerX 10.1.1.461.2391. doi:10.1175/1520-0442(2004)017<1419:ioenoe>2.0.co;2.
- Hong, Lynda (13 March 2008). "Recent heavy rain not caused by global warming". Channel NewsAsia. Retrieved 22 June 2008.
- "ENSO Diagnostic Discussion". Climate Prediction Center. 5 June 2008. Archived from the original on 26 June 2014. Retrieved 9 November 2007.
- Rosario Romero-Centeno; Jorge Zavala-Hidalgo; Artemio Gallegos; James J. O’Brien (August 2003). "Isthmus of Tehuantepec wind climatology and ENSO signal". Journal of Climate. 16 (15): 2628–2639. Bibcode:2003JCli...16.2628R. doi:10.1175/1520-0442(2003)016<2628:iotwca>2.0.co;2.
- Paul A. Arnerich. "Tehuantepecer Winds of the West Coast of Mexico". Mariners Weather Log. 15 (2): 63–67.
- Martínez-Ballesté, Andrea; Ezcurra, Exequiel (2018). "Reconstruction of past climatic events using oxygen isotopes in Washingtonia robusta growing in three anthropic oases in Baja California". Boletín de la Sociedad Geológica Mexicana. 70 (1): 79–94. doi:10.18268/BSGM2018v70n1a5.
- "3. A Never-Ending Winter". Canada's Top Ten Weather Stories for 2008. Environment Canada. 29 December 2008. Archived from the original on 7 August 2011.
- "La Niña follows El Niño, the GLOBE El Niño Experiment continues". Archived from the original on 15 October 2011. Retrieved 31 May 2010.
- Gary Van Valen, Indigenous Agency in the Amazon(Tucson: University of Arizona Press, 2013), 10.
- Kao, Hsun-Ying; Jin-Yi Yu (2009). "Contrasting Eastern-Pacific and Central-Pacific Types of ENSO" (PDF). J. Climate. 22 (3): 615–632. Bibcode:2009JCli...22..615K. CiteSeerX 10.1.1.467.457. doi:10.1175/2008JCLI2309.1.
- Larkin, N. K.; Harrison, D. E. (2005). "On the definition of El Niño and associated seasonal average U.S. Weather anomalies". Geophysical Research Letters. 32 (13): L13705. Bibcode:2005GeoRL..3213705L. doi:10.1029/2005GL022738.
- Yuan Yuan; HongMing Yan (2012). "Different types of La Niña events and different responses of the tropical atmosphere". Chinese Science Bulletin. 58 (3): 406–415. Bibcode:2013ChSBu..58..406Y. doi:10.1007/s11434-012-5423-5.
- Cai, W.; Cowan, T. (2009). "La Niña Modoki impacts Australia autumn rainfall variability". Geophysical Research Letters. 36 (12): L12805. Bibcode:2009GeoRL..3612805C. doi:10.1029/2009GL037885. ISSN 0094-8276.
- Johnson, Nathaniel C. (2013). "How Many ENSO Flavors Can We Distinguish?". J. Climate. 26 (13): 4816–27. Bibcode:2013JCli...26.4816J. doi:10.1175/JCLI-D-12-00649.1.
- M R Ramesh Kumar (23 April 2014). "El Nino, La Nina and the Indian sub-continent". Society for Environmental Communications. Retrieved 25 July 2014.
- K G Sumesh; M R Ramesh Kumar (10 March 2014). "Tropical cyclones over NIO during La-Niña Modoki years" (PDF). Indian Journal of Geo-Marine Sciences. Retrieved 18 February 2017. Cite journal requires
|journal=(help) - Yeh, Sang-Wook; Kug, Jong-Seong; Dewitte, Boris; Kwon, Min-Ho; Kirtman, Ben P.; Jin, Fei-Fei (September 2009). "El Niño in a changing climate". Nature. 461 (7263): 511–4. Bibcode:2009Natur.461..511Y. doi:10.1038/nature08316. PMID 19779449.
- Collins, M.; An, S-I; Cai, W.; Ganachaud, A.; Guilyardi, E.; Jin, F-F; Jochum, M.; Lengaigne, M.; Power, S.; Timmermann, A.; Vecchi, G.; Wittenberg, A. (2010). "The impact of global warming on the tropical Pacific Ocean and El Niño". Nature Geoscience. 3 (6): 391–7. Bibcode:2010NatGe...3..391C. doi:10.1038/ngeo868.
- Nicholls, N. (2008). "Recent trends in the seasonal and temporal behaviour of the El Niño Southern Oscillation". Geophys. Res. Lett. 35 (19): L19703. Bibcode:2008GeoRL..3519703N. doi:10.1029/2008GL034499.
- McPhaden, M.J.; Lee, T.; McClurg, D. (2011). "El Niño and its relationship to changing background conditions in the tropical Pacific Ocean". Geophys. Res. Lett. 38 (15): L15709. Bibcode:2011GeoRL..3815709M. doi:10.1029/2011GL048275.
- Giese, B.S.; Ray, S. (2011). "El Niño variability in simple ocean data assimilation (SODA), 1871–2008". J. Geophys. Res. 116 (C2): C02024. Bibcode:2011JGRC..116.2024G. doi:10.1029/2010JC006695.
- Newman, M.; Shin, S.-I.; Alexander, M.A. (2011). "Natural variation in ENSO flavors". Geophys. Res. Lett. 38 (14): L14705. Bibcode:2011GeoRL..3814705N. doi:10.1029/2011GL047658.
- Yeh, S.‐W.; Kirtman, B.P.; Kug, J.‐S.; Park, W.; Latif, M. (2011). "Natural variability of the central Pacific El Niño event on multi‐centennial timescales" (PDF). Geophys. Res. Lett. 38 (2): L02704. Bibcode:2011GeoRL..38.2704Y. doi:10.1029/2010GL045886.
- Hanna Na; Bong-Geun Jang; Won-Moon Choi; Kwang-Yul Kim (2011). "Statistical simulations of the future 50-year statistics of cold-tongue El Niño and warm-pool El Niño". Asia-Pacific J. Atmos. Sci. 47 (3): 223–233. Bibcode:2011APJAS..47..223N. doi:10.1007/s13143-011-0011-1.
- L'Heureux, M.; Collins, D.; Hu, Z.-Z. (2012). "Linear trends in sea surface temperature of the tropical Pacific Ocean and implications for the El Niño-Southern Oscillation". Climate Dynamics. 40 (5–6): 1–14. Bibcode:2013ClDy...40.1223L. doi:10.1007/s00382-012-1331-2.
- Lengaigne, M.; Vecchi, G. (2010). "Contrasting the termination of moderate and extreme El Niño events in coupled general circulation models". Climate Dynamics. 35 (2–3): 299–313. Bibcode:2010ClDy...35..299L. doi:10.1007/s00382-009-0562-3.
- Takahashi, K.; Montecinos, A.; Goubanova, K.; Dewitte, B. (2011). "ENSO regimes: Reinterpreting the canonical and Modoki El Niño". Geophys. Res. Lett. 38 (10): L10704. Bibcode:2011GeoRL..3810704T. doi:10.1029/2011GL047364.
- Renata G. Tedeschi; Iracema F. A. Cavalcanti (23 April 2014). "Influência dos ENOS Canônico e Modoki na precipitação da América do Sul" (PDF) (in Portuguese). Instituto Nacional de Pesquisas Espaciais/Centro de Previsão de Tempo e Estudos Climáticos. Archived from the original (PDF) on 23 October 2014. Retrieved 27 September 2014.
- V. Platonov; E. Semenov; E. Sokolikhina (13 February 2014). "Extreme La-Nina 2010/11 and the vigorous flood at the north-east of Australia" (PDF). EGU General Assembly/Geophysical Research. Retrieved 15 October 2014.
- Shinoda, Toshiaki; Hurlburt, Harley E.; Metzger, E. Joseph (2011). "Anomalous tropical ocean circulation associated with La Niña Modoki". Journal of Geophysical Research: Oceans. 116 (12): C12001. Bibcode:2011JGRC..11612001S. doi:10.1029/2011JC007304.
- Welsh, Jon (2011). "Introducing La Nina Modoki: she's 'similar but different'…" (PDF). Spotlight Magazine. No. Spring 2016. Australian Government Cotton Research and Development Corporation. pp. 34–35. Retrieved 18 February 2017.
- Jon Welsh (6 October 2016). "Are we heading for a La Niña Modoki?". Grain Central. Retrieved 18 February 2017.