Human sex ratio
In anthropology and demography, the human sex ratio is the ratio of males to females in a population. More data are available for humans than for any other species, and the human sex ratio is more studied than that of any other species, but interpreting these statistics can be difficult.
|
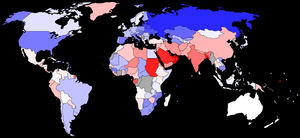
Countries with more females than males
Countries with more males than females
Countries with very similar proportions of males and females (to 3 significant figures, i.e., 1.00 males to 1.00 females)
No data |


Like most sexual species, the sex ratio in humans is close to 1:1. In humans, the natural ratio between males and females at birth is slightly biased towards the male sex, being estimated to be about 1.05[2] or 1.06[3] or within a narrow range from 1.03 to 1.06[4] males/per female born. Sex imbalance may arise as a consequence of various factors including natural factors, exposure to pesticides and environmental contaminants,[5][6] war casualties, sex-selective abortions, infanticides,[7] aging, gendercide and problems with birth registration.[2]
The sex ratio for the entire world population is 101 males to 100 females (2018 est.).[8] Depending upon which definition is used, between 0.1% and 1.7% of live births are intersex.[9][10]
Human sex ratios, either at birth or in the population as a whole, are reported in any of four ways: the ratio of males to females, the ratio of females to males, the proportion of males, or the proportion of females. If there are 108,000 males and 100,000 females the ratio of males to females is 1.080 and the proportion of males is 51.9%. Scientific literature often uses the proportion of males. This article uses the ratio of males to females, unless specified otherwise.
Natural ratio
In a study around 2002, the natural sex ratio at birth was estimated to be within a narrow range of 1.03 to 1.06 males/female.[4][11] Some scholars suggest that countries considered to have significant practices of prenatal sex-selection are those with birth sex ratios of 1.08 and above (selection against females) and 1.02 and below (selection against males). This assumption has been questioned by some scholars.[12]
Infant mortality is significantly higher in boys than girls in most parts of the world. This has been explained by sex differences in genetic and biological makeup, with boys being biologically weaker and more susceptible to diseases and premature death.[13][14] Recent studies have found that numerous preconception or prenatal environmental factors affect the probability of a baby being conceived male or female. It has been proposed that these environmental factors also explain sex differences in mortality.[15] In most populations, adult males tend to have higher death rates than adult females of the same age (even after allowing for causes specific to females such as death in childbirth), due to both natural causes such as heart attacks and strokes, which account for by far the majority of deaths, and also violent causes, such as homicide and warfare, resulting in higher life expectancy of females. For example, in the United States, as of 2006, an adult non-elderly male is 3 to 6 times more likely to become a victim of a homicide and 2.5 to 3.5 times more likely to die in an accident than a female of the same age.[16] Consequently, the sex ratio tends to reduce as age increases, and among the elderly there is usually a greater proportion of females. For example, the male to female ratio falls from 1.05 for the group aged 15 to 65 to 0.70 for the group over 65 in Germany, from 1.00 to 0.72 in the United States, from 1.06 to 0.91 in mainland China, and from 1.07 to 1.02 in India.
In the United States, the sex ratios at birth over the period 1970–2002 were 1.05 for the white non-Hispanic population, 1.04 for Mexican Americans, 1.03 for African Americans and Indians, and 1.07 for mothers of Chinese or Filipino ethnicity.[17] Among Western European countries around 2001, the ratios ranged from 1.04 in Belgium to 1.07 in Switzerland,[18] Italy,[19] Ireland[20] and Portugal. In the aggregated results of 56 Demographic and Health Surveys[21] in African countries, the ratio is 1.03, albeit with considerable country-to-country variation.[22]

There is controversy about whether sex ratios outside the 1.03–1.07 range are due to sex selection, as suggested by some scholars, or due to natural causes. Some scholars argue that strong socioeconomic factors such as the dowry system in India and the one child policy of China are responsible for prenatal sex selection. In a widely cited article,[23] Amartya Sen supported such views. Other researchers argue that an unbalanced sex ratio should not be automatically held as evidence of prenatal sex selection; Michel Garenne reports that many African nations have, over decades, witnessed birth sex ratios below 1.00, that is more girls are born than boys.[24] Angola, Botswana and Namibia have reported birth sex ratios between 0.94 and 0.99, which is quite different from the presumed "normal" sex ratio, meaning that significantly more girls have been born in such societies.[25]
In an extensive study, carried out around 2005, of sex ratio at birth in the United States from 1940 over 62 years, statistical evidence suggested the following:[26]
- For mothers having their first baby, the total sex ratio at birth was 1.06 overall, with some years at 1.07.
- For mothers having babies after the first, this ratio consistently decreased with each additional baby from 1.06 towards 1.03.
- The age of the mother affected the ratio:
- the overall ratio was 1.05 for mothers aged 25 to 35 at the time of birth
- mothers who were below the age of 15 or above 40 had babies with a sex ratio ranging between 0.94 and 1.11, and a total sex ratio of 1.04
Factors affecting sex ratio in humans
Fisher's principle
Fisher's principle is an explanation of why the sex ratio of most species is approximately 1:1. Outlined by Ronald Fisher in his 1930 book, it is an argument in terms of parental expenditure. Essentially he argues that the 1:1 ratio is the evolutionarily stable strategy.
Natural factors
The natural factors that affect the human sex ratio are an active area of scientific research. Over 1000 articles have been published in various journals. Two of the often cited reviews of scientific studies on human sex ratio are by W. H. James.[27][28] The scientific studies are based on extensive birth and death records in Africa, the Americas, Asia, Australia, and Europe. A few of these studies extend to over 100 years of yearly human sex ratio data for some countries. These studies suggest that the human sex ratio, both at birth and as a population matures, can vary significantly according to a large number of factors, such as paternal age, maternal age, plural birth, birth order, gestation weeks, race, parent's health history, and parent's psychological stress. Remarkably, the trends in human sex ratio are not consistent across countries at a given time, or over time for a given country. In economically developed countries, as well as developing countries, these scientific studies have found that the human sex ratio at birth has historically varied between 0.94 and 1.15 for natural reasons.
In a scientific paper published in 2008,[12] James states that conventional assumptions have been:
- there are equal numbers of X and Y chromosomes in mammalian sperm
- X and Y stand equal chance of achieving conception
- therefore equal numbers of male and female zygotes are formed
- therefore any variation of sex ratio at birth is due to sex selection between conception and birth.
James cautions that available scientific evidence stands against the above assumptions and conclusions. He reports that there is an excess of males at birth in almost all human populations, and the natural sex ratio at birth is usually between 1.02 and 1.08. However the ratio may deviate significantly from this range for natural reasons.
A 1999 scientific paper published by Jacobsen reported the sex ratio for 815,891 children born in Denmark between 1980–1993.[29] They studied the birth records to identify the effects of multiple birth, birth order, age of parents and the sexes of preceding siblings on the proportion of males using contingency tables, chi-squared tests and regression analysis. The secondary sex ratio decreased with increasing number of children per plural birth and with paternal age, whereas no significant independent effect was observed for maternal age, birth order, or other natural factors.
A 2009 research paper published by Branum et al. reports the sex ratio derived from data in United States birth records over a 25-year period (1981–2006).[30] This paper reports that the sex ratio at birth for the white ethnic group in the United States was 1.04 when the gestational age was 33–36 weeks, but 1.15 for gestational ages of less than 28 weeks, 28–32 weeks, and 37 or more weeks. This study also found that the sex ratios at birth in the United States, between 1981–2006, were lower in both black and Hispanic ethnic groups when compared with white ethnic group.
The relationship between natural factors and human sex ratio at birth, and with aging, remains an active area of scientific research.
Environmental factors
Effects of climate change
Various scientists have examined the question whether human birth sex ratios have historically been affected by environmental stressors such as climate change and global warming. Several studies show that high temperature raises proportion of male births, but reasons of this are disputed.[31] Catalano et al. report that cold weather is an environmental stressor, and women subjected to colder weather abort frail male fetuses in greater proportion, thereby lowering birth sex ratios. But cold weather stressors also extend male longevity, thereby raising the human sex ratio at older ages.[32] The Catalano team finds that a 1 °C increase in annual temperature predicts one more male than expected for every 1,000 females born in a year.
Helle et al. have studied 138 years of human birth sex ratio data, from 1865 to 2003. They find an increased excess of male births during periods of exogenous stress (World War II) and during warm years. In the warmest period over the 138 years, the birth sex ratio peaked at about 1.08 in northern Europe.[31] Increase of sex ratio for 1 °C increase in temperature was approximately the same as the result of Catalano team.[33]
Effects of gestation environment
Causes of stress during gestation, such as maternal malnutrition[34] generally appear to increase fetal deaths particularly among males,[32] resulting in a lower boy to girl ratio at birth. Also, higher incidence of Hepatitis B virus in populations is believed to increase the male to female sex ratio, while some unexplained environmental health hazards are thought to have the opposite effect.[35]
The effects of gestational environment on human sex ratio are complicated and unclear, with numerous conflicting reports. For example, Oster et al. examined a data set of 67,000 births in China, 15 percent of whom were Hepatitis B carriers. They found no effect on birth sex ratio from Hepatitis B presence in either the mothers or fathers.[36]
Effects of chemical pollution

A 2007 survey by the Arctic Monitoring and Assessment Program noted abnormally low sex ratios in Russian Arctic villages and Inuit villages in Greenland and Canada, and attributed this imbalance to high levels of endocrine disruptors in the blood of inhabitants, including PCBs and DDT. These chemicals are believed to have accumulated in the tissues of fish and animals that make up the bulk of these populations' diets.[37] However, as noted in the Social factors section below, it is important to exclude alternative explanations, including social ones, when examining large human populations whose composition by ethnicity and race may be changing.
A 2008 report provides further evidence of effects of feminizing chemicals on male development in each class of vertebrate species as a worldwide phenomenon, possibly leading to a decline in the sex ratio in humans and a possible decline in sperm counts.[38] Out of over 100,000 recently introduced chemicals, 99% are poorly regulated.[38]
Other factors that could possibly affect the sex ratio include:
- Social status of the mother, known to be a factor in influencing the sex ratio of certain animals such as swine,[39] but apparently not in humans.[40]
- Whether the mother smokes.[41]
- Whether the mother has a partner or other support network,[42] although this correlation is widely considered to be the result of an unknown third factor.
- Latitude, with countries near the equator producing more females than near the poles.[43]
Other scientific studies suggest that environmental effects on human sex ratio at birth are either limited or not properly understood. For example, a research paper published in 1999, by scientists from Finland's National Public Health Institute, reports the effect of environmental chemicals and changes in sex ratio over 250 years in Finland.[44] This scientific team evaluated whether Finnish long-term data are compatible with the hypothesis that the decrease in the ratio of male to female births in industrial countries is caused by environmental factors. They analyzed the sex ratio of births from the files of Statistics Finland and all live births in Finland from 1751 to 1997. They found an increase in the proportion of males from 1751 to 1920; this was followed by a decrease and interrupted by peaks in births of males during and after World War I and World War II. None of the natural factors such as paternal age, maternal age, age difference of parents, birth order could explain the time trends. The scientists found that the peak ratio of male proportion precedes the period of industrialization or the introduction of pesticides or hormonal drugs, rendering a causal association between environmental chemicals and human sex ratio at birth unlikely. Moreover, these scientists claim that the trends they found in Finland are similar to those observed in other countries with worse pollution and much greater pesticide use.
Some studies have found that certain kinds of environmental pollution, in particular dioxins leads to higher rates of female births.[45][46]
Social factors

Sex-selective abortion and infanticide are thought to significantly skew the naturally occurring ratio in some populations, such as China, where the introduction of ultrasound scans in the late 1980s has led to a birth sex ratio (males to females) of 1.181 (2010 official census data for China).[47] The 2011 India census reports India's sex ratio in 0–6 age bracket at 1.088.[48] The 2011 birth sex ratios for China and India are significantly above the mean ratio recorded in the United States from 1940 through 2002 (1.051); however, their birth sex ratios are within the 0.98–1.14 range observed in the United States for significant ethnic groups over the same time period.[26]:10 Along with Asian countries, a number of European, Middle East, and Latin American countries have recently reported high birth sex ratios in the 1.06 to 1.14 range. High birth sex ratios, some claim, may be caused in part by social factors.
Reported sex ratios at birth, outside the typical range of 1.03 to 1.07, thus call for an explanation of some kind.
Another hypothesis has been inspired by the recent and persistent high birth sex ratios observed in Georgia and Armenia—both predominantly Orthodox Christian societies—and Azerbaijan, a predominantly Muslim society. Since their independence from Soviet Union, the birth sex ratio in these Caucasus countries has risen sharply to between 1.11 and 1.20, some of world's highest. Mesle et al. consider the hypothesis that the high birth sex ratio may be because of the social trend of more than two children per family, and birth order possibly affects the sex ratio in this region of the world. They also consider the hypothesis that sons are preferred in these countries of the Caucasus, the spread of scans and there being a practice of sex-selective abortion; however, the scientists admit that they do not have definitive proof that sex-selective abortion is actually happening or that there are no natural reasons for the persistently high birth sex ratios.[49]
As an example of how the social composition of a human population may produce unusual changes in sex ratios, in a study in several counties of California where declining sex ratios had been observed, Smith and Von Behren observe "In the raw data, the male birth proportion is indeed declining. However, during this period, there were also shifts in demographics that influence the sex ratio. Controlling for birth order, parents' age, and race/ethnicity, different trends emerged. White births (which account for over 80%) continued to show a statistically significant decline, while other racial groups showed non-statistically significant declines (Japanese, Native American, other), little or no change (black), or an increase (Chinese). Finally, when the white births were divided into Hispanic and non-Hispanic (possible since 1982), it was found that both white subgroups suggest an increase in male births." They concluded, "that the decline in male births in California is largely attributable to changes in demographics."[50]
Early marriage and parents' age
Several studies have examined human birth sex ratio data to determine whether there is a natural relationship between the age of mother or father and the birth sex ratio. For example, Ruder has studied 1.67 million births in 33 states in the United States to investigate the effect of parents' ages on birth sex ratios.[51] Similarly, Jacobsen et al. have studied 0.82 million births in Denmark with the same goal.[52] These scientists find that maternal age has no statistically significant role on the human birth sex ratio. However, they report a significant effect of paternal age. Significantly more male babies were born per 1000 female babies to younger fathers than to older fathers. These studies suggest that social factors such as early marriage and males siring their children young may play a role in raising birth sex ratios in certain societies.[53]
Data sources and data quality issues
Reported sex ratios at birth for some human populations may be influenced not only by cultural preferences and social practices that favor the birth or survival of one sex over the other but also by incomplete or inaccurate reporting or recording of the births or the survival of infants. Even what constitutes a live birth or infant death may vary from one population to another. For example, for most of the 20th century in Russia (and the Soviet Union), extremely premature newborns (less than 28 weeks gestational age, or less than 1000 grams in weight, or less than 35 centimeters in length) were not counted as a live birth until they had survived 7 days; and if that infant died in those first 168 hours it would not be counted as an infant death. This led to serious underreporting of the infant mortality rate (by 22% to 25%) relative to standards recommended by the World Health Organization.[54]

When unusual sex ratios at birth (or any other age) are observed, it is important to consider misreporting, misrecording, or under-registration of births or deaths as possible reasons. Some researchers have in part attributed the high male to female sex ratios reported in mainland China in the last 25 years to the underreporting of the births of female children after the implementation of the one-child policy, though alternative explanations are now generally more widely accepted, including above all the use of ultrasound technology and sex-selective abortion of female fetuses and, probably to a more limited degree, neglect or in some cases infanticide of females. In the case of China, because of deficiencies in the vital statistics registration system, studies of sex ratios at birth have relied either on special fertility surveys, whose accuracy depends on full reporting of births and survival of both male and female infants, or on the national population census from which both birth rates and death rates are calculated from the household's reporting of births and deaths in the 18 months preceding the census.[55] To the extent that this underreporting of births or deaths is sex-selective, both fertility surveys and censuses may inaccurately reflect the actual sex ratios at birth.[56]
Economic factors
Catalano has examined the hypothesis that population stress induced by a declining economy reduces the human sex ratio. He compared the sex ratio in East and West Germany for the years 1946 to 1999, with genetically similar populations. The population stressors theory predicts that the East German sex ratio should have been lower in 1991 when East Germany's economy collapsed than expected from its previous years. Furthermore, the theory suggests that East German birth sex ratios should generally be lower than the observed sex ratio in West Germany for the same years, over time. According to Catalano's study, the birth sex ratio data from East Germany and West Germany over 45 years support the hypothesis. The sex ratio in East Germany was also at its lowest in 1991. According to Catalano's study, assuming women in East Germany did not opt to abort male more than female, the best hypothesis is that a collapsing economy lowers the human birth sex ratio, while a booming economy raises the birth sex ratio. Catalano notes that these trends may be related to the observed trend of elevated incidences of very low birth weight from maternal stress, during certain macroeconomic circumstances.[57]
Other gestational factors
A research group led by Ein-Mor reported that sex ratio does not seem to change significantly with either maternal or paternal age. Neither gravidity nor parity seem to affect the male-to-female ratio.[58] However, there is a significant association of sex ratio with the length of gestation.[58] These Ein-mor conclusions have been disputed. For example, James suggested[59] that Ein-Mor results are based on some demographic variables and a small data set, a broader study of variables and larger population set suggests human sex ratio shows substantial variation for various reasons and different trend effects of length of gestation than those reported by Ein-Mor. In another study, James has offered the hypothesis that human sex ratios, and mammalian sex ratios in general, are causally related to the hormone levels of both parents at the time of conception.[12] This hypothesis is yet to be tested and proven true or false over large population sets.
Gender imbalance
Gender imbalance is a disparity between males and females in a population. As stated above, males usually exceed females at birth but subsequently experience different mortality rates due to many possible causes such as differential natural death rates, war casualties, and deliberate gender control.
According to Nicholas Kristof and Sheryl WuDunn, two Pulitzer Prize-winning reporters for the New York Times, violence against women is causing gender imbalances in many developing countries.[60] They detail sex-selective infanticide in the developing world, particularly in China, India and Pakistan.[60]
Commonly, countries with gender imbalances have three characteristics in common. The first is a rapid decline in fertility, either because of preference for smaller families or to comply with their nation's population control measures. Second, there is pressure for women to give birth to sons, often because of cultural preferences for male heirs. Third, families have widespread access to technology to selectively abort female foetuses.[61]
As a contributing measure to gender imbalance in developing countries, Kristof and WuDunn's[60] best estimate is that a girl in India, from 1 to 5 years of age, dies from discrimination every four minutes (132,000 deaths per year); that 39,000 girls in China die annually, within the first year of life, because parents did not give girls the same medical care and attention that boys received. The authors describe similar gender discrimination and gendercide in Congo, Kenya, Pakistan, Iraq, Bahrain, Thailand and many other developing countries.
Some of the factors suggested as causes of the gender imbalance are warfare (excess of females, notably in the wake of WWI in western Europe, and WWII, particularly in the Soviet Union); sex-selective abortion and infanticide (excess of males, notably in China as a result of the one-child policy, or in India); and large-scale migration, such as that by male labourers unable to bring their families with them (as in Qatar and other Gulf countries[62]). Gender imbalance may result in the threat of social unrest, especially in the case of an excess of low-status young males unable to find spouses,[63] and being recruited into the service of militaristic political factions. Economic factors such as male-majority industries and activities like the petrochemical, agriculture, engineering, military, and technology also have created a male gender imbalance in some areas dependent on one of these industries. Conversely, the entertainment, banking, tourism, fashion, and service industries may have resulted in a female-majority gender imbalance in some areas dependent on them.[64]
One study[65] found that the male-to-female sex ratio in the German state of Bavaria fell as low as 0.60 after the end of World War II for the most severely affected age cohort (those between 21 and 23 years old in 1946). This same study found that out-of-wedlock births spiked from approximately 10–15% during the inter-war years up to 22% at the end of the war. This increase in out-of-wedlock births was attributed to a change in the marriage market caused by the decline in the sex ratio.

The Northern Mariana Islands have the highest female ratio with 0.77 males per female. Qatar has the highest male ratio, with 2.87 males/female. For the group aged below 15, Sierra Leone has the highest female ratio with 0.96 males/female, and the Republic of Georgia and the People's Republic of China are tied for the highest male ratio with 1.13 males/female (according to the 2006 CIA World Factbook).
The value for the entire world population is 1.01 males/female, with 1.07 at birth, 1.06 for those under 15, 1.02 for those between 15 and 64, and 0.78 for those over 65.[8]
The "First World" G7 members all have a gender ratio in the range of 0.95–0.98 for the total population, of 1.05–1.07 at birth, of 1.05–1.06 for the group below 15, of 1.00–1.04 for the group aged 15–64, and of 0.70–0.75 for those over 65.
Countries on the Arabian peninsula tend to have a 'natural' ratio of about 1.05 at birth but a very high ratio of males for those over 65 (Saudi Arabia 1.13, Arab Emirates 2.73, Qatar 2.84), indicating either an above-average mortality rate for females or a below-average mortality for males, or, more likely in this case, a large population of aging male guest workers. Conversely, countries of Northern and Eastern Europe (the Baltic states, Belarus, Ukraine, Russia) tend to have a 'normal' ratio at birth but a very low ratio of males among those over 65 (Russia 0.46, Latvia 0.48, Ukraine 0.52); similarly, Armenia has a far above average male ratio at birth (1.17), and a below-average male ratio above 65 (0.67). This effect may be caused by emigration and higher male mortality as result of higher Soviet era deaths; it may also be related to the enormous (by western standards) rate of alcoholism in the former Soviet states. Another possible contributory factor is an aging population, with a higher than normal proportion of relatively elderly people: we recall that due to higher differential mortality rates the ratio of males to females reduces for each year of age.
In the evolutionary biology of sexual reproduction the operational sex ratio (OSR), is the ratio of sexually competing males that are ready to mate to sexually competing females that are ready to mate,[66][67][68] or alternatively the local ratio of fertilizable females to sexually active males at any given time.[69] This is different from the physical sex ratio because it does not take into account sexually inactive or non-competitive individuals (individuals that do not compete for mates). On occasion, regions with a high male-low female sex ratio, e.g. Alaska, have shown a correlation with a higher rate of reported rape.[70]
Consequences of a high sex ratio

There are several social consequences of an imbalanced sex ratio. It may also become a factor in societal and demographic collapse. For example, the native population of Cusco, Peru at the time of the Spanish conquest was stressed by an imbalance in the sex ratio between men and women.[71] High ratios of males make it easier for women to marry, but harder for men.[72] In parts of China and India, there is a 12–15% excess of young men. These men will remain single and will be unable to have families, in societies where marriage is regarded as virtually universal and social status and acceptance depend, in large part, on being married and creating a new family. Analyses of how sex ratio imbalances affect personal consumption and intra-household distribution were pioneered by Gary Becker, Shoshana Grossbard-Shechtman,[73][74] and Marcia Guttentag and Paul Secord.[75] High ratios of males have a positive effect on marital fertility and women's share of household consumption and negative effects on non-marital cohabitation and fertility and women's labor supply. It has been shown that variation in sex ratio over time is inversely related to married women's labor supply in the U.S.[76][77]
An additional problem is that many of these men are of low socioeconomic class with limited education. When there is a shortage of women in the marriage market, the women can "marry up", inevitably leaving the least desirable men with no marriage prospects. In many communities today, there are growing numbers of young men who come from lower classes who are marginalized because of lack of family prospects and the fact that they have little outlet for sexual energy. There is evidence that this situation will lead to increased levels of antisocial behavior and violence and will ultimately present a threat to the stability and security of society.[78]
History
The human sex ratio at birth has been an object of study since early in the history of statistics, as it is easily recorded and a large number for sufficiently large populations.[79] An early researcher was John Arbuthnot (1710),[80][81][82][83] who in modern terms performed statistical hypothesis testing, computing the p-value (via a sign test), interpreted it as statistical significance, and rejected the null hypothesis. This is credited as "… the first use of significance tests …"[84] the first example of reasoning about statistical significance and moral certainty,[85] and "… perhaps the first published report of a nonparametric test …";[81] see details at Sign test § History. Human sex at birth was also analyzed and used as an example by Jacob Bernoulli Ars Conjectandi (1713), where an unequal sex ratio is a natural example of a Bernoulli trial with uneven odds. Willem's Gravesande (1774) also studied it.[83] Pierre-Simon Laplace (1778) used human sex ratio as an example in his development of probability theory. He considered the statistics of almost half a million births; the statistics showed an excess of boys compared to girls.[86][87] He concluded by calculation of a p-value that the excess was a real, but unexplained, effect.[88]
See also
- Intersex § Population figures
- Operational sex ratio
- Sex selection
- Sex-selective abortion and infanticide
- Surplus women
- Missing women
- XY sex-determination system
Countries:
- List of countries by sex ratio
- Lost boys (Mormon fundamentalism)
- Missing women of China
- List of Chinese administrative divisions by sex ratio
References
- Data from the CIA World Factbook . Map compiled in 2006.
- "World Health Organization, Sex Ratio". SEARO.
- Grech, Victor; Savona-Ventura, Charles; Vassallo-Agius, P (27 April 2002). "Unexplained differences in sex ratios at birth in Europe and North America". BMJ : British Medical Journal. 324 (7344): 1010–1011. doi:10.1136/bmj.324.7344.1010. PMC 102777. PMID 11976243.
- Chao, Fengqing; Gerland, Patrick; Cook, Alex R.; Alkema, Leontine (7 May 2019). "Systematic assessment of the sex ratio at birth for all countries and estimation of national imbalances and regional reference levels". Proceedings of the National Academy of Sciences. 116 (19): 9303–9311. doi:10.1073/pnas.1812593116. PMC 6511063. PMID 30988199.
- "How pollution may be changing the ratio of girls to boys". Stir.ac.uk. 18 June 2014. Retrieved 6 January 2018.
- Davis, D. L.; Gottlieb, M. B.; Stampnitzky, J. R. (1998). "Reduced ratio of male to female births in several industrial countries: A sentinel health indicator?" (PDF). JAMA. 279 (13): 1018–23. doi:10.1001/jama.279.13.1018. PMID 9533502.
- Very high sex ratios were common in even late medieval Europe, which may indicate sex-selective infanticide. Josiah Cox Russell, 1958, Late Ancient and Medieval Population, pp. 13–17.
- "CIA Fact Book". The Central Intelligence Agency of the United States.
- "How common is intersex?". Intersex Society of North America.
- Fausto-Sterling, Anne (2000). Sexing the Body: Gender Politics and the Construction of Sexuality. New York: Basic Books. ISBN 0-465-07713-7.
- Grech, V; Savona-Ventura, C; Vassallo-Agius, P (2002). "Unexplained differences in sex ratios at birth in Europe and North America". BMJ (Clinical Research Ed.). 324 (7344): 1010–1. doi:10.1136/bmj.324.7344.1010. PMC 102777. PMID 11976243.
- James W.H. (July 2008). "Hypothesis:Evidence that Mammalian Sex Ratios at birth are partially controlled by parental hormonal levels around the time of conception". Journal of Endocrinology. 198 (1): 3–15. doi:10.1677/JOE-07-0446. PMID 18577567.
- Demography. 2013 Apr;50(2):421-44. doi:10.1007/s13524-012-0161-5.
- Alkema, Leontine; Chao, Fengqing; You, Danzhen; Pedersen, Jon; Sawyer, Cheryl C. (1 September 2014). "National, regional, and global sex ratios of infant, child, and under-5 mortality and identification of countries with outlying ratios: a systematic assessment". The Lancet Global Health. 2 (9): e521–e530. doi:10.1016/S2214-109X(14)70280-3. PMID 25304419.
- Pongou, Roland (14 November 2012). "Why Is Infant Mortality Higher in Boys Than in Girls? A New Hypothesis Based on Preconception Environment and Evidence From a Large Sample of Twins". Demography. 50 (2): 421–444. doi:10.1007/s13524-012-0161-5.
- "Death Rates for 113 Selected Causes by 5-Year Age Groups, Race, and Sex: the United States, 1999–2006". cdc.gov.
- Matthews TJ, et al. (June 2005). "Trend Analysis of the Sex Ratio at Birth in the United States". National Vital Statistics Reports. 53 (20).
- "Sex ratio in Switzerland". Switzerland Federal Statistics Office.
- "UN Sex Ratio Statistics". United Nations Population Division.
- "Sex ratio at birth (per 100 female newborn)". United Nations Data Division.
- "The Demographic and Health Survey Program – Quality information to plan, monitor and improve population, health, and nutrition programs". measuredhs.com.
- Garenne M (December 2002). "Sex ratios at birth in African populations: a review of survey data". Hum. Biol. 74 (6): 889–900. doi:10.1353/hub.2003.0003. PMID 12617497.
- Sen, Amartya (1990), More than 100 million women are missing, New York Review of Books, 20 December, pp. 61–66
- Michel Garenne, Southern African Journal of Demography, Vol. 9, No. 1 (June 2004), pp. 91–96
- Michel Garenne, Southern African Journal of Demography, Vol. 9, No. 1 (June 2004), page 95
- "Trend Analysis of the Sex Ratio at Birth in the United States" (PDF). U.S. Department of Health and Human Services, National Center for Health Statistics.
- James WH (1987). "The human sex ratio. Part 1: A review of the literature". Human Biology. 59 (5): 721–752. PMID 3319883.
- James WH (1987). "The human sex ratio. Part 2: A hypothesis and a program of research". Human Biology. 59 (6): 873–900. PMID 3327803.
- Jacobsen, R; Møller, H; Mouritsen, A (1999). "Natural variation in the human sex ratio". Human Reproduction. 14 (12): 3120–3125. doi:10.1093/humrep/14.12.3120. PMID 10601107.
- Branum, A. M.; Parker, J. D.; Schoendorf, K. C. (2009). "Trends in US sex ratio by pluraity, gestational age and race/ethinicity" (PDF). Reproductive Epidemiology. 24 (11): 2936–2944 (see p. 2941 Figure 2). doi:10.1093/humrep/dep255.
- Helle, Samuli; Helama, Samuli; Lertola, Kalle (November 2009). "Evolutionary ecology of human birth sex ratio under the compound influence of climate change, famine, economic crises and wars". Journal of Animal Ecology. 78 (6): 1226–1233. doi:10.1111/j.1365-2656.2009.01598.x.
- Catalano R, Bruckner T, Smith KR (February 2008). "Ambient temperature predicts sex ratios and male longevity". Proc. Natl. Acad. Sci. U.S.A. 105 (6): 2244–7. Bibcode:2008PNAS..105.2244C. doi:10.1073/pnas.0710711104. PMC 2538905. PMID 18250336.
- Helle et al., 2009, p. 1228: "an increase of 1 °C in ambient temperature anomaly was related to a 0.06% increase in annual birth sex ratio". Sex ratio in this work is defined as boys/(boys+girls), so, this increase corresponds to 1.2 additional males for every 1,000 females.
- Andersson R, Bergström S (December 1998). "Is maternal malnutrition associated with a low sex ratio at birth?". Hum. Biol. 70 (6): 1101–6. PMID 9825599.
- Davis DL, Gottlieb MB, Stampnitzky JR (April 1998). "Reduced ratio of male to female births in several industrial countries: a sentinel health indicator?". JAMA. 279 (13): 1018–23. doi:10.1001/jama.279.13.1018. PMID 9533502.
- Oster, Emily; Chen, Gang; Yu, Xinsen; Lin, Wenyao (2008). "Hepatitis B Does Not Explain Male-Biased Sex Ratios in China" (PDF). Retrieved 19 May 2009.
- Man-made chemicals blamed many more girls than boys are born in Arctic, The Guardian, 12 September 2007.
- Lean, Geoffrey (7 December 2008). "It's official: Men really are the weaker sex". The Independent.
- Mendl M, Zanella AJ, Broom DM, Whittemore CT (1995). "Maternal social status and birth sex ratio in domestic pigs: an analysis of mechanisms". Animal Behaviour. 50 (5): 1361–70. doi:10.1016/0003-3472(95)80051-4.
- Ellis L, Bonin S (2002). "Social status and the secondary sex ratio: new evidence on a lingering controversy". Soc Biol. 49 (1–2): 35–43. doi:10.1080/19485565.2002.9989047. PMID 14652908.
- Mills JL, England L, Granath F, Cnattingius S (May 2003). "Cigarette smoking and the male-female sex ratio". Fertil. Steril. 79 (5): 1243–5. doi:10.1016/S0015-0282(03)00156-0. PMID 12738529.
- Norberg, Karen (November 2004). "Partnership Status and the Human Sex Ratio at Birth". NBER Working Paper Series. SSRN 622634. w10920. Cite journal requires
|journal=(help) - Navara KJ (August 2009). "Humans at tropical latitudes produce more females". Biol. Lett. 5 (4): 524–7. doi:10.1098/rsbl.2009.0069. PMC 2781905. PMID 19364717.
- Vartiainen, T; Kartovaara, L; Tuomisto, J (1999). "Environmental chemicals and changes in sex ratio: analysis over 250 years in finland". Environmental Health Perspectives. 107 (10): 813–815. doi:10.1289/ehp.99107813. PMC 1566625. PMID 10504147.
- Check, Erika (21 October 2005). "Pollution makes for more girls". Nature News. doi:10.1038/news051017-16.
- Mittelstaedt, Martin (15 November 2005). "Pollution debate born of Chemical Valley's girl-baby boom". The Globe and Mail. Retrieved 7 August 2017.
- China's sex ratio declines for two straight years Xinhua, China (16 August 2011) – "Li Bin, director of the National Population and Family Planning Commission, made the remarks at a press conference (...). China's sex ratio at birth was 118.08 males for every 100 females in 2010, according to census data, Li said."
- India at Glance – Population Census 2011 – Final Census of India, Government of India (2013)
- Mesle, France; Vallin, Jacques; Badurashvili, Irina (2007). A Sharp Increase in Sex Ratio at Birth in the Caucasus. Why? How? (PDF). Committee for International Cooperation in National Research in Demography. pp. 73–89. ISBN 978-2-910053-29-1.
- Smith D, Von Behren J (December 2005). "Trends in the sex ratio of California births, 1960–1996". J Epidemiol Community Health. 59 (12): 1047–53. doi:10.1136/jech.2005.036970. PMC 1732975. PMID 16286492.
- Ruder, Avima (1985f). "Paternal-Age and Birth-Order Effect on the Human Secondary Sex Ratio". American Journal of Human Genetics. 37 (2): 362–372. PMC 1684568. PMID 3985011.
- Jacobsen; et al. (1999). "Natural Variation in the Human Sex Ratio". Human Reproduction. 14 (12): 3120–3125. doi:10.1093/humrep/14.12.3120. PMID 10601107.
- Bernstein, M. E. (1958). "Studies in The Human Sex Ratio 5. A Genetic Explanation of the Wartime Secondary Sex Ratio". American Journal of Human Genetics. 10 (1): 68–70. PMC 1931860. PMID 13520702.
- Anderson, Barbara A.; Silver, Brian D. (1986). "Infant Mortality in the Soviet Union: Regional Differences and Measurement Issues". Population and Development Review. 12 (4): 705–37. doi:10.2307/1973432. JSTOR 1973432.
- For example, the number of births reported to family planning and other administrative agencies has been significantly lower than the number determined in population surveys and the census. See Zhang, Guangyu (April 2004) "Very Low Fertility in China in the 1990s: Reality or An Illusion Arising from Birth Underreporting?" Paper presented at the annual meeting of the Population Association of America.
- For studies reveal underreporting or delayed reporting of female births in China, see Merli MG, Raftery AE (February 1990). "Are births underreported in rural China? Manipulation of statistical records in response to China's population policies". Demography. 37 (1): 109–26. doi:10.2307/2648100. JSTOR 2648100. PMID 10748993. and Cai, Yong; Lavely, William (2003). "China's Missing Girls: Numerical Estimates and Effects on Population Growth" (PDF). The China Review. 3 (2): 13–29. JSTOR 23461902.
- Catalano, Ralph (2003). "Sex ratios in the two Germanies: a test of the economic stress hypothesis". Human Reproduction. 18 (9): 1972–1975. doi:10.1093/humrep/deg370.
- Ein-Mor E, Mankuta D, Hochner-Celnikier D, Hurwitz A, Haimov-Kochman R (April 2010). "Sex ratio is remarkably constant". Fertil. Steril. 93 (6): 1961–5. doi:10.1016/j.fertnstert.2008.12.036. PMID 19159875.
- James W.H. (May 2010). "The Inconstancy of Human Sex Ratios at Birth". Fertil. Steril. 94 (3): e53. doi:10.1016/j.fertnstert.2010.05.044. PMID 20598299.
- Kristof, Nicholas and Sheryl WuDunn. Half the Sky: Turning Oppression into Opportunities for Women Worldwide. Knopf, 2009. ISBN 978-0-307-26714-6
- Jian Lee, Deborah; Subramanian, Sushma (15 November 2011). "A Single Man: One Chinese Bachelor's Search for Love". Pulitzer Center on Crisis Reporting.
- Bauer, David (January 2015). "A story of drinkers, genocide and unborn girls". Quartz.
- Hudson, Valerie M. and den Boer, Andrea M. (2004) Bare Branches: The Security Implications of Asia's Surplus Male Population. The MIT Press. ISBN 0262582643.
- Florida, Richard (30 March 2008). "A singles map of the United States of America". The Boston Globe.
- Kvasnicka, Michael; Bethmann, Dirk (1 October 2007). "World War II, Missing Men, and out-of-wedlock childbearing" (PDF). The Institute of Economic Research, Korea University. 07-30. Cite journal requires
|journal=(help) - Clutton-Brock, T. (2007). "Sexual Selection in Males and Females". Science. 318 (5858): 1882–1885. Bibcode:2007Sci...318.1882C. doi:10.1126/science.1133311. PMID 18096798.
- Kvarnemo, C.; Ahnesjo, I. (1996). "The dynamics of operational sex ratios and competition for mates". Trends in Ecology & Evolution. 11 (10): 404–408. doi:10.1016/0169-5347(96)10056-2.
- Emlen, S.T. (1976). "Lek organization and mating strategies in the bullfrog". Behavioral Ecology and Sociobiology. 1 (3): 283–313. doi:10.1007/bf00300069. JSTOR 4599103.
- Emlen, S.T.; Oring, L.W. (1977). "Ecology, Sexual Selection, and the Evolution of Mating Systems". Science. 197 (4300): 215–223. Bibcode:1977Sci...197..215E. doi:10.1126/science.327542. PMID 327542.
- Sutter, John D. "Opinion: Nope, not too many men in Alaska". CNN.
- Dynamics of Indigenous Demographic Fluctuations: Lessons from Sixteenth-Century Cusco, Peru R. Alan Covey, Geoff Childs, Rebecca Kippen Source: Current Anthropology, Vol. 52, No. 3 (June 2011), pp. 335–360: The University of Chicago Press
- Louis, Henry (1975). "Schema d'Evolution des Marriages apres de Grandes Variations des Naissances". Population. 30 (759): 779. doi:10.2307/1530481. JSTOR 1530481.
- Heer, David M.; Grossbard-Shechtman, Amyra (1981). "The Impact of the Female Marriage Squeeze and the Contraceptive Revolution on Sex Roles and the Women's Liberation Movement in the United States, 1960 to 1975". Journal of Marriage and the Family. 43 (1): 49–65. doi:10.2307/351416. JSTOR 351416.
- Shoshana Grossbard-Shechtman (1993), On the Economics of Marriage – A Theory of Marriage, Labor and Divorce. Boulder, CO: Westview Press.
- Guttentag, Marcia and Secord, Paul F. (1983), Too Many Women: The Sex Ratio Question. Beverly Hills: Sage Publications
- Grossbard-Shechtman, Shoshana and Granger, Clive W. (September 1998). "Women’s Jobs and Marriage, Baby-Boom versus Baby-Bust," Population, 53: 731–52 (in French)
- Amuedo-Dorantes, Catalina; Grossbard, Shoshana (2007). "Marriage Markets and Women's Labor Force Participation". Review of Economics of the Household. 5 (3): 249–278. doi:10.1007/s11150-007-9014-1. hdl:10419/34677.
- d'Alessio, Stewart J.; Stolzenberg, Lisa (2010). "The sex ratio and male-on-female intimate partner violence". Journal of Criminal Justice. 38 (4): 555. doi:10.1016/j.jcrimjus.2010.04.026.
- Brian, Éric; Jaisson, Marie (2007). "Physico-Theology and Mathematics (1710–1794)". The Descent of Human Sex Ratio at Birth. Springer Science & Business Media. pp. 1–25. ISBN 978-1-4020-6036-6.
- John Arbuthnot (1710). "An argument for Divine Providence, taken from the constant regularity observed in the births of both sexes" (PDF). Philosophical Transactions of the Royal Society of London. 27 (325–336): 186–190. doi:10.1098/rstl.1710.0011.
- Conover, W.J. (1999), "Chapter 3.4: The Sign Test", Practical Nonparametric Statistics (Third ed.), Wiley, pp. 157–176, ISBN 0-471-16068-7
- Sprent, P. (1989), Applied Nonparametric Statistical Methods (Second ed.), Chapman & Hall, ISBN 0-412-44980-3
- Stigler, Stephen M. (1986). The History of Statistics: The Measurement of Uncertainty Before 1900. Harvard University Press. pp. 225–226. Bibcode:1986hsmu.book.....S. ISBN 0-67440341-X.
- Bellhouse, P. (2001), "John Arbuthnot", in Statisticians of the Centuries by C.C. Heyde and E. Seneta, Springer, pp. 39–42, ISBN 0-387-95329-9
- Hald, Anders (1998), "Chapter 4. Chance or Design: Tests of Significance", A History of Mathematical Statistics from 1750 to 1930, Wiley, p. 65
- Laplace, P. (1778). "Mémoire sur les probabilités" (PDF). Mémoires de l'Académie royale des sciences de Paris. 9: 227–332.
- Laplace, P. (1778). "Mémoire sur les probabilités (XIX, XX)". Oeuvres complètes de Laplace. Mémoires de l'Académie royale des sciences de Paris. 9. pp. 429–438.
- Stigler, Stephen M. (1986). The History of Statistics: The Measurement of Uncertainty before 1900. Cambridge, Mass: Belknap Press of Harvard University Press. p. 134. Bibcode:1986hsmu.book.....S. ISBN 0-674-40340-1.