Greater London
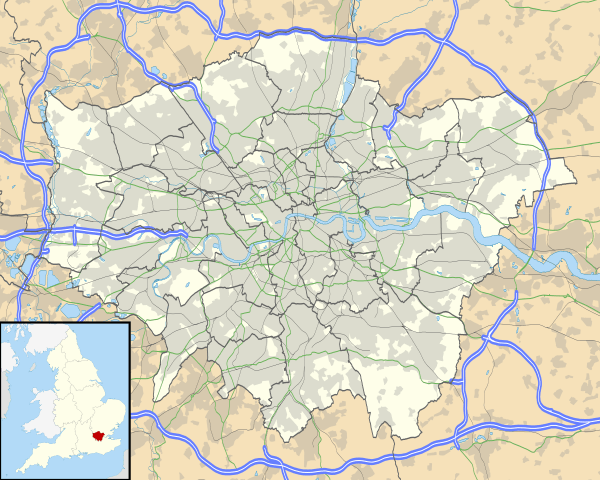
Greater London is a ceremonial county of England that makes up the majority of the London region. This region forms the administrative boundaries of London and is organised into 33 local government districts—the 32 London boroughs and the City of London, which is located within the region but is separate from the county. The Greater London Authority, based in Southwark, is responsible for strategic local government across the region and consists of the Mayor of London and the London Assembly. The City of London Corporation is the principal local authority for the City of London, with a similar role to that of the 32 London borough councils.
| Greater London London region | |
|---|---|
| Ceremonial county and region | |
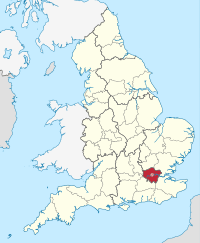 Greater London county (red) City of London (red & white stripes) London region (both) | |
| Coordinates: 51°30′N 0°5′W | |
| Sovereign state | United Kingdom |
| Constituent country | England |
| Established | 1 April 1965 |
| Established by | London Government Act 1963 |
| Ceremonial county | |
| Lord Lieutenant | Ken Olisa |
| High Sheriff | John Garbutt [1](2020–21) |
| Area | 1,569 km2 (606 sq mi) |
| • Ranked | 25th of 48 |
| Population (mid-2018 est.) | 8,899,375 |
| • Ranked | 1st of 48 |
| Density | 5,671/km2 (14,690/sq mi) |
| Ethnicity | 59.8% White (of which 44.9% White British) 18.4% Asian 13.3% Black 5% mixed 3.4% other |
| Region | |
| Government | Greater London Authority • Mayor Sadiq Khan • London Assembly |
| Admin HQ | Southwark |
| Area | 1,572 km2 (607 sq mi) |
| Population | 8,546,761 (mid-2014 estimate)[2] |
| Density | 5,437/km2 (14,080/sq mi) |
| ONS code | H |
| GSS code | E12000007 |
| NUTS | UKI |
| Website | |
 | |
| Counties |
|
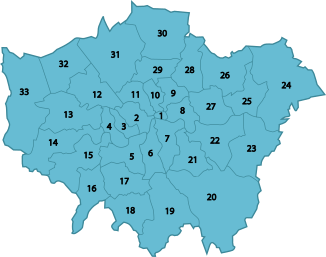 Districts of Greater London | |
| Districts | 33 districts
|
| Members of Parliament | 73 MPs |
| Police | City of London Police and Metropolitan Police |
| Time zone | Greenwich Mean Time (UTC) |
| • Summer (DST) | British Summer Time (UTC+1) |
Administratively, Greater London was first established as a sui generis council area under the Greater London Council between 1963 and 1986. The county of Greater London was created on 1 April 1965 through the London Government Act 1963. The area was re-established as a region in 1994. The Greater London Authority was formed in 2000.[3][4][5]
The region covers 1,572 km2 (607 sq mi) and had a population of 8,174,000 at the 2011 census.[6][7][8][9] The Greater London Built-up Area is used in some national statistics and is a measure of the continuous urban area and includes areas outside the administrative region.
History
The term Greater London has been and still is used to describe different areas in governance, statistics, history and common parlance.
In terms of ceremonial counties, London is divided into the small City of London and the much wider Greater London. This arrangement has come about because as the area of London grew and absorbed neighbouring settlements, a series of administrative reforms did not amalgamate the City of London with the surrounding metropolitan area, and its unique political structure was retained. Outside the limited boundaries of the City, a variety of arrangements has governed the wider area since 1855, culminating in the creation of the Greater London administrative area in 1965.
The term Greater London was used well before 1965, particularly to refer to the Metropolitan Police District (such as in the 1901 census),[10] the area of the Metropolitan Water Board (favoured by the London County Council for statistics),[11] the London Passenger Transport Area and the area defined by the Registrar General as the Greater London Conurbation.[12] The Greater London Arterial Road Programme was devised between 1913 and 1916.[13] One of the larger early forms was the Greater London Planning Region, devised in 1927, which occupied 1,856 square miles (4,810 km2) and included 9 million people.[11]
Proposals to expand the County of London
Although the London County Council (LCC) was created covering the County of London in 1889, the county did not cover all the built-up area, particularly West Ham and East Ham, and many of the LCC housing projects, including the vast Becontree Estates, were outside its boundaries.[14] The LCC pressed for an alteration in its boundaries soon after the end of the First World War, noting that within the Metropolitan and City Police Districts there were 122 housing authorities. A Royal Commission on London Government was set up to consider the issue.[15][16] The LCC proposed a vast new area for Greater London, with a boundary somewhere between the Metropolitan Police District and the home counties.[17] Protests were made at the possibility of including Windsor, Slough and Eton in the authority.[18] The Commission made its report in 1923, rejecting the LCC's scheme. Two minority reports favoured change beyond the amalgamation of smaller urban districts, including both smaller borough councils and a central authority for strategic functions. The London Traffic Act 1924 was a result of the Commission.[19] Reform of local government in the County of London and its environs was next considered by the Royal Commission on Local Government in Greater London, chaired by Sir Edwin Herbert, which issued the 'Herbert Report' after three years of work in 1960. The commission applied three tests to decide if a community should form part of Greater London: how strong is the area as an independent centre in its own right; how strong are its ties to London; and how strongly is it drawn outwards towards the country rather than inwards towards London.

Greater London is formally created
Greater London was formally created by the London Government Act 1963, which came into force on 1 April 1965, replacing the administrative counties of Middlesex and London, including the City of London, where the London County Council had limited powers, and absorbing parts of Essex, Hertfordshire, Kent and Surrey. Greater London originally had a two-tier system of local government, with the Greater London Council (GLC) sharing power with the City of London Corporation (governing the small City of London) and the 32 London Borough councils. The GLC was abolished in 1986 by the Local Government Act 1985. Its functions were devolved to the City Corporation and the London Boroughs, with some functions transferred to central government and joint boards.[20] Greater London formed the London region in 1994.
The 1998 London referendum established a public will to recreate an upper tier of government to cover the region. The Greater London Authority, London Assembly and the directly elected Mayor of London were created in 2000 by the Greater London Authority Act 1999. In 2000, the outer boundary of the Metropolitan Police District was re-aligned to the Greater London boundary. The 2000 and 2004 mayoral elections were won by Ken Livingstone (L), who had been the final leader of the GLC. The 2008 and 2012 elections were won by Boris Johnson (C). The 2016 election was won by Sadiq Khan (L). London was covered by a single Parliamentary constituency in the European Parliament prior to the departure of the United Kingdom from the European Union.
Geography
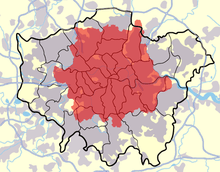
Greater London includes the most closely associated parts of the Greater London Urban Area and their historic buffers and includes, in five boroughs, significant parts of the Metropolitan Green Belt which protects designated greenfield land in a similar way to the city's parks. The closest and furthest boundaries are with Essex to the northeast between Sewardstonebury next to Epping Forest and Chingford and with the Mar Dyke between Bulphan and North Ockendon. Greater London is also bounded by Hertfordshire to the north, Berkshire and Buckinghamshire to the west, Kent to the southeast and Surrey to the south and southwest. The highest point is Westerham Heights, in the North Downs and on the boundary with Kent, at 245 metres (804 ft). Central government has implemented small boundary changes. The greatest were the 1969 transfers of Farleigh to Surrey and Knockholt to Kent.[21] Others have included exchange of two Thames islands with Surrey and adjustments during the 1990s to parts of the boundaries of three boroughs near the M25.[22] The only part of Greater London outside the motorway is North Ockendon, the furthest land unit from its centre. The majority of Greater London forms the London low emission zone.
The London postal district does not cover all of Greater London.[23][24][25]
Governance
.jpg) |
|---|
| This article is part of a series on the politics and government of London |
|
Greater London Authority
|
|
London Councils
|
|
London in the UK
|
|
|
Mayor of London
The Mayor of London is a directly elected politician who, along with the London Assembly, is responsible for the strategic government of Greater London.
London Assembly
For elections to the London Assembly, London is divided into 14 constituencies, each formed from two or three boroughs. The City of London forms part of the City and East constituency.
UK Parliament
London is divided into 73 Parliamentary borough constituencies, formed from the combined area of several wards from one or more boroughs. Typically a borough is covered by two or three constituencies.
Status
The London region does not have city status granted by the Crown. The Cities of London and Westminster within it have received formal city status.[26][note 1] Despite this, Greater London is commonly regarded as a city in the general senses of a conurbation and a municipality. A Lord Lieutenant of Greater London is appointed for its area, excluding the City of London. For the purposes of the Lieutenancies Act 1997, this area is defined as a county.[27]
The term "London" usually refers to region or to the conurbation, but not often to the ancient, tiny City of London.[3][28] That small area is often referred to as "the City" or "the Square Mile" and it forms the main financial district. Archaically, the urbanised area of London was known as the Metropolis. In common usage, the terms "London" and "Greater London" are usually used interchangeably.[3] Greater London is officially divided for some purposes, with varying definitions, into Inner London and Outer London. For some strategic planning purposes it is divided into five sub-regions.
Strategic local government
Greater London is under the strategic local governance of the Greater London Authority (GLA).[29] It consists of an elected assembly, the London Assembly, and an executive head, the Mayor of London.[30]
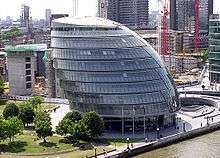
The current Mayor (not to be confused with the Lord Mayor of London) is Sadiq Khan. He is scrutinised by the elected London Assembly, which may amend his annual budget (by two-thirds majority) but otherwise lacks the power to block his directives. The headquarters of the GLA is at City Hall in Southwark. The Mayor is responsible for Greater London's strategic planning and is required to produce or amend the London Plan each electoral cycle.
Local government
Greater London is divided into 32 London Boroughs, each governed by a London Borough council. The City of London has a unique government dating back to the 12th century and is separate from the county of Greater London, although is still part of the region served by the Greater London Authority.[3]
All London Borough councils belong to the London Councils association. Three London Boroughs carry the honorific title of Royal Borough: Kensington and Chelsea, Kingston, and Greenwich. Within the City of London are the liberties of Middle Temple and Inner Temple.
Demography
| 2011 United Kingdom Census[31] | |
|---|---|
| Country of birth | Population |
| 5,175,677 | |
| 262,247 | |
| 158,300 | |
| 129,807 | |
| 114,718 | |
| 112,457 | |
| 109,948 | |
| 87,467 | |
| 84,542 | |
| 66,654 | |
| 65,333 | |
| 64,212 | |
| 63,920 | |
| 62,896 | |
| 62,050 | |
| 59,596 | |
| 57,765 | |
| 55,476 | |
| 53,959 | |
| 44,848 | |
| 44,199 | |
| 43,428 | |
| 41,041 | |
| 39,817 | |
| 39,452 | |
| 37,680 | |
| 37,339 | |
| 35,880 | |
| 32,136 | |
| 31,357 | |
With increasing industrialisation, London's population grew rapidly throughout the 19th and early 20th centuries, and it was the most populated city in the world until overtaken by New York in 1925. Its population peaked at 8,615,245 in 1939. There were an estimated 7,753,600 official residents in mid-2009.[32]
London's wider metropolitan area has a population of between 12 and 14 million depending on the definition of that area. According to Eurostat, London has been the most populous city and metropolitan area of the European Union.
The region covers an area of 1,579 square kilometres. The population density is 4,761 people per square kilometre, more than ten times that of any other British region. In terms of population, London is the 25th largest city and the 17th largest metropolitan region in the world. It is ranked 4th in the world in the number of US dollar billionaires residing in the city. It ranks as one of the most expensive cities in the world, alongside Tokyo and Moscow.
Ethnic groups
In the 2001 UK Census, 71.15% of the population classed their ethnic group as White, including White British (59.79%), White Irish (3.07%) or "Other White" (8.29%, mostly Greek-Cypriot, Italian, Polish and Portuguese). 12.09% classed themselves as British Asian, including Indian, Pakistani, Bangladeshi and "Other Asian" (mostly Sri Lankan, Arab and other Southern Asian ethnicities). 10.91% classed themselves as Black British (around 6% as Black African, 4% as Black Caribbean, 0.84% as "Other Black"). 3.15% were of mixed race; 1.12% as Chinese; and 1.58% as other (mostly Filipino, Japanese, Korean, Vietnamese and other "British Orientals"). 21.8% of inhabitants were born outside the European Union. Irish people, from both the Republic of Ireland and Northern Ireland, number about 200,000, as do the Scots and Welsh combined.
In January 2005, a survey of London's ethnic and religious diversity claimed that there were more than 300 languages spoken and more than 50 non-indigenous communities with a population of more than 10,000. Figures from the Office for National Statistics show that in 2006 London's foreign-born population was 2,288,000 (31%), up from 1,630,000 in 1997. The 2001 UK Census showed that 27.1% of the population were born outside the UK, and a slightly higher proportion were classed as Non-White.
In the 2011 UK Census, 59.79% of the population classed their ethnic group as White, including White British (44.89%), White Irish (2.15%) or "Other White" (12.65%, mostly Greek-Cypriot, Italian, Polish, Spanish, Colombians and Portuguese). 18.49% classed themselves as British Asian, including Indian, Pakistani, Bangladeshi and "Other Asian" (mostly Sri Lankan, Arab and other Southern Asian ethnicities). 13.32% classed themselves as Black British (7% as Black African, 4.22% as Black Caribbean, 2.08% as "Other Black"). 4.96% were of mixed race; and 3.44% as other (mostly Filipino, Japanese, Korean, Vietnamese and other "British Orientals").
The table shows the top 21 countries of birth of residents in 2011, the date of the last UK Census.[33] These figures do not give a fair indication of the total population of the specific ethnic groups associated with each country. For example, Londoners of Greek origin (from both Greece and Cyprus) number 300,000, since an organised Greek community has been established for nearly two centuries. The same can be said for Italian and French Londoners whose communities have been here for centuries (the French Embassy estimates there are between 300,000 and 400,000 French citizens living in the UK, with "a huge majority of them living in London").[34] Though a Polish community has existed in London since the late-Middle Ages, it was not significant in the 2001 Census but has grown significantly since 2004, when Poland joined the European Union and by June 2010; London had 122,000 Polish residents.[35] The German-born population figure may be misleading, however, because it includes British nationals born to parents serving in the British armed forces in Germany.
London has been a focus for immigration for centuries, whether as a place of safety or for economic reasons. Huguenots, Eastern European Jews, Cypriots and East African Asians are examples of the former; Irish, Bangladeshis and West Indians came for new lives. The East End district around Spitalfields has been first home for several ethnic groups, which have subsequently moved elsewhere in London as they gained prosperity.
| Ethnic group | 2001[36] | 2011[37] | ||
|---|---|---|---|---|
| Number | % | Number | % | |
| White: British | 4,287,861 | 59.79% | 3,669,284 | 44.89% |
| White: Irish | 220,488 | 3.07% | 175,974 | 2.15% |
| White: Gypsy or Irish Traveller[Note 1] | N/A | 8,196 | 0.10% | |
| White: Other | 594,854 | 8.29% | 1,033,981 | 12.65% |
| White: subtotal | 5,103,203 | 71.15% | 4,887,435 | 59.79% |
| Asian or Asian British: Indian | 436,993 | 6.09% | 542,857 | 6.64% |
| Asian or Asian British: Pakistani | 142,749 | 1.99% | 223,797 | 2.74% |
| Asian or Asian British: Bangladeshi | 153,893 | 2.15% | 222,127 | 2.72% |
| Asian or Asian British: Chinese[Note 2] | 80,201 | 1.12% | 124,250 | 1.52% |
| Asian or Asian British: Other Asian | 133,058 | 1.86% | 398,515 | 4.88% |
| Asian or Asian British: subtotal | 946,894 | 13.20% | 1,511,546 | 18.49% |
| Black or Black British: African | 378,933 | 5.28% | 573,931 | 7.02% |
| Black or Black British: Caribbean | 343,567 | 4.79% | 344,597 | 4.22% |
| Black or Black British: Other Black | 60,349 | 0.84% | 170,112 | 2.08% |
| Black or Black British: subtotal | 782,849 | 10.92% | 1,088,640 | 13.32% |
| Mixed: White and Black Caribbean | 70,928 | 0.99% | 119,425 | 1.46% |
| Mixed: White and Black African | 34,182 | 0.48% | 65,479 | 0.80% |
| Mixed: White and Asian | 59,944 | 0.84% | 101,500 | 1.24% |
| Mixed: Other Mixed | 61,057 | 0.85% | 118,875 | 1.45% |
| Mixed: subtotal | 226,111 | 3.15% | 405,279 | 4.96% |
| Other: Arab[Note 1] | N/A | 106,020 | 1.30% | |
| Other: Any other ethnic group | 113,034 | 1.58% | 175,021 | 2.14% |
| Other: subtotal | 113,034 | 1.58% | 281,041 | 3.44% |
| Total | 7,172,091 | 100.00% | 8,173,941 | 100.00% |
- New category created for the 2011 census.
- In 2001, listed under the 'Other ethnic group' heading.
Population
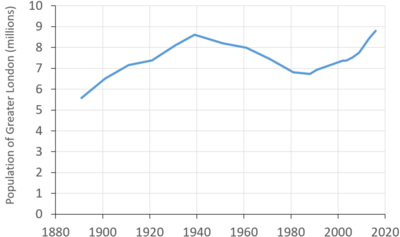
The population of the current area of Greater London rose from about 1.1 million in 1801 (when only about 850,000 people were in the urban area, while 250,000 were living in villages and towns not yet part of London) to an estimated 8.6 million in 1939, but declined to 6.7 million in 1988, before starting to rebound in the 1990s.
By 2006, the population had recovered to the level of 1970 (and the level of population in the 1920s). It is now approaching the 1939 peak.
Figures here are for Greater London in its 2001 boundaries. Figures before 1971 have been reconstructed by the Office for National Statistics based on past censuses to fit the 2001 boundaries. Figures from 1981 onward are mid-year estimates (revised in August 2007), which are more accurate than the censuses, known to underestimate the population of London.
| 1891 | 5–6 April | 5,572,012 |
| 1901 | 31 March – 1 April | 6,506,954 |
| 1911 | 2–3 April | 7,160,525 |
| 1921 | 19–20 June | 7,386,848 |
| 1931 | 26–27 April | 8,110,480 |
| 1939 | Mid-year estimate | 8,615,245 |
| 1951 | 8–9 April | 8,196,978 |
| 1961 | 23–24 April | 7,992,616 |
| 1965 | Greater London formally created | |
| 1971 | 25–26 April | 7,452,520 |
| 1981 | Mid-year estimate | 6,805,000[40] |
| 1988 | Mid-year estimate | 6,729,300[41] |
| 1991 | Mid-year estimate | 6,829,300[42] |
| 2001 | Mid-year estimate | 7,322,400[43] |
| 2002 | Mid-year estimate | 7,361,600[44] |
| 2003 | Mid-year estimate | 7,364,100[45] |
| 2004 | Mid-year estimate | 7,389,100[46] |
| 2005 | Mid-year estimate | 7,456,100[47] |
| 2006 | Mid-year estimate | 7,512,400[7] |
| 2009 | Mid-year estimate | 7,753,600[7] |
| 2013 | Mid-year estimate | 8,416,535[48] |
| 2014 | Mid-year estimate | 8,546,761[2] |
| 2016 | Mid-year estimate | 8,798,957[39] |
Economy
This is a chart of trend of regional gross value added (GVA) of Inner London at current basic prices published (pp. 240–253) by Office for National Statistics with figures in millions of British Pounds Sterling.
| Year | Regional Gross Value Added[49] | Agriculture[50] | Industry[51] | Services[52] |
|---|---|---|---|---|
| 1995 | 64,616 | 7 | 8,147 | 56,461 |
| 2000 | 92,330 | 6 | 10,094 | 82,229 |
| 2003 | 112,090 | 12 | 10,154 | 101,924 |
Eurostat data shows the GDP of Inner London to be 232 billion euros in 2009[53] and per capita GDP of 78,000 euros.
This is a chart of trend of regional gross value added of Outer London at current basic prices published (pp. 240–253) by Office for National Statistics with figures in millions of British Pounds Sterling.
| Year | Regional Gross Value Added[49] | Agriculture[50] | Industry[51] | Services[52] |
|---|---|---|---|---|
| 1995 | 44,160 | 51 | 10,801 | 33,307 |
| 2000 | 60,304 | 43 | 12,529 | 47,732 |
| 2003 | 69,420 | 69 | 13,081 | 54,462 |
Eurostat data shows the GDP of Outer London to be 103 billion euros in 2009[53] and per capita GDP of 21,460 euros.
Religion
The largest religious groupings are Christian (48.4%), Muslim (12.4%), Hindu (5.1%), Jewish (1.8%), and Sikh (1.5%), alongside those of no religion (20.7%). The United Kingdom has traditionally been Christian, and London has a large number of churches, particularly in the City. St Paul's Cathedral in the City and Southwark Cathedral south of the river are Anglican administrative centres, while the clerical head of the Church of England and the worldwide Anglican Communion, the Archbishop of Canterbury, has his main residence at Lambeth Palace in the London Borough of Lambeth.
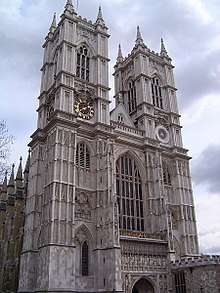
Important national and royal ceremonies are shared between St Paul's and Westminster Abbey. The Abbey is not to be confused with nearby Westminster Cathedral, the largest Roman Catholic cathedral in England and Wales. Religious practice in London is lower than in any other part of the UK or Western Europe and is around seven times lower than American averages. Despite the prevalence of Anglican churches, weekly observance is low within that denomination, although in recent years church attendance, particularly at evangelical Anglican churches in London, has started to increase.
London is home to sizeable Hindu, Sikh, Muslim and Jewish communities. Many Muslims live in Tower Hamlets and Newham; the most important Muslim buildings are the East London Mosque in Whitechapel and the London Central Mosque on the edge of Regent's Park. London's large Hindu community is in the north-western boroughs of Harrow and Brent, the latter containing one of Europe's largest Hindu temples, BAPS Shri Swaminarayan Mandir London.
Sikh communities are in East and West London, particularly Southall in the western borough of Ealing, which is also home to the largest Sikh temple in the capital. The majority of British Jews live in London, with significant communities in Stamford Hill (the most Orthodox Jewish area outside New York City and Israel) and St. John's Wood, Golders Green, and Edgware in North London.
Education
Publicly funded education has been administered through 33 LEAs, which correspond to the City of London and the 32 London boroughs, since the 1990 enactment of the Education Reform Act 1988.[54] From 1965 to 1990, 12 Inner London boroughs and the City of London were served by the Inner London Education Authority.[54]
The introduction of comprehensive schools, directed by Circular 10/65 in 1965, was mostly followed in Greater London; however, 19 grammar schools have been retained in some Outer London boroughs,[55] with Sutton having the most with five, followed by Bexley with four and others in five other boroughs. In these boroughs the state schools outperform the (relatively few) independent schools. In inner London, private schools always get the best results and are larger in number. At GCSE and A level, Outer London boroughs have broadly better results than Inner London boroughs.[56]
At GCSE, the best borough is Kingston upon Thames, closely followed by Sutton. Both boroughs have selective schools, and get the top two average GCSE results in England for LEAs. Next is Kensington and Chelsea, the third best in England, then Redbridge, Hammersmith and Fulham, Bromley, Barnet and Harrow. Only ten boroughs have GCSE results under the England average, and some inner-London boroughs have surprisingly good results considering where they lie on the scale of deprivation, e.g. Lambeth. Overall at GCSE in 2009, Greater London had the best results for regions of England. Greater London is generally a prosperous region, and prosperous areas generally have good GCSE results. The City of London has no state schools, just two independent schools. Haringey and Kensington and Chelsea have the most people that pass no GCSEs.
At A-level, the average results for LEAs are disappointing compared to their good GCSE results. Although Kingston upon Thames gets the best GCSE results in England, at A-level it is not even above average. Sutton gets the best A-level results in London and in England. Three of the schools in the top four at A-level in London are in Sutton. It has only one independent school. The few other boroughs with above-average A-level results are Havering, Barnet, Bexley, Redbridge, and Ealing. The poor A-level results in many London boroughs is explained by the quantity of independent schools getting good A-level results. The state school system is often bypassed at age 16 by the more able pupils. Some London boroughs need more good sixth form colleges.
The region's 34 further education colleges are funded through the Skills Funding Agency and the Young People's Learning Agency. Large colleges include Kingston College, Havering College of Further and Higher Education, and Croydon College.
Universities
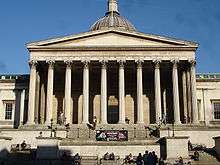
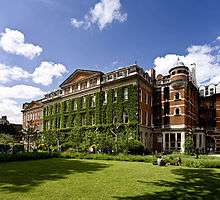
The University of London has 20 federated colleges and schools. The two main constituents of the University of London are (in order of total funding) University College London (UCL) and King's College London (KCL). Imperial College was part of the University of London until 2007, and is now an independent university. UCL, KCL and Imperial have very large research grants – some of the largest in England after Cambridge and Oxford, UCL and Imperial receive around £600 million each which is more than twice as much as any other in the region. The next largest institution by funding is Queen Mary University of London, followed by City, University of London. The region has many medical schools although these are part of other institutions such as UCL, KCL and Imperial. The Royal Veterinary College is based in Camden (with another site in North Mymms in Hertfordshire).
50% of students come from the region, and around 30% from other regions. Most students from other regions come from South East England, the East of England, and, to a lesser degree, South West England; the vast majority are from the south of England. Over 50% students native to the region stay in the region, with 15% going to South East England, 30% to either Scotland, Wales or the North East and around 5% go elsewhere. London is a draw for UK graduates from all over the UK.
Over 70% of UK students to graduate from the University of London remain in London; just under 15% go to the South-East, and just over 5% go to the East of England and 10% elsewhere.
Twin cities
The GLA has twin and sister city agreements with the following cities.[57]
| China | Shanghai | Shanghai Municipality | 2009[58] | |
|---|---|---|---|---|
| China | Beijing | Beijing Municipality | 2006[59] | |
| France | Paris | Île-de-France | ||
| Germany | Berlin | Berlin | 2000 | |
| Russia | Moscow | Russian federal city | ||
| United States | New York City | New York | 2001[60] | |
| Japan | Tokyo | Tokyo | 2005 |
For Borough twinning, see List of twin towns and sister cities in England#London.
See also
- Geographical
- Central London
- Inner London
- Outer London
- London boroughs
- Greater London Urban Area
- London commuter belt
- Metropolitan Police District
- M25 motorway
- Political
- Mayor of London
- List of Lord Lieutenants of Greater London
- List of High Sheriffs of Greater London
- London Plan
- City of London
- Historical
- Metropolitan Board of Works
- County of London
- Greater London Council
- Others
- Global city
- Greater London Area War Risk Study
- Megacity
- Metropolis
Notes
- Croydon and Southwark have made several failed applications for city status.
References
- "No. 62943". The London Gazette. 13 March 2020. p. 5161.
- "MYE2: Population Estimates by single year of age and sex for local authorities in the UK, mid-2014". ONS. Office for National Statistics. Retrieved 9 July 2015.
- Travers, T., The Politics of London, (2004)
- "London Government Act 1963" (PDF). Legislation.gov.uk. Retrieved 19 August 2017.
- "Administration of Justice Act 1964" (PDF). Legislation.gov.uk. Retrieved 19 August 2017.
- Watson, Jo (25 July 2009). "Access to Nature Regional Targeting Plan – LONDON" (PDF). Natural England. Archived from the original (PDF) on 14 July 2014.
- "T 08: 2011 Census – Population and Household Estimates for England and Wales, March 2011" (PDF). Office for National Statistics. 16 July 2012. Retrieved 16 July 2012.
- "Regional Gross Value Added highest in London in 2012". Office for National Statistics. ONS (2014). Retrieved 17 September 2014.
- Glass, R., London: aspects of change (1964).
- Vision of Britain -Census 1901: Preliminary Report
- Young, K. & Garside, P., Metropolitan London: Politics and Urban Change, (1982)
- Westergaard, J., The Structure of Greater London, London: Aspects of Change, (1961)
- The Motorway Archive — The origins of the London Orbital Motorway (M25) Archived 20 July 2009 at the Wayback Machine
- Saint, A., Politics and the people of London: the London County Council (1889–1965), (1989)
- London Local Government. The Times. 18 April 1921.
- Complex London: Big Task For Inquiry Commission. The Times. 5 August 1921.
- Greater London: Case for Central Authority: Area and Powers. The Times. 14 December 1921.
- Windsor and Greater London: Protests Against Proposals. The Times. 27 December 1921
- Greater London: Report of Royal Commission. The Times. 22 March 1923.
- 'The Government of London: the struggle for reform' by Gerald Rhodes (London: Weidenfeld and Nicolson 1970 ISBN 0-297-00031-4
- The Greater London, Kent and Surrey Order, 1968
- The Greater London and Surrey Order, 1970
- Joshua Fowler (5 July 2013). "London Government Act: Essex, Kent, Surrey and Middlesex 50 years on". BBC News.
- Westminster, Department of the Official Report (Hansard), House of Commons. "House of Commons Hansard Debates for 23 Jun 2009 (pt 0008)". Publications.parliament.uk. Retrieved 19 August 2017.
- Royal Mail (2004)
- Westminster City Council – One City — An Introduction Archived 22 May 2009 at the Wayback Machine
- HMSO, Lieutenancies Act 1997, (1997)
- Mills, A., Dictionary of London Place Names, (2001), Oxford
- Jones, B. et al., Politics UK, (2004)
- Arden Chambers Barristers, A Guide to the Greater London Authority Act, (2000)
- "Table QS213EW 2011 Census: Country of birth (expanded), regions in England and Wales". Office for National Statistics. 26 March 2013. Retrieved 15 July 2015.
- "2009 Round Demographic Projections for the London Plan" (PDF). web.archive.org. 2 April 2013. Archived from the original on 2 April 2013. Retrieved 17 January 2020.
- "Greater London Authority – Summary of 'Country-of-Birth' in London" (PDF). Greater London Authority. Archived from the original (PDF) on 27 May 2008. Retrieved 6 June 2008.
- "London, France's sixth biggest city". BBC News. 30 May 2012.
- "Polish people in the UK". Office for National Statistics. 24 February 2011. Archived from the original on 5 March 2011.
- "2001 census – theme tables". NOMIS. Retrieved 5 September 2014.
- "Ethnic Group by measures". NOMIS. Retrieved 2 September 2014.
- http://www.statistics.gov.uk/statbase/ssdataset.asp?vlnk=6802&More=Y
- https://data.london.gov.uk/dataset/2016-mid-year-estimates
- "T 08: Quinary age group and sex for local authorities in England and Wales; estimated resident population based on the 1991 Census; Mid-1981 Population Estimates". Office for National Statistics. 22 August 2007. Retrieved 22 August 2007.
- "T 08h: Mid-1988 Population Estimates; Quinary age groups and sex for local authorities in England and Wales; estimated resident population revised in light of results of the 2001 Census". Office for National Statistics. 22 August 2007. Retrieved 22 August 2007.
- "T 09a: Mid-1991 Population Estimates; Quinary age groups and sex for local authorities in the United Kingdom; estimated resident population". Office for National Statistics. 22 August 2007. Retrieved 22 August 2007.
- "T 08: Selected age groups for local authorities in the United Kingdom; estimated resident population; revised in light of the local authority population studies; Mid-2001 Population Estimates". Office for National Statistics. 22 August 2007. Retrieved 22 August 2007.
- "T 09L: Quinary age groups and sex for local authorities in the United Kingdom; estimated resident population Mid-2002 Population Estimates; reflecting the revisions due to improved international migration". Office for National Statistics. 22 August 2007. Retrieved 22 August 2007.
- "T 09m: Quinary age groups and sex for local authorities in the United Kingdom; estimated resident population Mid-2003 Population Estimates; reflecting the revisions due to improved international migration". Office for National Statistics. 22 August 2007. Retrieved 22 August 2007.
- "T 09n: Quinary age groups and sex for local authorities in the United Kingdom; estimated resident population Mid-2004 Population Estimates; reflecting the revisions due to improved international migration". Office for National Statistics. 22 August 2007. Retrieved 22 August 2007.
- "T 09p: Quinary age groups and sex for local authorities in the United Kingdom; estimated resident population Mid-2005 Population Estimates; reflecting the revisions due to improved international migration". Office for National Statistics. 22 August 2007. Retrieved 22 August 2007.
- "Population Estimates for UK, England and Wales, Scotland and Northern Ireland, Mid-2013". 26 June 2014. Retrieved 3 July 2014.
- Components may not sum to totals due to rounding
- includes hunting and forestry
- includes energy and construction
- includes financial intermediation services indirectly measured Hi
- "Archived copy" (PDF). Archived from the original (PDF) on 23 March 2012. Retrieved 17 May 2012.CS1 maint: archived copy as title (link)
- Tomlinson, S., Education in a post-welfare society, (2001)
- BBC News – What future for grammar schools?. 15 February 2003.
- OFSTED, Improvements in London schools 2000–06, (2006)
- The Mayor of London's City Partnerships webpage Archived 27 September 2007 at the Wayback Machine
- Sister City Relationships between China and the United Kingdom, Chinese Embassy, 16 July 2015.
- "Beijing, London to be sister cities", China Daily, 11 April 2006. Retrieved on 6 June 2006.
- "Sister City – London". nyc.gov. Archived from the original on 14 January 2007. Retrieved 3 February 2007.
External links
| Wikimedia Commons has media related to Greater London. |
- Greater London Authority
- Greater London Online – London Community News, Information and Business Directory
- Greater London Business Community Directory
- Greater London at Curlie
Neighbouring counties | ||||||||||
|---|---|---|---|---|---|---|---|---|---|---|
| ||||||||||
United Kingdom articles | |||||||||||||||
|---|---|---|---|---|---|---|---|---|---|---|---|---|---|---|---|
| History |
|  | |||||||||||||
| Geography |
| ||||||||||||||
| Politics |
| ||||||||||||||
| Economy |
| ||||||||||||||
| Society |
| ||||||||||||||
| |||||||||||||||
| |||||||||||||||
| Region |
|
|---|---|
| Ceremonial County | |
| Administrative County | |
| District |
|
| Unitary Authority |
|
| Sui-Generis | |
| Civil Parish | |
London commuter belt | ||
|---|---|---|
| Home counties | 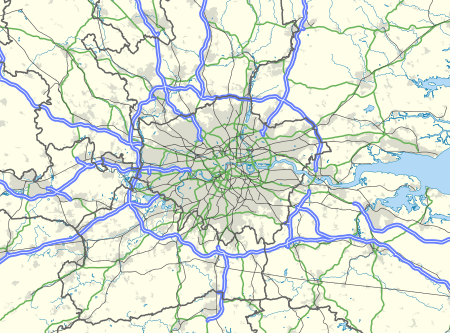 | |
| Urban areas |
| |
| Cities and towns (100k+) | ||
| Towns (25k–99k) |
| |
| Towns (10k–25k) |
| |
History of London | ||
|---|---|---|
| Evolution |
| |
| Periods |
| |
| Events |
| |
| Government |
| |
| Services |
| |
| City of London |
| |
| Structures | ||
| ||