Demographics of Quebec
The demographics of Quebec constitutes a complex and sensitive issue, especially as it relates to the National question. Quebec is the only province in Canada to feature a francophone (French-speaking) majority, and where anglophones (English-speakers) constitute an officially recognized minority group. According to the 2011 census, French is spoken by more than 85.5% of the population while this number rises to 88% for children under 15 years old.[1] According to the 2011 census, 95% of Quebec is francophone, with less than 5% of the population not able to speak French.

Quebec is also home to "one of the world's most valuable founder populations", the Quebec Founder Population.[2] Founder populations are very valuable to medical genetic research as they are pockets of low genetic variability which provide a useful research context for discovering gene-disease linkages. The Quebec Founder Population arose through the influx of people into Quebec from France in the 17th century to mid-18th century; though this influx was large, a high proportion of the immigrants either died or returned to France, leaving a founder population of approximately 2,600 people.[2][3] About seven million Canadians (along with several million French Americans in the United States) are descendants of these original 2,600 colonists.[2]
Population
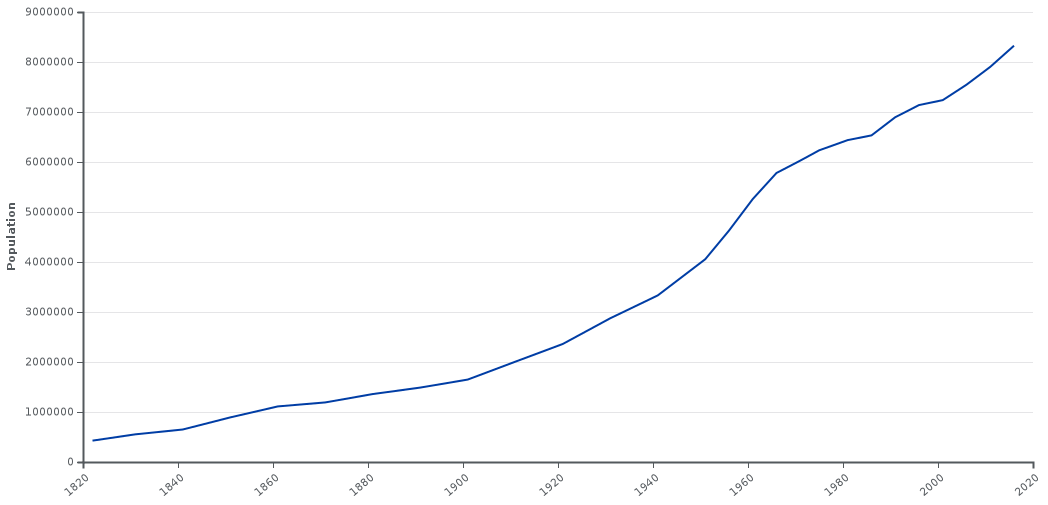
Population since 1824:
| Year | Population | Five-year % change |
Ten-year % change |
% Canada |
|---|---|---|---|---|
| 1822 | 427,465 | n/a | n/a | n/a |
| 1831 | 553,134 | n/a | 29.4 | n/a |
| 1841 | 650,000 | n/a | 17.5 | 60.07[a] |
| 1851 | 892,061 | n/a | 37.0 | 48.32[a] |
| 1861 | 1,111,566 | n/a | 24.9 | 44.42[a] |
| 1871 | 1,191,516 | n/a | 7.9 | 32.3 |
| 1881 | 1,359,027 | n/a | 14.1 | 31.4 |
| 1891 | 1,488,535 | n/a | 9.5 | 30.8 |
| 1901 | 1,648,898 | n/a | 10.8 | 30.7 |
| 1911 | 2,005,776 | n/a | 21.6 | 27.8 |
| 1921 | 2,360,665 | n/a | 17.8 | 26.9 |
| 1931 | 2,874,255 | n/a | 21.8 | 27.7 |
| 1941 | 3,331,882 | n/a | 15.9 | 29.0 |
| 1951 | 4,055,681 | n/a | 21.8 | 28.9 |
| 1956 | 4,628,378 | 14.1 | n/a | 28.8 |
| 1961 | 5,259,211 | 13.6 | 29.7 | 28.8 |
| 1966 | 5,780,845 | 9.9 | 24.9 | 28.8 |
| 1971 | 6,027,765 | 4.3 | 14.6 | 27.9 |
| 1976 | 6,234,445 | 3.4 | 7.8 | 27.1 |
| 1981 | 6,438,403 | 3.3 | 6.8 | 26.4 |
| 1986 | 6,532,460 | 1.5 | 4.8 | 25.8 |
| 1991 | 6,895,963 | 5.6 | 7.1 | 25.2 |
| 1996 | 7,138,795 | 3.5 | 9.3 | 24.5 |
| 2001 | 7,237,479 | 1.4 | 5.0 | 23.8 |
| 2006 | 7,546,131 | 4.3 | 5.7 | 23.4 |
| 2011 | 7,903,001 | 4.7 | 9.2 | 23.1 |
| 2012 | 8,085,900 | n/a | n/a | 23.3 |
| 2013 | 8,155,500 | n/a | n/a | 23.2 |
| 2014 | 8,214,500 | n/a | n/a | 23.1 |
| 2015 | 8,259,500 | n/a | n/a | 23.0 |
| 2016 | 8,326,100 | 5.3 | 16.6 | 23.0 |
| 2017 | 8,398,200 | 3.8 | n/a | 22.0 |
Source: Statistics Canada a % Province of Canada population
Vital statistics
Age structure[4]: (2016 census)
| Age groups | Total | Male | Female |
|---|---|---|---|
| 0–4 years | 444,930 | 227,965 | 216,970 |
| 5–9 years | 469,165 | 240,225 | 228,940 |
| 10–14 years | 419,160 | 214,345 | 204,815 |
| 15–19 years | 429,825 | 219,070 | 210,755 |
| 20-24 years | 500,100 | 252,600 | 247,500 |
| 25-29 years | 495,410 | 248,030 | 247,380 |
| 30-34 years | 515,505 | 256,440 | 259,070 |
| 35–39 years | 550,540 | 274,595 | 275,945 |
| 40–44 years | 506,525 | 254,100 | 252,425 |
| 45–49 years | 519,425 | 260,410 | 259,015 |
| 50–54 years | 619,435 | 309,070 | 310,370 |
| 55–59 years | 636,475 | 314,190 | 322,285 |
| 60–64 years | 562,670 | 276,140 | 286,535 |
| 65-69 years | 488,175 | 236,395 | 251,775 |
| 70-74 years | 373,590 | 176,905 | 196,690 |
| 75-79 years | 256,905 | 116,020 | 140,890 |
| 80-84 years | 187,835 | 78,390 | 109,450 |
| 85 years and over | 188,685 | 61,885 | 126,805 |
| Total | 8,164,360 | 4,016,760 | 4,147,605 |
Quebec's fertility rate is now higher than the Canadian average. At 1.74 children per woman in 2008,[5] it is above the Canada-wide rate of 1.59, and has increased for five consecutive years, reaching its highest level since 1976.[5] However, it is still below the replacement fertility rate of 2.1 children per woman. This contrasts with its fertility rates before 1960, which were among the highest of any industrialized society. For example, between 1951 and 1961, the population grew nearly 30% with minimal immigration, a natural growth rate matched today only by some African countries.
Although Quebec is home to only 23.0% of the population of Canada, the number of international adoptions in Quebec is the highest of all provinces of Canada. In 2001, 42% of international adoptions in Canada were carried out in Quebec.
Population growth rate: 0.7% (2006)
Birth rate: 9.9% (2005)
Synthetic fertility index: 1.61 (2006)
Death rate: 7.4% (2003)
Net migration rate: 4.1% (2003)
Infant mortality rate: 0.46% (2004)
Stillbirth rate: 3.8% -- 3.5% notwithstanding requested abortions (2002)
Life expectancy: In 2002, life expectancy was 76.3 years for males and 81.9 years for females.
Urbanisation: In 2001, 80.4% of Quebecers lived in urban areas.
Literacy: International Adult Literacy Survey 47% Prose, 42% Document, 40% Quantitative (1996) Note: This is not the official literacy rate, and should not be used in comparisons with rates calculated using different procedures.
Languages
Mother tongue language
| Language(s) | 2011 | 2006 | 2001 | 1996 | |||||
|---|---|---|---|---|---|---|---|---|---|
| Population | Percentage (%) | Population | Percentage (%) | Population | Percentage (%) | Population | Percentage (%) | ||
| French | 6,102,210 | 78 | 5,877,660 | 79 | 5,761,765 | 80.8 | 5,742,575 | 80.4 | |
| English | 599,225 | 7.6 | 575,555 | 7.7 | 557,040 | 7.8 | 568,405 | 8.0 | |
| Both English and French | 64,800 | 0.8 | 43,335 | 0.6 | 50,060 | 0.7 | 97,225 | 1.4 | |
| Total population | 7,815,950 | 100 | 7,435,905 | 100 | 7,125,580 | 100 | 7,138,795 | 100 | |
Language spoken at home
| Language | Population | Percentage (%) |
|---|---|---|
| French | 6,027,735 | 81.1 |
| English | 744,430 | 10.0 |
| Both English and French | 52,325 | 0.7 |
| Non-official languages | 518,320 | 7.0 |
| Both French and a non-official language | 54,490 | 0.7 |
| Both English and a non-official language | 26,560 | 0.4 |
| French, English and a non-official language | 12,035 | 0.2 |
| Total population | 7,435,905 | 100 |
Knowledge of languages
The question on knowledge of languages allows for multiple responses. The following figures are from the 2016 Canadian Census,[9] and lists languages that were selected by at least one per cent of respondents.
| Language | Responses | % |
|---|---|---|
| French | 7,522,350 | 94.43 |
| English | 3,930,690 | 49.35 |
| Spanish | 390,355 | 4.90 |
| Arabic | 267,965 | 3.37 |
| Italian | 173,710 | 2.18 |
| Haitian Creole | 108,315 | 1.36 |
Ethnic origin
| Ethnic origin | Population | Percent |
|---|---|---|
| Canadien/Canadian | 4,474,115 | 60.1% |
| French | 2,151,655 | 28.8% |
| Irish | 406,085 | 5.5% |
| Italian | 299,655 | 4.0% |
| English | 245,155 | 3.3% |
| First Nations | 219,815 | 3.0% |
| Scottish | 202,515 | 2.7% |
| Quebecer | 140,075 | 1.9% |
| German | 131,795 | 1.8% |
| Chinese | 91,900 | 1.24% |
| Haitian | 91,435 | 1.23% |
| Spanish | 72,090 | 0.97% |
| Jewish | 71,380 | 0.96% |
| Greek | 65,985 | 0.89% |
| Polish | 62,800 | 0.84% |
| Lebanese | 60,950 | 0.83% |
| Portuguese | 57,445 | 0.77% |
| Belgian | 43,275 | 0.58% |
| East Indian | 41,600 | 0.56% |
| Romanian | 40,320 | 0.54% |
| Russian | 40,155 | 0.54% |
| Algerian | 36,700 | 0.49% |
| American (USA) | 36,695 | 0.49% |
| Métis | 36,280 | 0.49% |
| Vietnamese | 33,815 | 0.45% |
| Acadian | 32,950 | 0.44% |
| Ukrainian | 31,955 | 0.43% |
| African (Black) | 30,170 | 0.41% |
| Filipino | 25,680 | 0.35% |
| Morrocan | 25,150 | 0.34% |
| British Isles | 23,445 | 0.32% |
| Armenian | 23,230 | 0.31% |
| Dutch | 23,015 | 0.31% |
| Hungarian | 22,585 | 0.30% |
| Swiss | 20,280 | 0.27% |
| Egyptian | 17,950 | 0.24% |
| Salvadoran | 15,770 | 0.21% |
| Syrian | 14,925 | 0.20% |
| Ethnic origin | Population | Percent |
|---|---|---|
| Colombian | 14,845 | 0.20% |
| Mexican | 14,215 | 0.19% |
| Berbers | 13,415 | 0.18% |
| Inuit | 12,915 | 0.17% |
| Iranian | 12,370 | 0.17% |
| Peruvian | 12,335 | 0.17% |
| Jamaican | 11,935 | 0.16% |
| Pakistani | 11,710 | 0.16% |
| Chilean | 11,585 | 0.16% |
| Turk | 11,385 | 0.15% |
| Austrian | 11,295 | 0.15% |
| Sri Lankan | 10,750 | 0.14% |
| Congolese | 10,190 | 0.14% |
| Cambodian | 10,175 | 0.14% |
| Welsh | 9,815 | 0.13% |
| Black | 9,520 | 0.13% |
| Tunisian | 7,870 | 0.11% |
| Bulgarian | 6,955 | 0.09% |
| Guatemalan | 6,880 | 0.09% |
| Laotian | 6,425 | 0.09% |
| Norwegian | 6,350 | 0.09% |
| Bangladeshi | 6,095 | 0.08% |
| Yugoslav | 6,090 | 0.08% |
| Swedish | 5,975 | 0.08% |
| Afghan | 5,855 | 0.08% |
| Lithuanians | 5,665 | 0.08% |
| Korean | 5,555 | 0.07% |
| Czech | 5,540 | 0.07% |
| West Indian | 5,420 | 0.07% |
| Barbadian | 5,340 | 0.07% |
| Croatian | 5,330 | 0.07% |
| Latin/Central/South American | 5,270 | 0.07% |
| European | 5,130 | 0.07% |
| Danish | 5,130 | 0.07% |
| Palestinian | 4,940 | 0.07% |
| Trinidadian/Tobagan | 4,810 | 0.06% |
| Japanese | 4,560 | 0.06% |
| Slovak | 4,560 | 0.06% |
Percentages are calculated as a proportion of the total number of respondents (7,435,905) and may total more than 100 percent due to dual responses.
Only groups with 0.06 percent or more of respondents are shown.[10]
Ethnicity according to the older more general system of classification is shown below:
| Origins | 2001 | % |
|---|---|---|
| North American | 4,989,230 | 70.02% |
| French | 2,123,185 | 29.80% |
| British Isles | 547,790 | 7.69% |
| Southern European | 409,095 | 5.74% |
| Aboriginal | 159,900 | 2.24% |
| Western European | 153,750 | 2.16% |
| Arab | 135,750 | 1.91% |
| East and Southeast Asian | 132,280 | 1.86% |
| Origins | 2001 | % |
|---|---|---|
| Eastern European | 130,410 | 1.83% |
| Caribbean | 108,475 | 1.52% |
| Other European | 86,450 | 1.21% |
| Latin, Central and South American | 65,150 | 0.91% |
| South Asian | 62,585 | 0.88% |
| African | 48,715 | 0.68% |
| West Asian | 40,960 | 0.57% |
| Northern European | 15,295 | 0.21% |
Percentages are calculated as a proportion of the total number of respondents (7,125,580) and may total more than 100% due to dual responses
Only groups of more than 0.02% are shown[11]
| Group | 2016[12] | 2036[13][14] | ||
|---|---|---|---|---|
| Number | % of 2016 population (8,164,361) | Number | % of 2036 estimated population (9,526,000) | |
| European origins | 6,750,200 | 87.4% | 7,029,000 | 73.8% |
| Middle Eastern and South Asian origins | 336,480 | 4.2% | 790,000 | 8.3% |
| African origins | 319,230 | 4.0% | 688,000 | 7.2% |
| East and Southeast Asian origins | 209,860 | 2.6% | 403,000 | 4.2% |
| Aboriginal origins | 182,885 | 2.3% | 280,000 | 2.9% |
| Latin, Central and South American origins | 133,920 | 1.7% | 259,000 | 2.7% |
| Other | 32,885 | 0.4% | 76,000 | 0.8% |
| *Percentages total over 100% due to multiple responses, e.g. German-Indian, Norwegian-Irish. | ||||
Visible minorities and Aboriginals
The 2006 census counted a total aboriginal population of 108,425 (1.5%) including 65,085 North American Indians (0.9%), 27,985 Métis (0.4%), and 10,950 Inuit (0.15%). There is a significant undercount, as many of the biggest Indian bands regularly refuse to participate in Canadian censuses for political reasons regarding the question of aboriginal sovereignty. In particular, the largest Mohawk Iroquois reserves (Kahnawake, Akwesasne and Kanesatake) were not counted.{Percentages are calculated as a proportion of the total number of respondents (7,435,905)}[15]
| Visible minority and Aboriginal population (Canada 2011 Census) | |||
|---|---|---|---|
| Population group | Population | % of total population | |
| European | 6,740,370 | 87.2% | |
| Visible minority group Source:[16] |
South Asian | 83,320 | 1.1% |
| Chinese | 82,845 | 1.1% | |
| Black | 243,625 | 3.2% | |
| Filipino | 31,495 | 0.4% | |
| Latin American | 116,380 | 1.5% | |
| Arab | 166,260 | 2.2% | |
| Southeast Asian | 65,855 | 0.9% | |
| West Asian | 23,445 | 0.3% | |
| Korean | 6,665 | 0.1% | |
| Japanese | 4,025 | 0.1% | |
| Visible minority, n.i.e. | 8,895 | 0.1% | |
| Multiple visible minority | 17,420 | 0.2% | |
| Total visible minority population | 850,235 | 11% | |
| Aboriginal group Source:[16] |
First Nations | 82,425 | 1.1% |
| Métis | 40,960 | 0.5% | |
| Inuit | 12,570 | 0.2% | |
| Aboriginal, n.i.e. | 4,415 | 0.1% | |
| Multiple Aboriginal identity | 1,545 | 0% | |
| Total Aboriginal population | 141,915 | 1.8% | |
| Total population | 7,732,520 | 100% | |
Migration
Immigration
Quebec welcomes about 50,000 immigrants per year. The 2016 Canadian census counted a total of 1,091,305 immigrants living in Quebec. The most commonly reported countries of birth for all immigrants living in Quebec were:[17]
| Rank | Country of origin | Number |
|---|---|---|
| 1. | France | 81,225 |
| 2. | Haiti | 80,965 |
| 3. | Morocco | 60,695 |
| 4. | Algeria | 59,460 |
| 5. | Italy | 51,025 |
| 6. | China | 49,555 |
| 7. | Lebanon | 39,140 |
| 8. | Romania | 28,690 |
| 9. | United States | 25,960 |
| 10. | Colombia | 25,575 |
| 11. | Vietnam | 25,440 |
| 12. | Philippines | 24,410 |
| 13. | Egypt | 19,490 |
| 14. | Portugal | 18,985 |
| 15. | Greece | 18,420 |
| 16. | India | 17,865 |
| 17. | Syria | 17,775 |
| 18. | Iran | 17,760 |
| 19. | Mexico | 15,820 |
| 20. | Tunisia | 14,775 |
Interprovincial migration
Since it started being recorded in 1971, Quebec has had negative interprovincial migration every year, and Quebec has seen the largest net loss of people due to interprovincial migration during this time (without adjusting for population).[18] Between 1981 and 2017, Quebec lost 229,700 people below the age of 45 to interprovincial migration.[19] However, if we adjust for population, Quebec has lost significantly fewer people as a share of their population than other provinces. This is due to the very low migration rate of francophone quebeckers, and anglophone quebeckers are much more likely to leave Quebec than francophones.[20] However, Quebec receives much fewer in-migrants from other provinces than average.[21]
In Quebec, Allophones are more likely to migrate out of the province than average: between 1996 and 2001, over 19,170 migrated to other provinces; 18,810 of whom migrated to Ontario.[22]
| Mother Tongue / Year | 1971–1976 | 1976–1981 | 1981–1986 | 1986–1991 | 1991–1996 | 1996–2001 | 2001-2006 | 2006-2011 | Total |
|---|---|---|---|---|---|---|---|---|---|
| French | -4,100 | -18,000 | -12,900 | 5,200 | 1,200 | -8,900 | 5,000 | -2,610 | -35,110 |
| English | -52,200 | -106,300 | -41,600 | -22,200 | -24,500 | -29,200 | -8,000 | -5,930 | -289,630 |
| Other | -5,700 | -17,400 | -8,700 | -8,600 | -14,100 | -19,100 | -8,700 | -12,711 | -95,011 |
| In-migrants | Out-migrants | Net migration | |
|---|---|---|---|
| 2008–09 | 20,307 | 27,726 | −7,419 |
| 2009–10 | 21,048 | 24,306 | −3,258 |
| 2010–11 | 19,884 | 24,647 | −4,763 |
| 2011–12 | 20,179 | 27,094 | −6,915 |
| 2012–13 | 16,879 | 27,310 | −10,431 |
| 2013–14 | 16,536 | 30,848 | −14,312 |
| 2014–15 | 16,611 | 32,753 | −16,142 |
| 2015–16 | 19,259 | 30,377 | −11,118 |
| 2016–17 | 19,531 | 27,658 | −8,127 |
| 2017–18 | 20,777 | 26,470 | − 5,693 |
| 2018–19 | 24,604 | 27,653 | − 3,049 |
Religion
Quebec is unique among the provinces in its overwhelmingly Roman Catholic population, though now has a low church attendance. This is a legacy of colonial times when only Roman Catholics were permitted to settle in New France.
| Religion (2001) | Denomination (2001) | Congregation (2001) | Proportion (2001) |
|---|---|---|---|
| Catholic Christian | 5,939,795 | 83.6% | |
| Roman Catholic | 5,930,385 | 83.23% | |
| Ukrainian Catholic | 3,430 | 0.05% | |
| Protestant Christian | 335,595 | 4.71% | |
| Anglican | 85,475 | 1.20% | |
| United Church of Canada | 52,950 | 0.74% | |
| Baptist | 35,455 | 0.50% | |
| Pentecostal | 22,670 | 0.32% | |
| Lutheran | 9,640 | 0.14% | |
| Presbyterian | 8,770 | 0.12% | |
| Methodist | 8,725 | 0.12% | |
| Adventist | 6,690 | 0.09% | |
| Mission de l'Esprit Saint | 765 | 0.01% | |
| Orthodox Christian | 100,375 | 1.41% | |
| Greek Orthodox | 50,020 | 0.70% | |
| Armenian Orthodox | 4,935 | 0.07% | |
| Russian Orthodox | 2,185 | 0.03% | |
| Coptic Orthodox | 2,010 | 0.03% | |
| Antiochian Orthodox | 1,050 | 0.01% | |
| Ukrainian Orthodox | 985 | 0.01% | |
| Serbian Orthodox | 920 | 0.01% | |
| Other Christian | 56,755 | 0.80% | |
| Muslim | 108,620 | 1.52% | |
| Jewish | 89,920 | 1.26% | |
| Buddhist | 41,375 | 0.58% | |
| Hindu | 24,530 | 0.34% | |
| Sikh | 8,220 | 0.12% | |
| Other eastern religions | 3,425 | 0.05% | |
| Bahá'í | 1,155 | 0.02% | |
| Pagan | 1,330 | 0.02% | |
| Aboriginal spirituality | 740 | 0.01% | |
| No religious affiliation | 413,185 | 5.80% | |
| No religion | 400,325 | 5.62% | |
| Atheist | 4,335 | 0.02% | |
| Agnostic | 12,600 | 0.06% | |
Percentages are calculated as a proportion of the total number of respondents (7,125,580 in 2001). Only groups of more than 0.01% are shown. [25]
See also

- Demographics of Canada
- Demographic history of Quebec
- Demolinguistics of Quebec
- Demographics of Montreal
- Cahiers québécois de démographie academic journal
- Immigration to Canada
- Population of Canada by province and territory
References
- "Census 2011 FOLS". Statistics Canada.
- Amber LePage-Monette. "Powerful Population". BioScienceWorld.ca. Promotive Communications. Archived from the original on 2007-03-28. Retrieved 2008-08-18.
- Flanagan, Nina (August 2005). "Bioresearch Highlights Significance of SNPs". Genetic Engineering News. 25 (14). Mary Ann Liebert. pp. 1, 27–29. Retrieved 2008-08-18.
- "Census Profile, 2016 Census". Statistics Canada. August 9, 2019. Retrieved January 13, 2020.
- "Archived copy". Archived from the original on 2011-06-12. Retrieved 2009-06-18.CS1 maint: archived copy as title (link)
- Statistics Canada. "2006 Community Profiles". Statistics Canada. Retrieved 2008-01-30.
- Statistics Canada. "2001 Community Profiles". Statistics Canada. Retrieved 2008-01-30.
- Statistics Canada. "1996 Community Profiles". Statistics Canada. Retrieved 2008-01-30.
- "Census Profile, 2016 Census - Saskatchewan [Province] and Quebec [Province] - Language". statcan.gc.ca. Statistics Canada. 9 August 2019. Retrieved 15 October 2019.
- Ethnic origins, 2006 counts, for Canada, provinces and territories - 20% sample data.
- Ethnic Origin (232), Sex (3) and Single and Multiple Responses (3) (2001 Census)
- "Census Profile, 2016 Census Quebec [Province] and Canada [Country]". Retrieved 23 April 2020. line feed character in
|title=at position 28 (help) - "Population by visible minority group, place of residence and projection scenario, Canada, 2011 and 2036". Retrieved 23 April 2020.
- "Projections of the Aboriginal Population and Households in Canada 2011 to 2036" (PDF). Retrieved 23 April 2020.
- Aboriginal Population Profile (2006 Census)
- , NHS Profile, Quebec, 2011, Statistics Canada
- Immigrant Status and Period of Immigration (11), Place of Birth (272), Age (7A) and Sex (3) for the Population in Private Households of Canada, Provinces and Territories, Census Divisions and Census Subdivisions, 2016 Census - 25% Sample Data
- "Interprovincial Migration in Canada: Quebeckers Vote with Their Feet" (PDF). www.fraserinstitute.org. Retrieved 2018-12-26.
- Serebrin, Jacob; July 26, Montreal Gazette Updated; 2018 (2018-07-26). "Quebec losing young people to interprovincial migration, report shows | Montreal Gazette". Retrieved 2018-12-28.CS1 maint: numeric names: authors list (link)
- Finnie, Ross (2004). School of Policy Studies at Queen’s University and Business and Labour Market Analysis Division, Statistics Canada. "Who moves? A logit model analysis of inter-provincial migration in Canada". Applied Economics. 36 (16): 1759–1779. doi:10.1080/0003684042000191147.
- Statistics Canada, table 051-0012: Interprovincial migrants, by age group and sex, Canada, provinces and territories, annual.
- Net population gains or losses from interprovincial migration by language group, provinces and territories, 1991-1996 and 1996-2001
- "Factors Affecting the Evolution of Language Groups". Statistics Canada. Retrieved 2019-05-25.
- 2011 National Household Survey: Data tables
- Religion (95) and Immigrant Status (Census 2001)
External links
| Provinces | |
|---|---|
| Territories |
|
| |
| Ethnic ancestry |
| ||||||||||||||||||||||||||||||||||||||||||||||||||
|---|---|---|---|---|---|---|---|---|---|---|---|---|---|---|---|---|---|---|---|---|---|---|---|---|---|---|---|---|---|---|---|---|---|---|---|---|---|---|---|---|---|---|---|---|---|---|---|---|---|---|---|
| Demographics |
| ||||||||||||||||||||||||||||||||||||||||||||||||||
| Culture and society |
| ||||||||||||||||||||||||||||||||||||||||||||||||||
| List of Canadians |
| ||||||||||||||||||||||||||||||||||||||||||||||||||
| |||||||||||||||||||||||||||||||||||||||||||||||||||