Complete blood count
A complete blood count (CBC) is a blood panel requested by a doctor or other medical professional that gives information about the cells in a person's blood. The test reports the amounts of white blood cells, red blood cells and platelets, the concentration of hemoglobin in the blood, and the hematocrit, which is the percentage of the blood that is made up of red blood cells. The red blood cell indices, which describe the average size and hemoglobin content of red blood cells, are also reported, and a white blood cell differential, which counts the different types of white blood cells, may be performed.
| Complete blood count | |
|---|---|
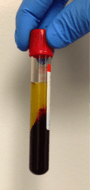
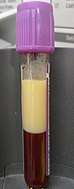
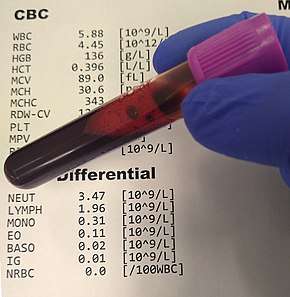 Example of CBC results and a lavender top (EDTA) whole blood sample, the preferred specimen for CBC analysis | |
| Synonyms | Complete blood cell count, full blood count (FBC),[1] full blood examination (FBE),[2] hemogram[3] |
| MeSH | D001772 |
| MedlinePlus | 003642 |
| LOINC | Codes for CBC, e.g., 57021-8 |
| HCPCS-L2 | G0306 |
The test is often ordered on healthy people as part of a routine medical examination and can be used to help monitor or diagnose various health conditions. Conditions such as anemia and thrombocytopenia can be diagnosed from abnormal results on the complete blood count. Certain results can indicate a need for urgent medical treatment, such as a blood transfusion if the hemoglobin is very low. Other results can help guide healthcare providers towards a diagnosis: for example, the red blood cell indices can provide information about the cause of a person's anemia. Complete blood count results are interpreted by comparing them to reference ranges, which vary based on sex and age.
A complete blood count is performed by running a blood sample on an automated analyzer, which is a machine designed to run laboratory tests. The analyzer counts red and white blood cells and platelets by flow cytometry, isolating single cells and measuring characteristics like light scattering and electrical impedance to distinguish between different types of cells and collect information about their size and structure. Hemoglobin is measured by spectrophotometry, and the red blood cell indices are calculated from the red blood cell count, mean cell volume, and hemoglobin. Sometimes, manual techniques are used to confirm the results of automated testing. Approximately 10–25% of complete blood count samples are flagged for manual blood smear review, which requires the blood to be stained and viewed under a microscope by a medical laboratory technologist to verify that the analyzer results are correct and look for abnormal changes in the appearance of blood cells. The hematocrit may also be performed manually if the automated results are questionable.
Karl Vierordt performed what is considered the first blood count in 1852, by spreading a specific volume of blood on a microscope slide and counting the cells. The invention of the hemocytometer in 1875 by Louis-Charles Malassez simplified the microscopic analysis of blood cells, and in the late 19th century, Paul Ehrlich and Dmitri Leonidovich Romanowsky developed methods for staining white and red blood cells that are still used to examine blood smears. Spectrophotometric methods for measuring hemoglobin were developed in the 1920s, and Maxwell Wintrobe introduced the Wintrobe hematocrit method in 1929, which in turn enabled him to define the red blood cell indices. Automation of the complete blood count began with the invention of the Coulter counter by Wallace and Joseph A. Coulter in the 1950s. This device used electrical impedance measurements to count blood cells and measure their sizes, a technology that remains in use in many automated analyzers. Further research in the 1970s and 1980s involved the use of light scattering measurements and fluorescent staining to count and identify cells, which enabled the automation of the white blood cell differential. As of 2020, complete blood count analyzers use various combinations of these methods to produce results.
Medical uses

Complete blood counts are done to monitor overall health, to screen for some diseases, to confirm a diagnosis of some medical conditions, and to monitor changes in the body caused by medical conditions and treatments.[4] The test may be ordered on healthy people as part of a routine medical examination or if the healthcare provider suspects a person has a medical condition that affects blood cells, such as anemia, bleeding disorders, inflammation, infection or cancer. It may also be used to monitor people receiving treatments that can affect blood cell counts, such as chemotherapy, and people who have had abnormal CBC results in the past.[3] The results of the CBC may be used to determine if a person needs a blood transfusion or platelet transfusion.[5] It is recommended that a CBC only be drawn once per day if the person's condition is stable, because excessive blood draws can deplete hemoglobin and platelets, leading to unnecessary transfusions.[5]
Procedure
The sample is collected by venipuncture, drawing the blood into a tube containing an anticoagulant—typically ethylenediaminetetraacetic acid (EDTA)—to stop it from clotting.[6]:183 The blood is usually taken from a vein, but sometimes capillary blood is collected by puncturing the skin of the finger or heel. This is normally done for infants and people whose veins are difficult to access. The sample is then transported to a medical laboratory to be tested.[7]:2–4 The testing is typically performed by an automated analyzer. However, manual techniques such as a blood smear review or manual hematocrit test may be used to confirm questionable results.[6]:188–98 Cell counts and hemoglobin measurements may also be performed manually, but this is usually done in laboratories that do not have access to automated instruments.[8]:551–5
Automated
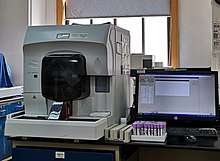
Analysis begins when a well mixed blood sample is placed on a rack in the analyzer. The instrument utilizes flow cells, photometers and apertures to analyze different elements in the blood. On board the analyzer, the sample is diluted and aspirated into at least two different channels, one of which is used to count red blood cells and platelets, the other to count white blood cells. Additional channels may be used for differential white blood cell counts and specialized measurements of platelets.[9][10]:291 Hydrodynamic focusing is used to isolate individual cells for accurate analysis of their properties.[6]:186 In the white blood cell channel, a reagent lyses the red cells so that white blood cells can be analyzed more easily. This also releases hemoglobin from the red blood cells, allowing the hemoglobin concentration to be measured.[11]:29–30 A special photometer called a hemoglobinometer measures the amount of hemoglobin. This is done by adding chemicals that cause hemoglobin to change in colour. The change in color of the resulting solution, measured by spectrophotometry, correlates with the hemoglobin content of the blood.[6]:188–9[12]:135
Blood cell counting occurs by flow cytometry, in which a very small amount of the specimen is aspirated, diluted and passed through an aperture and a flow cell. Sensors count and identify the number of cells passing through the aperture using two main principles: electrical impedance and light scattering.[12]:208 Impedance-based cell counting operates on the Coulter principle, which measures the drop in current as cells pass through an aperture to count cells and calculate their sizes. Because red blood cells, white blood cells and platelets have different average sizes, this technique allows the three types of cells to be differentiated.[13] Light scattering techniques direct a laser at individual cells and determine cellular size and complexity by measuring the amount of light scattered at different angles. Forward scatter, which refers to light scattered between 0 and 10 degrees of the beam's axis, correlates with cellular size, while side scatter (light scattered at a 90-degree angle) correlates with cellular complexity. White blood cells, red blood cells and platelets, as well as individual types of white blood cells, can be distinguished based on light scattering characteristics.[6]:234[12]:208
Red blood cell indices are reported in addition to cell counts and hemoglobin. Automated hematology analyzers measure the average size of red blood cells (reported as the MCV or mean cell volume), and use the hemoglobin, MCV and hematocrit values to calculate the average amount (MCH) and concentration (MCHC) of hemoglobin within each red blood cell. The amount of variation in the size of red blood cells (RDW) is also calculated to provide additional diagnostic information.[6]:190
On most analyzers, it takes less than one minute to run all the tests in the complete blood count.[12]:208 Because the analyzer samples and counts so many cells, the results are very precise.[6]:182–4 However, certain abnormal cells in the blood may not be identified correctly, requiring manual review of the instrument's results and identification by other means (such as microscopy) of abnormal cells the instrument could not categorize.[7]:51[14]
To ensure that results from the automated analyzer are correct, quality control samples are run at least once per day. These are samples with known results that are most often provided by the instrument manufacturer. Laboratories compare their CBC results to the known values to ensure the instrument is operating correctly. A moving average measurement may also be used, in which the average results for patient samples are measured at certain intervals. Assuming that the characteristics of the patient population remain roughly the same over time, the average should remain constant. Large shifts in the average value can indicate instrument problems.[15]:697–8[16] Laboratories also receive external quality assessment samples from regulatory organizations. EQA samples are simulated patient samples designed to give specific results which are not disclosed to the laboratory. Laboratories report their results for these samples, and the organization compares them against the known values to ensure that they are correct.[12]:539–40
Manual
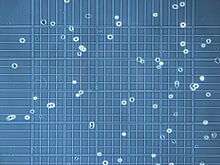
The tests in the complete blood count can also be performed using manual techniques. Red and white blood cells and platelets can be counted under the microscope using a hemocytometer, a microscopic counting chamber that holds a specified volume of diluted blood. A technologist counts the number of cells seen in the hemocytometer's counting grid and divides it by the volume of blood used to determine the concentration of cells in the blood sample.[11]:551–5 This process is labour-intensive and inaccurate compared to automated methods, so it is rarely used except in under-resourced laboratories that do not have access to automated analyzers.[6]:184[11]:555
Hemoglobin can be measured manually using a spectrophotometer or colorimeter. To measure hemoglobin manually, the blood sample is diluted using reagents that destroy red blood cells to release the hemoglobin. Other chemicals are used to convert different types of hemoglobin to one form, allowing it to be easily measured. The solution is then placed in a measuring cuvette and the absorbance is measured at a specific wavelength, which depends on the type of reagent used. A reference standard containing a known amount of hemoglobin can be used to determine the relationship between the absorbance and the hemoglobin concentration, allowing the hemoglobin level of the sample to be determined.[8]:19–22
Other manual methods are commonly used to confirm the results from the automated analyzer. For example, automated hematocrit measurements can be incorrect in certain conditions, such as polycythemia (a highly elevated red blood cell count),[6]:188 or severe leukocytosis (a highly elevated white blood cell count, which interferes with red blood cell measurements by causing white blood cells to be counted as red cells).[12]:226 In these cases, a manual hematocrit can be performed by filling a capillary tube with blood, centrifuging it, and measuring the percentage of the blood that consists of red blood cells. Outside of these conditions, however, the automated hematocrit is more accurate than the manual hematocrit.[6]:188
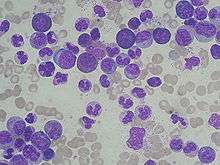
In 10 to 25 percent of cases, automated CBC results are flagged for manual blood smear review. This could be because of abnormal cell populations that the analyzer cannot count properly,[6]:194–8 internal flags generated by the analyzer that suggest the results may be inaccurate,[12]:225 or numerical results that fall outside certain thresholds.[14] A smear is made from the blood sample, stained with a Romanowsky stain, and examined under a microscope. A medical laboratory technologist examines the appearance of the red and white blood cells and platelets. Abnormalities in the shape and size of red blood cells are reported if present.[17] The platelet count can be estimated from the blood smear, which is useful if the automated platelet results are inaccurate due to conditions like platelet clumping or the presence of giant platelets.[14][18] A manual white blood cell differential count may be performed, in which a large number of white blood cells (at least 100) are counted and classified into different types.[19]:10 This gives the percentage of each type of white blood cell, and by multiplying these percentages by the total number of white blood cells, the absolute number of each type of white cell can be obtained.[10]:329 Manual counting is subject to sampling error because so few cells are counted compared with automated analysis.[6]:182–4
Included tests
In a complete blood count, the amounts of red blood cells, white blood cells, and platelets are measured, along with the hemoglobin and hematocrit values. The red blood cell indices—MCV, MCH and MCHC—which describe the size of red blood cells and their hemoglobin content, are reported along with the RDW, which measures the amount of variation in the sizes of red blood cells. A white blood cell differential, which enumerates the different types of white blood cells, may also be performed.[6]:185–198[12]:4–5
Hemoglobin
Hemoglobin is the protein in red blood cells that carries oxygen to the tissues.[4] Hematology analyzers measure hemoglobin using spectrophotometry. Inside the analyzer, chemicals are added to the sample which destroy red blood cells, releasing the hemoglobin inside. Reagents are used to convert different forms of hemoglobin, such as oxyhemoglobin and carboxyhemoglobin, to one stable form, and to create a colour change. The intensity of the resulting colour, when measured at a specific wavelength, corresponds with the concentration of hemoglobin in the blood.[6]:188–9 The reference method for hemoglobin measurement is the cyanmethemoglobin method, which uses reagents containing potassium cyanide and potassium ferricyanide to convert hemoglobin to cyanmethemoglobin. Some analyzers use sodium lauryl sulfate as a non-toxic alternative to cyanide-containing reagents, which results in the formation of SLS-methemoglobin.[6]:188–9[12]:135 Hemoglobin results are typically reported in grams per decilitre (g/dL) or grams per litre (g/L).[3]
Hematocrit
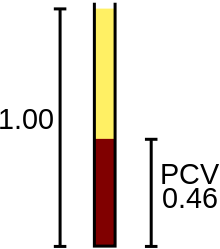
The hematocrit (HCT) or packed cell volume (PCV) is the fraction of whole blood volume that consists of red blood cells.[20] Hematology analyzers provide automated hematocrit readings using one of two methods: a calculated hematocrit, which is determined by multiplying the red blood cell count by the MCV, or a directly measured hematocrit, which is determined by comparing the total volume of red blood cells to the total volume of blood sampled. The hematocrit may also be determined manually by filling a capillary tube with blood, centrifuging it, and measuring the percentage of red blood cells compared to the percentage of plasma. The manual hematocrit is still used to confirm automated results in conditions where the automated hematocrit may be inaccurate.[6]:187–8 The hematocrit is reported as a ratio in percentage or decimal points.[21]:283
Red blood cells
Red blood cells carry hemoglobin throughout the body.[20] The analyzer measures the number of red blood cells and determines their average sizes using impedance or light scattering measurements, reporting the cell count in units of 106 cells per microlitre of blood (x 106/μL) or 1012 cells per litre (x 1012/L).[3][12]:212 Additional information describing the red blood cells (the red blood cell indices and red blood cell distribution width) is determined from the red blood cell count, hemoglobin, and cell size measurements.[6]:185[12]:196
Indices
.jpg)
A complete blood count includes measurements of the three red blood cell indices: mean cell volume (MCV), the average size of red blood cells, expressed in femtolitres; mean cell hemoglobin (MCH), the average amount of hemoglobin per red blood cell, expressed in picograms; and mean cell hemoglobin concentration (MCHC), the average hemoglobin concentration of red blood cells, expressed in grams per decilitre. These indices can be calculated from the hemoglobin, hematocrit, and red blood cell count values,[11]:22[12]:196 although on automated analyzers, the MCV is usually measured directly.[6]:190
Evaluation of red blood cell indices is helpful in determining the cause of anemia.[6]:190 Anemia with a low MCV is referred to as microcytic anemia, and anemia with a high MCV is called macrocytic anemia. Anemia with a low MCHC is called hypochromic anemia. If anemia is present but the red blood cell indices are normal, the anemia is termed normochromic and normocytic.[11]:73–5 The term "hyperchromia", referring to a high MCHC, is generally not used, as elevation of the MCHC above the upper reference value of 360 g/dL is rare, mainly occurring in conditions that cause red blood cells to be abnormally shaped, such as spherocytosis, sickle cell disease and Hemoglobin C disease.[6]:190[12]:296 An elevated MCHC can also be a false result from conditions like red blood cell agglutination (which causes a false decrease in the red blood cell count, elevating the MCHC) or highly elevated amounts of lipids in the plasma (which causes a false increase in the hemoglobin result).[6]:190[11]:193
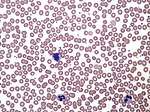
Changes in the MCV and MCHC are visible on the blood smear. The size of red blood cells can be estimated from the blood smear by comparing them to the nucleus of a small lymphocyte, which is usually of uniform size. The hemoglobin concentration can be estimated by examining the area of central pallor of the red blood cells. Normally, this takes up about one-third of the area of a red blood cell. In hypochromic anemia, the area of central pallor is increased.[11]:73–75
Distribution width
The red blood cell distribution width (RDW) reflects the degree of variation in size of red blood cells as calculated by automated analyzers. The RDW is usually reported in percentage points as the coefficient of variation of the MCV, although it is sometimes reported as the standard deviation and expressed in femtolitres. An elevated RDW represents increased variation in red blood cell size, a condition known as anisocytosis. The RDW, in conjunction with the RBC count and red blood cell indices, is useful in the differential diagnosis of several hematological disorders. For example, the RDW is often elevated in nutritional anemias such as iron deficiency anemia and anemia due to Vitamin B12 or folate deficiency, while it may be normal in thalassemia, a genetic disorder that causes anemia. A low RDW has no clinical significance.[22]
White blood cells
White blood cells are involved in inflammation and the immune response. The CBC reports the total number of white blood cells, and a differential reports all the white blood cell types as a percentage and as an absolute number per unit volume.[20] The total white blood cell count is usually determined using light scattering or impedance measurements; some analyzers also use fluorescent staining methods. Additional techniques may be used to distinguish between different types of white blood cells in the differential count.[12]:212 The total white blood cell count is usually reported in cells per microlitre of blood (/μL) or 109 cells per litre (x 109/L).[3]
Differential
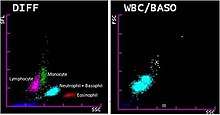
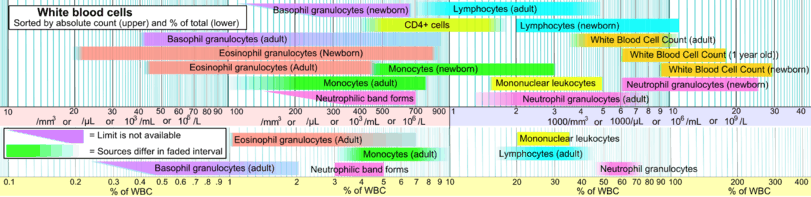
In the white blood cell differential, the different types of white blood cells are identified and counted. Five types of white blood cells—neutrophils, lymphocytes, monocytes, eosinophils, and basophils—are normally measured.[23] White blood cell types that are not normally found in the blood, such as blast cells, are reported if present.[24][25] The white blood cell differential is usually performed by the analyzer, which measures various characteristics of the cells, such as electrical impedance, light scattering parameters, and staining reactions.[7]:251[26]:295 This data correlates with properties of white blood cells like cellular size and complexity. The data is analyzed and plotted on a scattergram, where it forms clusters that correlate with each white blood cell type. The size of the clusters represents the amount of each cell type, and changes in the shape of the clusters can indicate abnormalities.[6]:185–95[7]:51
If the automated results are abnormal, or if they are flagged as questionable by the analyzer, a manual differential can be performed.[14] In the manual differential, a blood smear is stained with a Romanowsky stain and examined under the microscope by a medical laboratory scientist, who counts and classifies the cells based on their appearance. The manual differential can detect abnormal cell types that are not counted by the analyzer and clinically significant changes in the appearance of white blood cells.[10]:303[19]:10–11 If certain abnormal features are seen on the manual differential—such as blast cells, which may occur in leukemia and other blood disorders—the blood smear is referred to a physician (generally a hematologist or pathologist) for confirmation of the findings.[14]
Platelets
The complete blood count includes a count of platelets, the cellular component of the blood which is responsible for clotting.[20] Most automated analyzers use impedance measurements to generate a platelet count,[9] and many also make use of light scattering, fluorescent staining and immunological methods to improve accuracy. Fluorescent staining methods for platelet counting involve the use of dyes that stain certain chemicals found in platelets; the intensity of the fluorescent signal is then measured to determine the platelet count. Immunological methods use monoclonal antibodies that bind to specific antigens on the surface of platelets, which are conjugated to fluorescent dyes.[15]:46–53 The platelet count is usually reported in units of 103 cells per microlitre of blood (x 103/μL) or 109 cells per litre (x 109/L).[3]
The mean platelet volume (MPV), which is a measurement of the average size of platelets in femtolitres, may also be reported. The MPV can provide information about the cause of thrombocytopenia: an elevated MPV may occur in conditions where platelets are destroyed, such as in immune thrombocytopenic purpura, while a decreased MPV may occur in thrombocytopenia caused by malfunction of megakaryocytes (the cells that produce platelets). Congenital disorders that cause thrombocytopenia, like Bernard–Soulier syndrome and gray platelet syndrome, may also affect the MPV.[22]
Limitations
Certain medical conditions or problems with the blood sample may cause analyzers to produce inaccurate CBC results. If the blood sample is visibly clotted, which can be caused by poor phlebotomy technique, it is unsuitable for CBC analysis, because the platelet count will be falsely decreased and other CBC results may be abnormal.[11]:157[15]:67 Samples that have been stored at room temperature for extended periods may give falsely high readings for MCV,[11]:194 because red blood cells swell as they absorb water from the plasma. Platelet and white blood cell differential results may also be inaccurate in aged specimens, as the cells degrade over time.[12]:226
Blood samples drawn from individuals who have very high levels of bilirubin or lipids in their plasma (referred to as an icteric sample or a lipemic sample, respectively)[10]:91 may show falsely high readings for hemoglobin, because these substances change the colour and opacity of the blood sample, which interferes with hemoglobin measurement.[15]:79–87 This can be avoided by performing a plasma replacement, which involves removing the lipemic or icteric plasma and replacing it with saline.[12]:226
Some people produce an antibody that causes their platelets to clump when their blood is drawn into tubes containing EDTA, the anticoagulant used to collect routine CBC samples. Platelet clumps may be counted as single platelets by automated analyzers, leading to a falsely decreased platelet count. This can be avoided by using an alternative anticoagulant like sodium citrate or heparin. Platelet clumping can also occur if the sample has begun to clot due to a difficult blood draw.[11]:196–7
Another antibody-mediated condition that can affect CBC results is red blood cell agglutination. This phenomenon causes red blood cells to clump together because of antibodies bound to the cell surface.[27]:109 Red blood cell aggregates are counted as single cells by the analyzer, leading to a markedly decreased red blood cell count and hematocrit, and markedly elevated MCV and MCHC.[7]:194 Often, these antibodies are only active at room temperature (in which case they are called cold agglutinins), and the agglutination can be reversed by heating the blood sample to 37 °C (99 °F). People with warm autoimmune hemolytic anemia may exhibit red cell agglutination that does not resolve on warming.[15]:88
Reference ranges
Complete blood count results are interpreted by comparing them to reference ranges, which are ranges of blood test values designed to represent the results found in 95 percent of healthy people.[8]:8–10 Normal ranges for the CBC vary based on sex and age. On average, adult females have lower hemoglobin, hematocrit, and red blood cell count values than males.[11]:214 Infants and children have higher lymphocyte counts and lower MCV and MCHC values than adults.[11]:144 Newborn babies have very high hemoglobin, RBC, and MCV values; the white blood cell count is also increased in newborns.[11]:143 Other differences between populations may affect the normal ranges of the CBC. For example, people living at higher altitudes have higher hemoglobin, hematocrit, and RBC results, and people of African heritage have lower white blood cell counts on average.[11]:214 The type of analyzer used to run CBCs also affects the normal ranges. Reference ranges are therefore established by individual laboratories based on their own patient populations and equipment.[8]:8[17]
| Example of CBC reference ranges[note 1] | ||||
|---|---|---|---|---|
| Test | Units | Adult | Pediatric
(4–7 years old) |
Neonate
(0–1 days old) |
| WBC | x 109/L | 3.6–10.6 | 5.0–17.0 | 9.0–37.0 |
| RBC | x 1012/L | M: 4.20–6.00
F: 3.80–5.20 |
4.00–5.20 | 4.10–6.10 |
| HGB | g/L | M: 135–180
F: 120–150 |
102–152 | 165–215 |
| HCT | L/L | M: 0.40–0.54
F: 0.35–0.49 |
0.36–0.46 | 0.48–0.68 |
| MCV | fL | 80–100 | 78–94 | 95–125 |
| MCH | pg | 26–34 | 23–31 | 30–42 |
| MCHC | g/L | 320–360 | 320–360 | 300–340 |
| RDW | % | 11.5–14.5 | 11.5–14.5 | elevated[note 2] |
| PLT | x 109/L | 150–450 | 150–450 | 150–450 |
| Neutrophils | x 109/L | 1.7–7.5 | 1.5–11.0 | 3.7–30.0 |
| Lymphocytes | x 109/L | 1.0–3.2 | 1.5–11.1 | 1.6–14.1 |
| Monocytes | x 109/L | 0.1–1.3 | 0.1–1.9 | 0.1–4.4 |
| Eosinophils | x 109/L | 0.0–0.3 | 0.0–0.7 | 0.0–1.5 |
| Basophils | x 109/L | 0.0–0.2 | 0.0–0.3 | 0.0–0.7 |
Interpretation of results
| Type of cell | Increase | Decrease |
|---|---|---|
| Red blood cells (RBC): | erythrocytosis or polycythemia | anemia or erythroblastopenia |
| White blood cells (WBC): | leukocytosis | leukopenia |
| Neutrophils | neutrophilia | neutropenia |
| Granulocytes | granulocytosis | agranulocytosis |
| Lymphocytes | lymphocytosis | lymphocytopenia |
| Monocytes | monocytosis | monocytopenia |
| Eosinophils | eosinophilia | eosinopenia |
| Basophils | basophilia | basopenia |
| Platelets | thrombocytosis | thrombocytopenia |
| All cell lines | N/A | pancytopenia |
On a basic level, the CBC provides numerical information about the cellular components of blood. Many medical conditions are defined by marked increases or decreases in CBC parameters. For example, anemia is diagnosed based on a decreased hemoglobin, hematocrit, or red blood cell count;[29][30] thrombocytopenia, which may cause life-threatening bleeding if severe,[12]:4 is defined as a decrease in the platelet count; and leukocytosis, which can be a sign of infection or blood disorders,[11]:498–9 is defined as an increase in the white blood cell count. This information can help clinicians make diagnoses and monitor the health of their patients.[29]
Certain results from the CBC may indicate a need for urgent medical intervention. If the hemoglobin or platelet level falls below certain thresholds based on the person's clinical condition, a blood or platelet transfusion may be performed.[31][32] People with a very low neutrophil count (neutropenia) and clinical signs of infection may be treated with antibiotics and given drugs to increase their neutrophil count to prevent severe infections.[33]
The classification of anemia as either macrocytic, microcytic or normocytic conveys important information about the potential causes of anemia. Microcytic anemia is typically associated with iron deficiency, thalassemia, and anemia of chronic disease, while macrocytic anemia often occurs in alcoholism, folate and B12 deficiency, use of certain drugs, and bone marrow disorders. Acute blood loss, kidney failure, and hemolytic anemia[12]:196 can result in anemia with a normocytic blood picture. Based on the CBC results, clinicians can take further steps to investigate anemia, such as ordering a ferritin test to confirm the presence of iron deficiency.[34]
White blood cell differential results are useful in diagnosing and monitoring various medical conditions. For example, an elevated neutrophil count (neutrophilia) is often associated with bacterial infection and inflammation,[10]:306 while a decreased count may occur in individuals who are undergoing chemotherapy or who have diseases affecting the bone marrow.[35][36]:247–52 An elevated lymphocyte count (lymphocytosis) is associated with viral infection[10]:309 and may also occur in lymphoproliferative disorders like chronic lymphocytic leukemia.[37] Elevated monocyte counts (monocytosis) are associated with chronic inflammatory states,[7]:95 and the eosinophil count may be high (eosinophilia) in parasitic infections and allergic conditions.[36]:256 The presence of certain types of abnormal cells, such as blast cells and lymphoma cells, may suggest a hematologic malignancy.[21]:319[24]
History
Prior to the invention of automated cell counters, the tests in the complete blood count were performed manually. White blood cells, red blood cells, and platelets were counted under a microscope.[12]:1–4 The earliest person to publish microscopic observations of blood cells was Antonie van Leeuwenhoek, who in 1675 viewed his blood through a microscope of his own design and described it as consisting of "small red globules, driven through a crystalline humidity of water".[15]:3 Throughout the 18th and 19th centuries, further improvements in microscope technology such as the invention of achromatic lenses allowed white blood cells and platelets to be counted in unstained blood samples.[15]:3–4 Physiologist Karl Vierordt is popularly credited with performing the first blood count in 1852 at the University of Tübingen. This was accomplished by spreading a known volume of blood on a microscope slide and counting the cells therein.[29][38][39] The hemocytometer—a microscope slide containing a chamber lined with graduations, into which a solution of diluted blood is placed—was introduced in 1874 by Louis-Charles Malassez, enabling cells to be counted more accurately.[15]:3–4
%2C_United_Kingdom%2C_1850-1950.jpg)
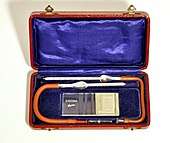
The first attempts at measuring hemoglobin concentration, devised in the late 19th century, involved visually comparing the colour of diluted blood to a standard.[39] Attempts to automate this process using spectrophotometry and colorimetry were limited by the fact that hemoglobin is present in the blood in many different forms, meaning that it could not be measured at a single wavelength. In 1920, a method to convert the different forms of hemoglobin to one stable form (cyanmethemoglobin or hemiglobincyanide) was introduced, allowing hemoglobin levels to be measured automatically. The cyanmethemoglobin method remains the reference method for hemoglobin measurement and is still used in most automated hematology analyzers.[6]:188–9[12]:135[15]:5
Maxwell Wintrobe is credited with the invention of the hematocrit test.[6]:187–8 In 1929, Wintrobe undertook a PhD project at the University of Tulane to determine normal ranges for red blood cell parameters. To assist with his research, he invented a method called the Wintrobe hematocrit. Hematocrit measurements had previously been described in the literature, but Wintrobe's method differed from earlier ones in that it used a large tube that could be mass-produced to precise specifications. The Wintrobe method involved letting the blood sit upright in a glass tube for one hour, then centrifuging it and measuring the percentage of red blood cells versus the percentage of plasma to determine the hematocrit. The invention of a reproducible method for determining hematocrit values allowed Wintrobe to define the red blood cell indices.[39]
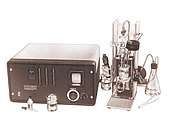
Research into automated cell counting began in the early 20th century. The first attempts, in the 1930s and 1940s, involved photoelectric detectors attached to microscopes, which would count cells as they were scanned. These early attempts proved unsuccessful.[15]:5 In the 1950s, brothers Wallace H. Coulter and Joseph A. Coulter, working together in a basement laboratory in Chicago, invented the Coulter counter.[13][26]:794 This device worked on the Coulter principle, which states that when cells are suspended in a fluid carrying an electric current and passed through an aperture, they cause decreases in current proportional to their volume because of their poor electrical conductivity. The number and magnitude of these decreases are used to count blood cells and calculate their sizes. The Coulter counter was initially designed for counting red blood cells, but with later modifications it proved effective for counting white blood cells.[13] Coulter counters were widely adopted by medical laboratories.[15]:5
The first analyzer that could produce multiple cell counts simultaneously was the Technicon SMA 4A−7A, released in 1965. This was accomplished by partitioning blood samples into two channels: one for counting red blood cells, and one for counting white blood cells and measuring hemoglobin. However, this instrument was unpopular because it was unreliable and difficult to maintain. In 1968, the Coulter Model S analyzer was released and found widespread use. Similarly to the Technicon instrument, it used two different reaction chambers to measure hemoglobin and the two cell types. The Model S also determined the mean cell volume using impedance measurements, allowing the red blood cell indices and hematocrit to be derived. Automated platelet counts were introduced in 1970 with Technicon's Hemalog-8 instrument and were adopted by Coulter's S Plus series analyzers in 1980.[15]:6
White blood cell differential
In the 1870s, Paul Ehrlich developed a staining technique using a combination of an acidic and basic dye that could distinguish between different types of white blood cells and allow red blood cell morphology to be examined.[15]:3–4 Dmitri Leonidovich Romanowsky improved on this technique in the 1890s by using a mixture of eosin and aged methylene blue, which produced a wide range of hues that was not present when either of the stains was used alone. This became the basis for Romanowsky staining, the technique that is still used to stain blood smears for manual review.[41]
In 1967, M. J. Fulwyler used a modified version of the Coulter counter to sort white blood cells by size.[42][43] Fulwyler's method involved sorting cells into collection vessels based on their sizes, after which they could undergo further testing.[29][44] Using this method, Fulwyler found that human white blood cells formed three distinct peaks when their volumes were plotted on a histogram, which correlated with different types of white blood cells.[43] Other researchers applied Fulwyler's techniques to generate automated neutrophil counts, although counts for other cell types were not as reliable.[45] In 1983, the Coulter S Plus IV system, a commercial analyzer that produced a three-part differential of neutrophils, monocytes and lymphocytes based on cell size histograms, was introduced. Similar three-part differential analyzers remain in use today.[15]:6
In the late 1960s and early 1970s, researchers began to combine Coulter counting techniques with analysis of the optical properties of cells.[29] The resulting devices, such as the Cytofluorograph[46] and Impulscytometer,[47] shot beams of light at cells in specific wavelengths and measured the resulting absorbance or fluorescence, allowing cellular contents such as DNA to be quantified.[42] Other researchers refined these techniques by using fluorescent dyes (fluorophores), which bind to specific components of cells.[29][48] Research into optical cell identification resulted in the first commercial flow cytometric white blood cell differential analyzer, the Hemalog D.[42][49][50] Introduced in 1974,[49] this analyzer used light scattering and cell staining to identify the five normal white blood cell types in addition to "large unstained cells", a classification that usually consisted of atypical lymphocytes or blast cells. The Hemalog D could count 10,000 cells in one run, a marked improvement over the 100-cell manual differential.[51] In 1981, Technicon combined the Hemalog D with the Hemalog-8 CBC analyzer to produce the Technicon H6000, the first combined CBC and differential analyzer. This analyzer was unpopular with hematology laboratories because it was labour-intensive to operate. However, in the late 1980s to early 1990s similar systems were widely produced by other manufacturers such as Sysmex, Abbott, Roche and Beckman Coulter.[15]:8–9
Notes
References
- National Health Service (26 October 2018). "Blood tests - Examples". NHS: Health A to Z. Archived from the original on 11 June 2019. Retrieved 25 January 2020.
- HealthDirect (August 2018). "Full blood count". HealthDirect.gov.au. Archived from the original on 2 April 2019. Retrieved 25 January 2020.
- American Association for Clinical Chemistry (18 December 2019). "Complete Blood Count (CBC)". Lab Tests Online. Archived from the original on 21 September 2019. Retrieved 5 January 2020.
- Mayo Clinic (19 December 2018). "Complete blood count (CBC) Why it's done – Tests and Procedures". mayoclinic.org. Archived from the original on 27 July 2019. Retrieved 25 January 2020.
- American Association of Blood Banks (24 April 2014). "Five Things Physicians and Patients Should Question". Choosing Wisely: an initiative of the ABIM Foundation. American Association of Blood Banks. Archived from the original on 24 September 2014. Retrieved 25 July 2014.
- Greer, JP; Arber, DA; Glader, BE; List, AF; Means, RM; Rodgers, GM (19 November 2018). Wintrobe's Clinical Hematology (14th ed.). Wolters Kluwer Health. ISBN 978-1-4963-6713-6.
- Bain, B (2012). Dacie and Lewis practical haematology. Edinburgh: Elsevier Churchill Livingstone. ISBN 978-0-7020-3407-7. OCLC 780445109.
- Bain, BJ; Bates, I; Laffan, MA (11 August 2016). Dacie and Lewis Practical Haematology E-Book. Elsevier Health Sciences. ISBN 978-0-7020-6925-3.
- D’Souza, C; Briggs, C; Machin, SJ (2015). "Platelets: the few, the young and the active". Clinics in Laboratory Medicine. 35 (1): 123–131. doi:10.1016/j.cll.2014.11.002. ISSN 0272-2712. PMID 25676376.
- Turgeon, ML (23 March 2015). Linné & Ringsrud's Clinical Laboratory Science: Concepts, Procedures, and Clinical Applications (7th ed.). Elsevier Mosby. ISBN 978-0-323-22545-8.
- Bain, BJ (20 January 2015). Blood Cells: A Practical Guide. John Wiley & Sons. ISBN 978-1-118-81733-9.
- Keohane, E; Smith, L; Walenga, J (20 February 2015). Rodak's Hematology: Clinical Principles and Applications. Elsevier Health Sciences. ISBN 978-0-323-23906-6.
- Graham, M (2003). "The Coulter principle: foundation of an industry". Journal of the Association for Laboratory Automation. 8 (6): 72–81. doi:10.1016/S1535-5535(03)00023-6. ISSN 1535-5535.
- Gulati, G; Song, J; Dulau Florea, A; Gong, J (2013). "Purpose and Criteria for Blood Smear Scan, Blood Smear Examination, and Blood Smear Review". Annals of Laboratory Medicine. 33 (1): 1–7. doi:10.3343/alm.2013.33.1.1. ISSN 2234-3806. PMC 3535191. PMID 23301216.
- Kottke-Marchant, K; Davis, B (6 June 2012). Laboratory Hematology Practice. John Wiley & Sons. ISBN 978-1-4443-9857-1.
- Vis, JY; Huisman, A (2016). "Verification and quality control of routine hematology analyzers". International Journal of Laboratory Hematology. 38: 100–109. doi:10.1111/ijlh.12503. ISSN 1751-5521. PMID 27161194.
- Palmer, L; Briggs, C; McFadden, S; Zini, G; Burthem, J; Rozenberg, G; Proytcheva, M; Machin, SJ (2015). "ICSH recommendations for the standardization of nomenclature and grading of peripheral blood cell morphological features". International Journal of Laboratory Hematology. 37 (3): 287–303. doi:10.1111/ijlh.12327. ISSN 1751-5521. PMID 25728865.
- Tan, GC; Stalling, M; Dennis, G; Nunez, M; Kahwash, SB (2016). "Pseudothrombocytopenia due to Platelet Clumping: A Case Report and Brief Review of the Literature". Case Reports in Hematology. 2016: 3036476. doi:10.1155/2016/3036476. PMC 5164902. PMID 28044112.
- Wang, SA; Hasserjian, RP (4 June 2018). Diagnosis of Blood and Bone Marrow Disorders. Springer. ISBN 978-3-319-20279-2.
- Dugdale, DC (24 October 2018). "CBC: MedlinePlus Medical Encyclopedia". MedlinePlus. United States National Library of Medicine. Archived from the original on 9 October 2019. Retrieved 26 January 2020.
- Turgeon, ML (14 April 2014). Linne & Ringsrud's Clinical Laboratory Science: The Basics and Routine Techniques. Elsevier Health Sciences. ISBN 978-0-323-29280-1.
- May, JE; Marques, MB; Reddy, VVB; Gangaraju, R (2019). "Three neglected numbers in the CBC: The RDW, MPV, and NRBC count". Cleveland Clinic Journal of Medicine. 86 (3): 167–172. doi:10.3949/ccjm.86a.18072. ISSN 0891-1150. PMID 30849034.
- American Association for Clinical Chemistry (1 May 2019). "WBC Differential". Lab Tests Online. Archived from the original on 14 April 2019. Retrieved 1 January 2020.
- d'Onofrio, G; Zini, G (21 October 2014). "Acute Myeloid Leukaemia". Morphology of Blood Disorders (2nd ed.). Wiley. p. 289. ISBN 978-1-118-44258-6.
- Chabot-Richards, DS; George, TI (2015). "White Blood Cell Counts". Clinics in Laboratory Medicine. 35 (1): 11–24. doi:10.1016/j.cll.2014.10.007. ISSN 0272-2712. PMID 25676369.
- Harmening, D (2009). Clinical Hematology and Fundamentals of Hemostasis (5th ed.). F. A. Davis Company. ISBN 978-0-8036-1732-2.
- Rodak, BF; Carr, JH (14 October 2012). Clinical Hematology Atlas. Elsevier Health Sciences. ISBN 978-1-4557-0830-7.
- References at Reference ranges for blood tests#White blood cells 2
- Green, R; Wachsmann-Hogiu, S (2015). "Development, History, and Future of Automated Cell Counters". Clinics in Laboratory Medicine. 35 (1): 1–10. doi:10.1016/j.cll.2014.11.003. ISSN 0272-2712. PMID 25676368.
- Braunstein, E (February 2019). "Evaluation of Anemia". Merck Manuals Professional Version. Archived from the original on 15 July 2019. Retrieved 17 January 2020.
- Vieth, JT; Lane, DR (2014). "Anemia". Emergency Medicine Clinics of North America. 32 (3): 613–628. doi:10.1016/j.emc.2014.04.007. ISSN 0733-8627. PMID 25060253.
- Kaufman, RM; Djulbegovic, B; Gernsheimer, T; Kleinman, S; Tinmouth, A T.; Capocelli, KE; Cipolle, MD; Cohn, CS; Fung, MK; Grossman, BJ; Mintz, PD; O'Malley, BA; Sesok-Pizzini, DA; Shander, A; Stack, GE; Webert, KE; Weinstein, R; Welch, BG; Whitman, GJ; Wong, EC; Tobian, AAR (2015). "Platelet Transfusion: A Clinical Practice Guideline From the AABB". Annals of Internal Medicine. 162 (3): 205. doi:10.7326/M14-1589. ISSN 0003-4819. PMID 25383671.
- Territo, M (July 2018). "Neutropenia – Hematology and Oncology". Merck Manuals Professional Edition. Archived from the original on 22 July 2019. Retrieved 22 January 2020.
- Powell, Darryl J.; Achebe, Maureen Okam (2016). "Anemia for the Primary Care Physician". Primary Care: Clinics in Office Practice. 43 (4): 527–542. doi:10.1016/j.pop.2016.07.006. ISSN 0095-4543.
- Hoffman, R; Benz, Jr., EJ; Silberstein, LE; Heslop, H; Anastasi, J; Weitz, J (1 January 2013). Hematology: Basic Principles and Practice. Elsevier Health Sciences. p. 644. ISBN 978-1-4377-2928-3.
- Porwit, A; McCullough, J; Erber, WN (27 May 2011). Blood and Bone Marrow Pathology. Elsevier Health Sciences. ISBN 978-0-7020-4535-6.
- Kaseb, H; Taneja, A; Master, S (2019). "Cancer, Chronic Lymphocytic Leukemia (CLL)". StatPearls. Treasure Island, Florida: StatPearls Publishing. Retrieved 24 July 2019.
- Verso, ML (May 1962). "The Evolution of Blood Counting Techniques". Read at a Meeting of the Section of the History of Medicine, First Australian Medical Congress. 8 (2): 149–58. doi:10.1017/s0025727300029392. PMC 1033366. PMID 14139094.
- Means, RT (2011). "It All Started in New Orleans: Wintrobe, the Hematocrit and the Definition of Normal". The American Journal of the Medical Sciences. 341 (1): 64–65. doi:10.1097/MAJ.0b013e3181e2eb09. ISSN 0002-9629. PMID 21191263.
- Wellcome Collection. "Haemoglobinometer, United Kingdom, 1850-1950". Retrieved 29 March 2020.
- Bezrukov, AV (2017). "Romanowsky staining, the Romanowsky effect and thoughts on the question of scientific priority". Biotechnic & Histochemistry. 92 (1): 29–35. doi:10.1080/10520295.2016.1250285. ISSN 1052-0295. PMID 28098484.
- Melamed, M (2001). "Chapter 1 A brief history of flow cytometry and sorting". Methods in Cell Biology. 63 part A. Elsevier. pp. 3–17. doi:10.1016/S0091-679X(01)63005-X. ISBN 9780125441667. PMID 11060834.
- Van Dilla, MA; Fulwyler, MJ; Boone, IU (1967). "Volume Distribution and Separation of Normal Human Leucocytes". Experimental Biology and Medicine. 125 (2): 367–370. doi:10.3181/00379727-125-32093. ISSN 1535-3702. PMID 6028547.
- Fulwyler, MJ (1965). "Electronic Separation of Biological Cells by Volume". Science. 150 (3698): 910–911. Bibcode:1965Sci...150..910F. doi:10.1126/science.150.3698.910. ISSN 0036-8075. PMID 5891056.
- Hughes-Jones, NC; Norley, I; Young, JMS; England, JM (1974). "Differential white cell counts by frequency distribution analysis of cell volumes". Journal of Clinical Pathology. 27 (8): 623–625. doi:10.1136/jcp.27.8.623. ISSN 0021-9746. PMC 475415. PMID 4420188.
- Robinson, JP; Cossarizza, A (18 April 2017). Single Cell Analysis: Contemporary Research and Clinical Applications. Springer. pp. 70–73. ISBN 978-981-10-4499-1.
- Thaer, AA; Sernetz, M; Goehde, W (1973). Fluorescence Techniques in Cell Biology. Springer Science & Business Media. pp. 79–88. ISBN 978-3-642-49204-4.
- Julius, MH; Masuda, T; Herzenberg, LA (1972). "Demonstration That Antigen-Binding Cells Are Precursors of Antibody-Producing Cells After Purification with a Fluorescence-Activated Cell Sorter". Proceedings of the National Academy of Sciences. 69 (7): 1934–1938. Bibcode:1972PNAS...69.1934J. doi:10.1073/pnas.69.7.1934. ISSN 0027-8424. PMC 426835. PMID 4114858.
- Picot, J; Guerin, CL; Le Van Kim, C; Boulanger, C (2012). "Flow cytometry: retrospective, fundamentals and recent instrumentation". Cytotechnology. 64 (2): 109–130. doi:10.1007/s10616-011-9415-0. ISSN 0920-9069. PMC 3279584. PMID 22271369.
- Mansberg, HP; Saunders, AM; Groner, W (1974). "The Hemalog D White Cell Differential System". Journal of Histochemistry & Cytochemistry. 22 (7): 711–724. doi:10.1177/22.7.711. ISSN 0022-1554. PMID 4137312.
- Pierre, RV (2002). "Peripheral blood film review: the demise of the eyecount leukocyte differential". Clinics in Laboratory Medicine. 22 (1): 279–297. doi:10.1016/S0272-2712(03)00075-1. ISSN 0272-2712. PMID 11933579.
External links
- Blood Groups and Red Cell Antigens—Free online book at NCBI Bookshelf ID: NBK2261
| Authority control |
|
|---|