Wind power in the European Union
As of December 2017, installed capacity of wind power in the European Union totaled 169.3 gigawatts (GW). In 2017, a total of 15,680 MW of wind power was installed, representing 55% of all new power capacity, and the wind power generated 336 TWh of electricity, enough to supply 11.6% of the EU's electricity consumption.[2]
In the future, wind power is likely to continue to grow in the European Union. According to a European Environment Agency report, wind energy can play a major role in achieving the European renewable energy targets.[3]
The European Wind Energy Association (now WindEurope) has estimated that 230 gigawatts (GW) of wind capacity will be installed in Europe by 2020, consisting of 190 GW onshore and 40 GW offshore. This would produce 14-17% of the EU's electricity, avoiding 333 million tonnes of CO2 per year and saving Europe €28 billion a year in fuel costs.[4][5]
Research from a wide variety of sources in various European countries shows that support for wind power is consistently about 80 per cent among the general public.[6]
By country
Denmark
In 2014 wind power in Denmark provided some 39 percent of Danish domestic electricity[7][8] and Denmark is a leading wind power nation in the world. The Danes were pioneers in developing commercial wind power during the 1970s and today almost half of the wind turbines around the world are produced by Danish manufacturers such as Vestas and Siemens Wind Power.[9]
The Danish wind turbine industry is the world's largest and 90% of the wind turbines manufactured in Denmark are sold to international markets. In 2003, the Danish manufacturers had a total world market share of approximately 38%, generating a combined turnover of almost 3 billion Euro and maintaining over 20,000 people employed in the industry, from wind turbine factories to maintenance and research.[9]
The development of wind power in Denmark has been characterised by a close collaboration between publicly financed research and industry in key areas such as research and development, certification, testing, and the preparation of standards.[8]
Estonia

As of 2013, the installed capacity of wind power in Estonia was 269.4 MW,[10] while roughly 1466.5 MW[11] worth of projects are currently being developed and three major offshore projects with total capacity of 1490 MW are being planned. Estonia, as a country, which is widely open to the sea and has a flat territory, possesses a very high potential for the development of wind energy.[12]
According to a survey carried out by the Estonian Ministry of the Environment, 95% of the respondents considered wind power as the most environmentally friendly way to produce energy.[13]
Germany

Wind power plays an important role in Germany's renewable energy mix. In October 2014, the installed domestic capacity amounted to 35,678 megawatts, of which offshore contributed 616 MW.[14]
In 2014, wind generated more than 51 terawatt-hours of electricity and contributed about 9.7% to the nations total net-generated electricity. This is 1.3% more than the year before. December 2014 was the best month, generating 8.9 TWh and on par with record-breaking month of December 2011. Along with the generated electricity of 18.5 TWh (3.5%) from hydro, 32.8 TWh (6.2%) from solar, and 54 TWh (10.0%) from biomass, all four renewable energy sources generated 154 TWh or about 30% of the nation's total net-generation. Electricity production from combined wind and solar has now achieved almost the level of nuclear power (84.2 TWh vs. 91.8 TWh).[15]
More than 21,607 wind turbines are located in the German federal area and the country has plans to build more wind turbines.[16][17] As of 2011, Germany's federal government is working on a new plan for increasing renewable energy commercialization,[18] with a particular focus on offshore wind farms.[19]
Greece
Wind power in Greece was due to expand by 352% by 2010 to meet the European target of 20% coverage of energy needs from renewable sources. Previously, there were 1,028 wind turbines installed throughout Greece and the number was set to reach 2,587 wind turbines before the end of 2010.[20]
According to the Ministry of Environment and Public Works, the system would have a nameplate capacity of 3,372MW of power from wind alone compared to 746MW at the end of 2006.[21] Greece chose to invest primarily to wind power by 77%, while the rest of renewable sources altogether comprise the remaining 23% of production with hydroelectric power being second with 11%.[22][23]
Ireland
Ireland is the best location in Europe for wind power as it is situated on the Western edge of Europe and is exposed to high winds from the Atlantic Ocean and Irish Sea. Wind power capacity factors tend to be higher in Ireland than anywhere else. By the end of 2014 the installed capacity of wind power in Ireland was 2,111 megawatts,[24] generating 19% of Ireland's electrical power.
Most wind farms in Ireland are located in coastal regions and especially in the West of Ireland. However, the Irish Sea is getting some attention and the first offshore wind farm in Ireland is located a few kilometers north of Arklow and 10 km out to sea and is known as the Arklow Bank Wind Park. This is set to expand in the future. Other proposals are an offshore wind farm on the Kish Bank which is about 15 kilometers offshore from Dublin, the capital city. With another planned wind farm at Clogherhead (north of Drogheda, south of Dundalk), to be called the Oriel Wind Farm. The Codling windfarm, planned for the south Irish Sea, will have a capacity of 1100 MW with 330 turbines, giving a huge boost to wind generated power in Ireland.
Lithuania
The Lithuanian government is planning on mimicking Baltic neighbor Denmark, which generates 20 percent of its energy with wind turbines. Lithuanian government have plans to build 200 megawatts of renewable energy by 2010 in wind turbines.[25]
Romania
As of 2016, wind power in Romania has an installed capacity of about 3,028 MW,[26] up from the 14 MW installed capacity in 2009.[27] Romania has a high wind power potential of around 14,000 MW (second highest in the EU after Scotland) and a power generating capacity of 23 TWh. The main regions of great potential of wind are Northern Dobruja and Moldavia.
Spain
In 2011, Spain was Europe's leading producer of wind energy and ranked second only behind Germany in terms of installed capacity. In 2012, domestic capacity amounted to 22,785 MW.[28][29] Wind power alone covered 16.6% of the total electricity demand in Spain in 2010 (according to Red Eléctrica de España, the Spanish system operator) and continues as the third technology in the system, after nuclear power and combined cycles. Wind energy's installed capacity could meet the electricity needs of two thirds of Spanish households. In 2010, the electricity sector reduced its CO2 emissions by 26% thanks to wind energy.[30][31] "Spain holds these positions as a result of the establishment of a stable regulatory framework, better understanding of the resource, and improved technology that have afforded considerable cost reduction in terms of initial investment, maintenance, and exploitation".[30]
United Kingdom
At the beginning of 2013, the installed capacity of wind power in the United Kingdom was 8,445 megawatts (MW), with 362 operational wind farms and 4,158 wind turbines in the United Kingdom.[32] The United Kingdom is ranked as the world's eighth largest producer of wind power.
1.8 GW of new wind power capacity was brought online during 2012, a 30% increase of the total UK installed capacity. 2012 was a significant year for the offshore wind industry with 4 large wind farms becoming operational with over 1.1 GW of generating capability coming on stream.[33]
Through the Renewables Obligation, British electricity suppliers are now required by law to provide a proportion of their sales from renewable sources such as wind power or pay a penalty fee. The supplier then receives a Renewables Obligation Certificate (ROC) for each MW·h of electricity they have purchased.[34] Within the United Kingdom, wind power is the second largest source of renewable energy after biomass.[35]
Wind power is expected to continue growing in the United Kingdom for the foreseeable future – RenewableUK estimated in 2010 that more than 2,000 MW of capacity would be deployed per year for the next five years.[36] By 2020, the United Kingdom is expected to have more than 28,000 MW of wind capacity.[37] By 2050, UK government plans to cut carbon emissions to zero by using wind power.[38]
Europe's Wind Energy Event
In the Europe's Premier Wind Energy Event February 2013 wind was evaluated by Robert Clover from MAKE Consulting as the cheapest electricity technology after 2020 meeting 50% of electricity demand in Europe by 2050.[39] According to Fatih Birol, Chief Economist at the International Energy Agency, without phasing out fossil fuel subsidies, the EU will not reach its climate targets. The fossil fuel subsidies were half a trillion dollars in 2011. The biggest challenges of wind energy is the lack of predictability of government policies, and not the lack of predictability of wind power, according to Birol. Retroactive policy changes have also undermined investment in renewable energy projects.[40] The European wind industry needs skilled workforce.[41] The EU wind energy capacity in the end of 2012 was 105.6 GW. Renewable energy represented 69% of new power capacity in 2012, while fuel oil, coal and nuclear capacity saw negative growth due to decommissioning.[42]
Public opinion
Recent public opinion surveys about wind power at both the EU and the country level shows that wind energy, being a clean and renewable energy source, is traditionally linked to very strong and stable levels of public support. About 80 per cent of EU citizens support wind power.[6]
| Great Britain | France | Italy | Spain | Germany | |
|---|---|---|---|---|---|
| % | % | % | % | % | |
| Strongly oppose | 6 | 6 | 2 | 2 | 4 |
| Oppose more than favour | 12 | 16 | 11 | 9 | 14 |
| Favour more than oppose | 44 | 44 | 38 | 37 | 42 |
| Strongly favour | 38 | 33 | 49 | 53 | 40 |
Statistics
Installed wind power capacity
| Rank | Country | 2019 | 2018 | 2017 | 2016 | 2015 | 2014 | 2013 | 2012 | 2011 | 2010 | 2009 | 2008 | 2007 | 2006 | 2005 | 2004 | 2003 | 2002 | 2001 | 2000 | 1999 | 1998 |
|---|---|---|---|---|---|---|---|---|---|---|---|---|---|---|---|---|---|---|---|---|---|---|---|
| - | EU-28 | 192,231 | 178,826 | 169,319 | 153,641 | 142,042 | 128,751 | 117,289 | 105,696 | 93,957 | 84,074 | 74,767 | 64,712 | 56,517 | 48,069 | 40,511 | 34,383 | 28,599 | 23,159 | 17,315 | 12,887 | 9,678 | 6,453 |
| 1 | Germany | 61,357 | 59,311 | 56,132 | 50,019 | 44,942 | 39,165 | 33,730 | 31,332 | 29,060 | 27,214 | 25,777 | 23,897 | 22,247 | 20,622 | 18,415 | 16,629 | 14,609 | 11,994 | 8,754 | 6,113 | 4,442 | 2,875 |
| 2 | Spain | 25,808 | 23,494 | 23,170 | 23,026 | 22,987 | 22,986 | 22,959 | 22,796 | 21,674 | 20,676 | 19,149 | 16,689 | 15,131 | 11,623 | 10,028 | 8,264 | 6,203 | 4,825 | 3,337 | 2,235 | 1,812 | 834 |
| 3 | UK | 23,515 | 20,970 | 18,872 | 15,030 | 14,291 | 12,440 | 10,531 | 8,445 | 6,540 | 5,204 | 4,051 | 2,974 | 2,406 | 1,962 | 1,332 | 904 | 667 | 552 | 474 | 406 | 362 | 333 |
| 4 | France | 16,646 | 15,309 | 13,759 | 11,670 | 10,324 | 9,285 | 8,254 | 7,196 | 6,800 | 5,660 | 4,492 | 3,404 | 2,454 | 1,567 | 757 | 390 | 257 | 148 | 93 | 66 | 25 | 19 |
| 5 | Italy | 10,512 | 9,958 | 9,479 | 9,255 | 8,973 | 8,663 | 8,551 | 8,144 | 6.747 | 5,797 | 4,850 | 3,736 | 2,726 | 2,123 | 1,718 | 1,266 | 905 | 788 | 682 | 427 | 277 | 180 |
| 6 | Sweden | 8,985 | 7,407 | 6,691 | 6,519 | 6,029 | 5,425 | 4,470 | 3,745 | 2,907 | 2,163 | 1,560 | 1,048 | 788 | 571 | 509 | 442 | 399 | 345 | 293 | 231 | 220 | 174 |
| 7 | Denmark | 6,128 | 5,758 | 5,476 | 5,242 | 5,075 | 4,845 | 4,772 | 4,162 | 3,871 | 3,752 | 3,465 | 3,163 | 3,125 | 3,136 | 3,128 | 3,118 | 3,116 | 2,889 | 2,489 | 2,417 | 1,771 | 1,443 |
| 8 | Poland | 5,917 | 5,864 | 6,397 | 5,782 | 5,100 | 3,834 | 3,390 | 2,497 | 1,616 | 1,107 | 725 | 544 | 276 | 153 | 83 | 63 | 63 | 27 | 0 | 0 | 0 | 0 |
| 9 | Portugal | 5,437 | 5,380 | 5,316 | 5,269 | 5,034 | 4,914 | 4,724 | 4,525 | 4,083 | 3,898 | 3,535 | 2,862 | 2,150 | 1,716 | 1,022 | 522 | 296 | 195 | 131 | 100 | 61 | 60 |
| 10 | Netherlands | 4,600 | 4,471 | 4,341 | 4,180 | 3,391 | 2,805 | 2,693 | 2,391 | 2,328 | 2,245 | 2,229 | 2,225 | 1,747 | 1,558 | 1,219 | 1,079 | 910 | 693 | 486 | 446 | 433 | 361 |
| 11 | Ireland | 4,155 | 3,564 | 3,127 | 2,765 | 2,440 | 2,272 | 2,037 | 1,738 | 1,631 | 1,428 | 1,260 | 1,027 | 795 | 746 | 496 | 339 | 190 | 137 | 124 | 118 | 74 | 73 |
| 12 | Belgium | 3,879 | 3,360 | 2,843 | 2,400 | 2,169 | 1,959 | 1,651 | 1,375 | 1,078 | 911 | 563 | 415 | 287 | 194 | 167 | 96 | 68 | 35 | 32 | 13 | 6 | 6 |
| 13 | Greece | 3,576 | 2,844 | 2,651 | 2,374 | 2,136 | 1,980 | 1,865 | 1,749 | 1,629 | 1,208 | 1,087 | 985 | 871 | 746 | 573 | 473 | 383 | 297 | 272 | 189 | 112 | 39 |
| 14 | Austria | 3,159 | 3,045 | 2,828 | 2,632 | 2,404 | 2,095 | 1,684 | 1,378 | 1,084 | 1,011 | 995 | 995 | 982 | 965 | 819 | 606 | 415 | 140 | 94 | 77 | 34 | 30 |
| 15 | Romania | 3,029 | 3,029 | 3,029 | 3,028 | 2,976 | 2,954 | 2,599 | 1,905 | 982 | 462 | 14 | 11 | 8 | 3 | 2 | 1 | 1 | 0 | 0 | 0 | 0 | 0 |
| 16 | Finland | 2,284 | 2,041 | 2,113 | 1,533 | 1,005 | 627 | 448 | 288 | 197 | 197 | 146 | 143 | 110 | 86 | 82 | 82 | 52 | 43 | 39 | 39 | 39 | 17 |
| 17 | Bulgaria | 691 | 691 | 691 | 691 | 691 | 691 | 681 | 674 | 612 | 375 | 177 | 120 | 57 | 36 | 10 | 10 | 0 | 0 | 0 | 0 | 0 | 0 |
| 18 | Croatia | 652 | 583 | 583 | 466 | 462 | 347 | 339[53] | 180 | 131 | 89 | 28 | 0 | 0 | 0 | 0 | 0 | 0 | 0 | 0 | 0 | 0 | 0 |
| 19 | Lithuania | 548 | 439 | 421 | 421 | 421 | 279 | 279 | 225 | 179 | 163 | 91 | 54 | 54 | 51 | 48 | 6 | 6 | 0 | 0 | 0 | 0 | 0 |
| 20 | Czech Republic | 337 | 317 | 308 | 281 | 281 | 281 | 269 | 260 | 217 | 215 | 192 | 150 | 116 | 54 | 28 | 17 | 9 | 3 | 0 | 0 | 0 | 0 |
| 21 | Hungary | 329 | 329 | 329 | 329 | 329 | 329 | 329 | 329 | 329 | 295 | 201 | 127 | 65 | 61 | 17 | 3 | 3 | 3 | 0 | 0 | 0 | 0 |
| 22 | Estonia | 320 | 310 | 310 | 310 | 302 | 302 | 280 | 269 | 184 | 149 | 142 | 78 | 59 | 32 | 32 | 6 | 2 | 2 | 0 | 0 | 0 | 0 |
| 23 | Cyprus | 158 | 158 | 158 | 158 | 158 | 147 | 147 | 147 | 134 | 82 | 0 | 0 | 0 | 0 | 0 | 0 | 0 | 0 | 0 | 0 | 0 | 0 |
| 24 | Luxembourg | 136 | 120 | 120 | 100 | 58 | 58 | 58 | 58 | 44 | 44 | 35 | 35 | 35 | 35 | 35 | 35 | 22 | 17 | 15 | 10 | 10 | 9 |
| 25 | Latvia | 66 | 66 | 66 | 70 | 69 | 62 | 62 | 60 | 31 | 30 | 28 | 27 | 27 | 27 | 27 | 27 | 27 | 24 | 0 | 0 | 0 | 0 |
| 26 | Slovenia | 3 | 3 | 3 | 3 | 5 | 2 | 0 | 0 | 0 | 0 | 0 | 0 | 0 | 0 | 0 | 0 | 0 | 0 | 0 | 0 | 0 | 0 |
| 27 | Slovakia | 3 | 3 | 3 | 3 | 3 | 3 | 3 | 3 | 3 | 3 | 5 | 5 | 5 | 5 | 3 | 0 | 0 | 0 | 0 | 0 | 0 | 0 |
| 28 | Malta | 0 | 0 | 0 | 0 | 0 | 0 | 0 | 0 | 0 | 0 | 0 | 0 | 0 | 0 | 0 | 0 | 0 | 0 | 0 | 0 | 0 | 0 |
| - | EU-28 Offshore | 22,069 | 18,441 | 15,780 | 12,406 | 10,994 | 8,045 | 6,562 | 4,993 | 3,810 | 2,944 | 2,061 | 1,471 | 1,088 | |||||||||
| - | Turkey | 8,056 | 7,369 | 6,857 | 6,101 | 4,718 | 3,763 | 2,956 | 2,312 | 1,691 | 1,329 | 801 | 458 | ||||||||||
| - | Norway | 2,444 | 1,675 | 1,162 | 838 | 822 | 819 | 768 | 703 | 520 | 441 | 431 | 429 | 333 | 314 | 267 | 160 | 101 | |||||
| - | Ukraine | 1,170 | 533 | 593 | 526 | 514 | 498 | 371 | 278 | 151 | 87 | 94 | 90 | 89 | 86 | 77 | 0 | 0 | 0 | 0 | 0 | 0 | 0 |
| - | Russia | 191 | 139 | 104 | 15 | 15 | 15 | 15 | 15 | 15 | 9 | 9 | 0 | 0 | 0 | 0 | 0 | 0 | 0 | 0 | 0 | 0 | 0 |
| - | Switzerland | 75 | 75 | 75 | 75 | 60 | 60 | 60 | 50 | 46 | 42 | 18 | 14 | 12 | 12 | 12 | 0 | 0 | 0 | 0 | 0 | 0 | 0 |
| - | North Macedonia | 37 | 37 | 37 | 37 | 37 | 37 | 0 | 0 | 0 | 0 | 0 | 0 | 0 | 0 | 0 | 0 | 0 | 0 | 0 | 0 | 0 | 0 |
| - | Faroe Islands | 18 | 18 | 18 | 18 | 18 | 18 | 7 | 7 | 0 | 0 | 0 | 0 | 0 | 0 | 0 | 0 | 0 | 0 | 0 | 0 | 0 | 0 |
| - | Belarus | 3 | 3 | 3 | 3 | 3 | 3 | 3 | 0 | 0 | 0 | 0 | 0 | 0 | 0 | 0 | 0 | 0 | 0 | 0 | 0 | 0 | 0 |
| - | Iceland | 3 | 3 | 3 | 3 | 3 | 3 | 1.8 | 0 | 0 | 0 | 0 | 0 | 0 | 0 | 0 | 0 | 0 | 0 | 0 | 0 | 0 | 0 |
| - | Europe (MW) | 204,814 | 189,229 | 178,096 | 161,261 | 148,240 | 133,968 | 121,474 | 109,238 | 96,607 | 86,075 | 76,152 | 65,741 | 57,136 | 48,563 | 40,898 |
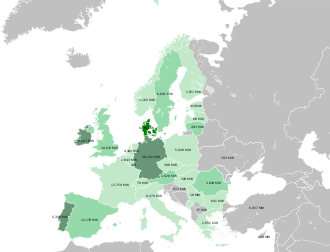
Per capita capacity
Wind power today, in an average wind year, generates the equivalent of over 20% of Denmark's electricity use and 25–30% of that in three German Länder, and on windy days with light loads, over 100% of the load in certain regions, particularly in West Denmark, North Germany, and northern Spain.[54]
| 2007[55] | 2008[56] | 2009[57] | 2010[58] | 2011 | 2012 | 2013 | 2014 | 2015 | 2016 | 2017 | ||
|---|---|---|---|---|---|---|---|---|---|---|---|---|
| Country | % electricity | W/person | W/person | W/person | W/person | W/person | W/person | W/person | W/person | W/person | W/person | W/person |
| 21.3 | 579 | 581 | 627.5 | 686.6 | 706.2 | 745.8 | 837.3 | 850.1 | 894.6 | 911.8 | 947.2 | |
| 7.0 | 270 | 291 | 315.3 | 332.7 | 355.7 | 382.8 | 415.9 | 483.0 | 553.7 | 608.7 | 679.8 | |
| 1.3 | 88 | 111 | 166.9 | 231.6 | 308.7 | 394.8 | 454.0 | 551.0 | 618.1 | 647.7 | 661.6 | |
| 8.4 | 193 | 228 | 283.1 | 319.6 | 364.0 | 375.0 | 439.5 | 490.1 | 537.4 | 580.7 | 652.5 | |
| 9.3 | 203 | 270 | 332.5 | 366.4 | 403.4 | 429.2 | 471.2 | 471.3 | 489.6 | 511.1 | 515.6 | |
| 11.8 | 367 | 370 | 415.5 | 449.6 | 469.2 | 490.8 | 494.3 | 495.0 | 495.8 | 495.6 | 497.8 | |
| 0.3 | 21 | 27 | 27.3 | 36.8 | 36.6 | 53.4 | 81.7 | 114.3 | 182.8 | 278.6 | 383.1 | |
| Average | 3.8 | 116 | 131 | 149.2 | 168.3 | 187.2 | 209.7 | 230.8 | 253.3 | 278.6 | 300.2 | 330.8 |
| 3.3 | 120 | 119 | 118.8 | 120.7 | 128.2 | 163.2 | 195.3 | 243.0 | 281.0 | 299.3 | 320.5 | |
| 1.8 | 40 | 54 | 65.3 | 83.9 | 105.0 | 132.4 | 162.7 | 192.2 | 210.0 | 228.9 | 287.5 | |
| 3.4 | 107 | 136 | 134.0 | 135.4 | 139.1 | 145.3 | 158.7 | 165.3 | 203.0 | 245.3 | 252.6 | |
| 0.7 | 28 | 36 | 52.0 | 81.9 | 98.4 | 124.5 | 147.5 | 175.1 | 198.0 | 212.3 | 249.4 | |
| 3.7 | 78 | 88 | 96.1 | 106.9 | 143.6 | 154.9 | 170.2 | 180.1 | 199.0 | 212.3 | 246.4 | |
| 1.8 | 45 | 58 | 111.3 | 111.0 | 137.2 | 200.8 | 213.4 | 230.2 | 230.7 | 229.2 | 235.1 | |
| 1.2 | 40 | 53 | 69.9 | 87.5 | 104.0 | 114.6 | 123.9 | 139.3 | 156.1 | 174.2 | 204.8 | |
| 1.1 | 71 | 90 | 86.2 | 86.2 | 84.6 | 106.7 | 106.7 | 106.7 | 106.7 | 173.5 | 203.2 | |
| 0 | 0 | 0 | 0 | 102.1 | 166.6 | 170.5 | 170.5 | 170.5 | 186.5 | 185.7 | 184.8 | |
| 1.1 | 15 | 19 | 27.3 | 46.3 | 55.2 | 74.8 | 96.6 | 96.6 | 145.1 | 180.4 | 175.6 | |
| 0.4 | 7 | 12 | 18.5 | 31.0 | 42.3 | 64.9 | 88.1 | 99.6 | 134.2 | 149.7 | 166.5 | |
| 1.7 | 47 | 63 | 80.3 | 96.1 | 111.1 | 133.9 | 140.7 | 142.5 | 147.3 | 152.7 | 156.7 | |
| 0.0 | 0 | 1 | 1 | 19.5 | 45.9 | 90.9 | 133.2 | 151.4 | 157.5 | 154.2 | 154.3 | |
| 0.5 | 10 | 21 | 23.4 | 49.6 | 81.6 | 89.7 | 92.5 | 93.8 | 93.8 | 93.8 | 97.3 | |
| 0.9 | 12 | 12 | 12.5 | 13.8 | 13.9 | 33.3 | 33.5 | 33.5 | 33.5 | 33.5 | 34.2 | |
| 0.4 | 6 | 12 | 20.1 | 29.3 | 32.9 | 33.0 | 33.0 | 33.0 | 33.0 | 33.0 | 33.6 | |
| 0.4 | 11 | 14 | 18.4 | 20.5 | 20.6 | 24.6 | 25.6 | 26.8 | 26.8 | 26.8 | 29.1 | |
Leading EU countries by wind power production
| Country | Production (GWh) |
|---|---|
| Germany | 126,000 |
| United Kingdom | 63,468 |
| Spain | 54,212 |
| France (w/o overseas) | 34,100 |
| Italy | 20,200 |
| Sweden | 19,902 |
| Denmark | 16,149 |
| Poland | 15,000 |
| Portugal | 13,732 |
| Netherlands | 11,458 |
| Ireland | 9,354 |
| Belgium | 8,119 |
| Greece | 7,279 |
| Austria | 7,269 |
| Romania | 6,745 |
| Finland | 5,987 |
See also
- Installed wind power capacity
- European Wind Energy Association (EWEA)
- Global Wind Energy Council
- Renewable energy in the European Union
- Renewable-energy economy
- Wind power by country
- European countries by fossil fuel use (% of total energy)
References
- "Ten biggest onshore wind farms in Europe (July 2013)" (PDF).
- "Wind in Power 2017" (PDF).
- "Europe's onshore and offshore wind energy potential — EEA". Eea.europa.eu. 2009-06-08. Retrieved 2011-04-24.
- http://www.ewea.org/fileadmin/swf/factsheet/1_statisticsandtargets.pdf
- The Harris Poll#119 (October 13, 2010). "Large Majorities in U.S. and Five Largest European Countries Favor More Wind Farms and Subsidies for Bio-fuels, but Opinion is Split on Nuclear Power". PRNewswire.
- "The Social Acceptance of Wind Energy". European Commission.
- Rasmussen, Jesper Nørskov. "Vindmøller slog rekord i 2014 " In English. Energinet.dk, 6 January 2015. Accessed: 6 January 2015. Archived on 6 January 2015
- Wind energy: a visionary match
- "The world's leader in Wind Power". Scandinavica.com. Retrieved 2011-04-24.
- "Installed capacity". EWPA. Retrieved 17 October 2013.
- "Under development". EWPA. Retrieved 17 October 2013.
- "Estonia". pakri.ee. Retrieved 20 September 2012.
- Tuuliki Kasonen (10 August 2012). "95% of Estonians back wind power". EWPA. Retrieved 19 September 2012.
- "Electricity production from solar and wind in Germany in 2014" (PDF). Fraunhofer ISE website. Fraunhofer Institute ISE, Germany. 2014-07-21. p. 5. Archived from the original on 2014-07-22. Retrieved 22 July 2014.
- "Electricity production from solar and wind in Germany in 2014 (German version)" (PDF). Fraunhofer ISE website. Fraunhofer Institute ISE, Germany. 5 January 2015. pp. 2, 3. Retrieved 5 January 2015.
- "Wind energy in Germany".
- "72,6 Gigawatts Worldwide" (PDF). Wind Energy Barometer. February 2007. Retrieved 4 July 2007.
- "100% renewable electricity supply by 2050". Federal Ministry for Environment, Nature Conservation and Nuclear Safety. 26 January 2011. Retrieved 4 June 2011.
- Schultz, Stefan (23 March 2011). "Will Nuke Phase-Out Make Offshore Farms Attractive?". Spiegel Online. Retrieved 26 March 2011.
- Greece commits for 2,587 wind turbines
- Rising to the Challenge:the growth of wind power generation in Greece
- Greek Ministry of Environment
- Greece Renewable Energy - Europa Fact Sheet
- http://www.eirgrid.com/media/All-Island_Wind_and_Fuel_Mix_Report_December_2014%20%282%29.pdf All-island Wind and Fuel Mix report for December 2014
- Adam Mullett (2008-12-03). "Bridging Lithuania's energy gap. Adam Mullett. December 3, 2008". Baltictimes.com. Retrieved 2011-04-24.
- EWEA (February 2014). "Wind in power: 2013 European statistics" (PDF). European Wind Energy Association. Retrieved 2014-11-05.
- "Romania Has 800 Turbines, Investments In Wind Farms Exceed EUR1.5B In 2012". ZF English. 2012-12-27. Retrieved 2012-12-27.
- http://www.renewableenergyworld.com/rea/news/article/2011/04/spanish-wind-generated-more-power-than-germanys-in-2010
- https://www.ieawind.org/countries/spain.html
- Montes, G.; Martínez, Germán; Enrique, Prados Martín; Ordóñez García, Javier (2007). "The current situation of wind energy in Spain". Renewable and Sustainable Energy Reviews. Elsevier. 11 (3): 467–481. doi:10.1016/j.rser.2005.03.002.
- "UK wind power reaches milestone". BBC. 2007-02-09. Retrieved 2007-02-15.
- EWEA: "Wind in power: 2012 European statistics", February 2013
- RenewableUK Wind Energy statistics
- Renewables Obligation. Ofgem.gov.uk.
- Department of Energy and Climate Change (2010), Digest of United Kingdom energy statistics (DUKES) 2010, Stationery Office, ISBN 978-0-11-515526-0, retrieved 7 June 2011
- RenewableUK 23 September 2010 Press Release. Bwea.com.
- Jowit, Juliette (26 February 2012). "Windfarms axed as UK loses its taste for turbines". The Guardian. Retrieved 2 March 2012.
- "The road to clean energy". BBC.com.
- Wind will be cheapest electricity generating technology by 2020 EWEA 04 Feb 2013
- Fossil fuel subsidies are "public enemy number one" – IEA Chief EWEA 04 Feb 2013
- Feb 2013
- 8/2/2013: EU wind power grows in 2012 - but industry challenged in 2013
- EWEA Staff (2010). "Cumulative installed capacity per EU Member State 1998 - 2009 (MW)". European Wind Energy Association. Retrieved 2010-05-22.
- EWEA Staff (February 2011). "EWEA Annual Statistics 2010" (PDF). European Wind Energy Association. Retrieved 2011-01-31.
- EWEA Staff (February 2012). "EWEA Annual Statistics 2011" (PDF). European Wind Energy Association. Retrieved 2011-02-18.
- EWEA Staff (February 2014). "EWEA Annual Statistics 2013" (PDF). European Wind Energy Association. Retrieved 2014-02-11.
- EWEA Staff (February 2015). "EWEA Annual Statistics 2014" (PDF). European Wind Energy Association. Retrieved 2015-02-11.
- EWEA: "Wind in power: 2014 European statistics", February 2014
- EWEA: "Wind in power: 2016 European statistics", February 2017
- "Wind in Power 2017" (PDF). WindEurope. 2017. Retrieved 2018-02-19.
- "Wind Energy in Europe in 2018" (PDF). WindEurope. 2018. Retrieved 2019-05-02.
- "Wind Energy in Europe in 2019" (PDF). WindEurope. 2019. Retrieved 2020-02-22.
- http://www.poslovni.hr/hrvatska/do-kraja-godine-280-novih-postrojenja-na-obnovljive-izvore-energije-289636
- Lovins, Amory B. (2005). Nuclear power: economics and climate-protection potential, see footnote 28.
- Pure Power, Wind Energy Scenarios up to 2030 EWEA April 2008 s. 20-21
- Wind energy barometer 2008 EurObserv’ER Systèmes solaires Le journal des énergies renouvelables n° 189, 4/2009, p.54, 72
- Wind energy barometer 2009 EurObserv’ER Systèmes solaires Le journal des énergies renouvelables n° 195, 3/2010, p.48
- Wind energy barometer 2010
- "Wind Energy Barometer 2020". EU Observ'ER.
External links
- The European Wind Energy Association
- European Wind Energy Conference and Exhibition
- Wind Power Seen As Key Part Of Europe’s 20% Renewable Energy Target
- EWEA: 180 GW of Wind Power Possible in Europe by 2020
- Europe’s biggest onshore wind farm plugs into the national grid
- Offshore wind to take EU by storm?
| Wind power | ||
|---|---|---|
| Wind farms | ||
| Wind turbines | ||
| Wind power industry | ||
| Manufacturers |
| |
| Concepts | ||
| ||
| Africa |
| ||||
|---|---|---|---|---|---|
| Asia | |||||
| Europe |
| ||||
| North America | |||||
| Oceania | |||||
| South America | |||||
| |||||