Wind power in Denmark
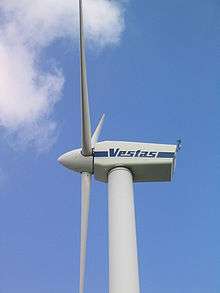
Denmark was a pioneer in developing commercial wind power during the 1970s, and today a substantial share of the wind turbines around the world are produced by Danish manufacturers such as Vestas and Siemens Wind Power along with many component suppliers. In Denmark's electricity sector wind power produced the equivalent of 47% of Denmark's total electricity consumption in 2019,[2] increased from 43.4% in 2017,[3][4] 39% in 2014,[5][6] and 33% in 2013.[7] In 2012, the Danish government adopted a plan to increase the share of electricity production from wind to 50% by 2020,[8] and to 84% by 2035.[9] Denmark had the 4th best energy architecture performance in the world in 2017 according to the World Economic Forum,[10] and the second best energy security in the world in 2019 according to the World Energy Council.[11]
History
Danish inventor Poul la Cour experimented, taught and constructed wind power subjects around the year 1900.[12][13]
As concerns over global warming grew in the 1980s, Denmark found itself with relatively high carbon dioxide emissions per capita, primarily due to the coal-fired electrical power plants that had become the norm after the 1973 and 1979 energy crises.[14] Renewable energy became the natural choice for Denmark, decreasing both dependence on other countries for energy and global warming pollution.
Many countries tried to subsidize green technology such as wind power, and most failed to make a viable industry. The Danish system was an exception, providing 30% of initial capital cost in the early years which was gradually reduced to zero, but still maintaining a feed-in tariff.[15] The capital cost subsidy was reduced to 20% in June 1985, when wind turbines received DKK 50 million per year. Other renewable energy forms received 37 million.[16] The research institution Teknologisk Institut identified many specific improvement needs, pushing development from ad hoc to systemized solutions.[17]
On 29 March 1985, one year before the Chernobyl disaster, the Danes passed a law forbidding the construction of nuclear power plants. In the process the Danish grassroots movement had a substantial role. The Danish Anti-nuclear Movement's (OOA) smiling-sun logo "Atomkraft, Nej Tak" ("Nuclear Power, No Thanks") spread worldwide, and the renewable alternatives were promoted by the Danish Organisation for Renewable Energy (OVE).
Denmark adopted a target of cutting carbon emissions by 22% from 1988 levels by 2005.[14] Planning of wind power was deliberately streamlined by authorities in order to minimize hurdles.[18]
Wind resources
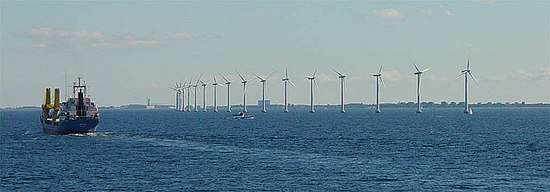
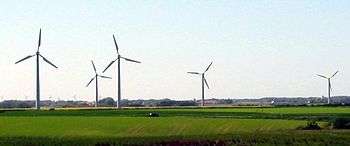
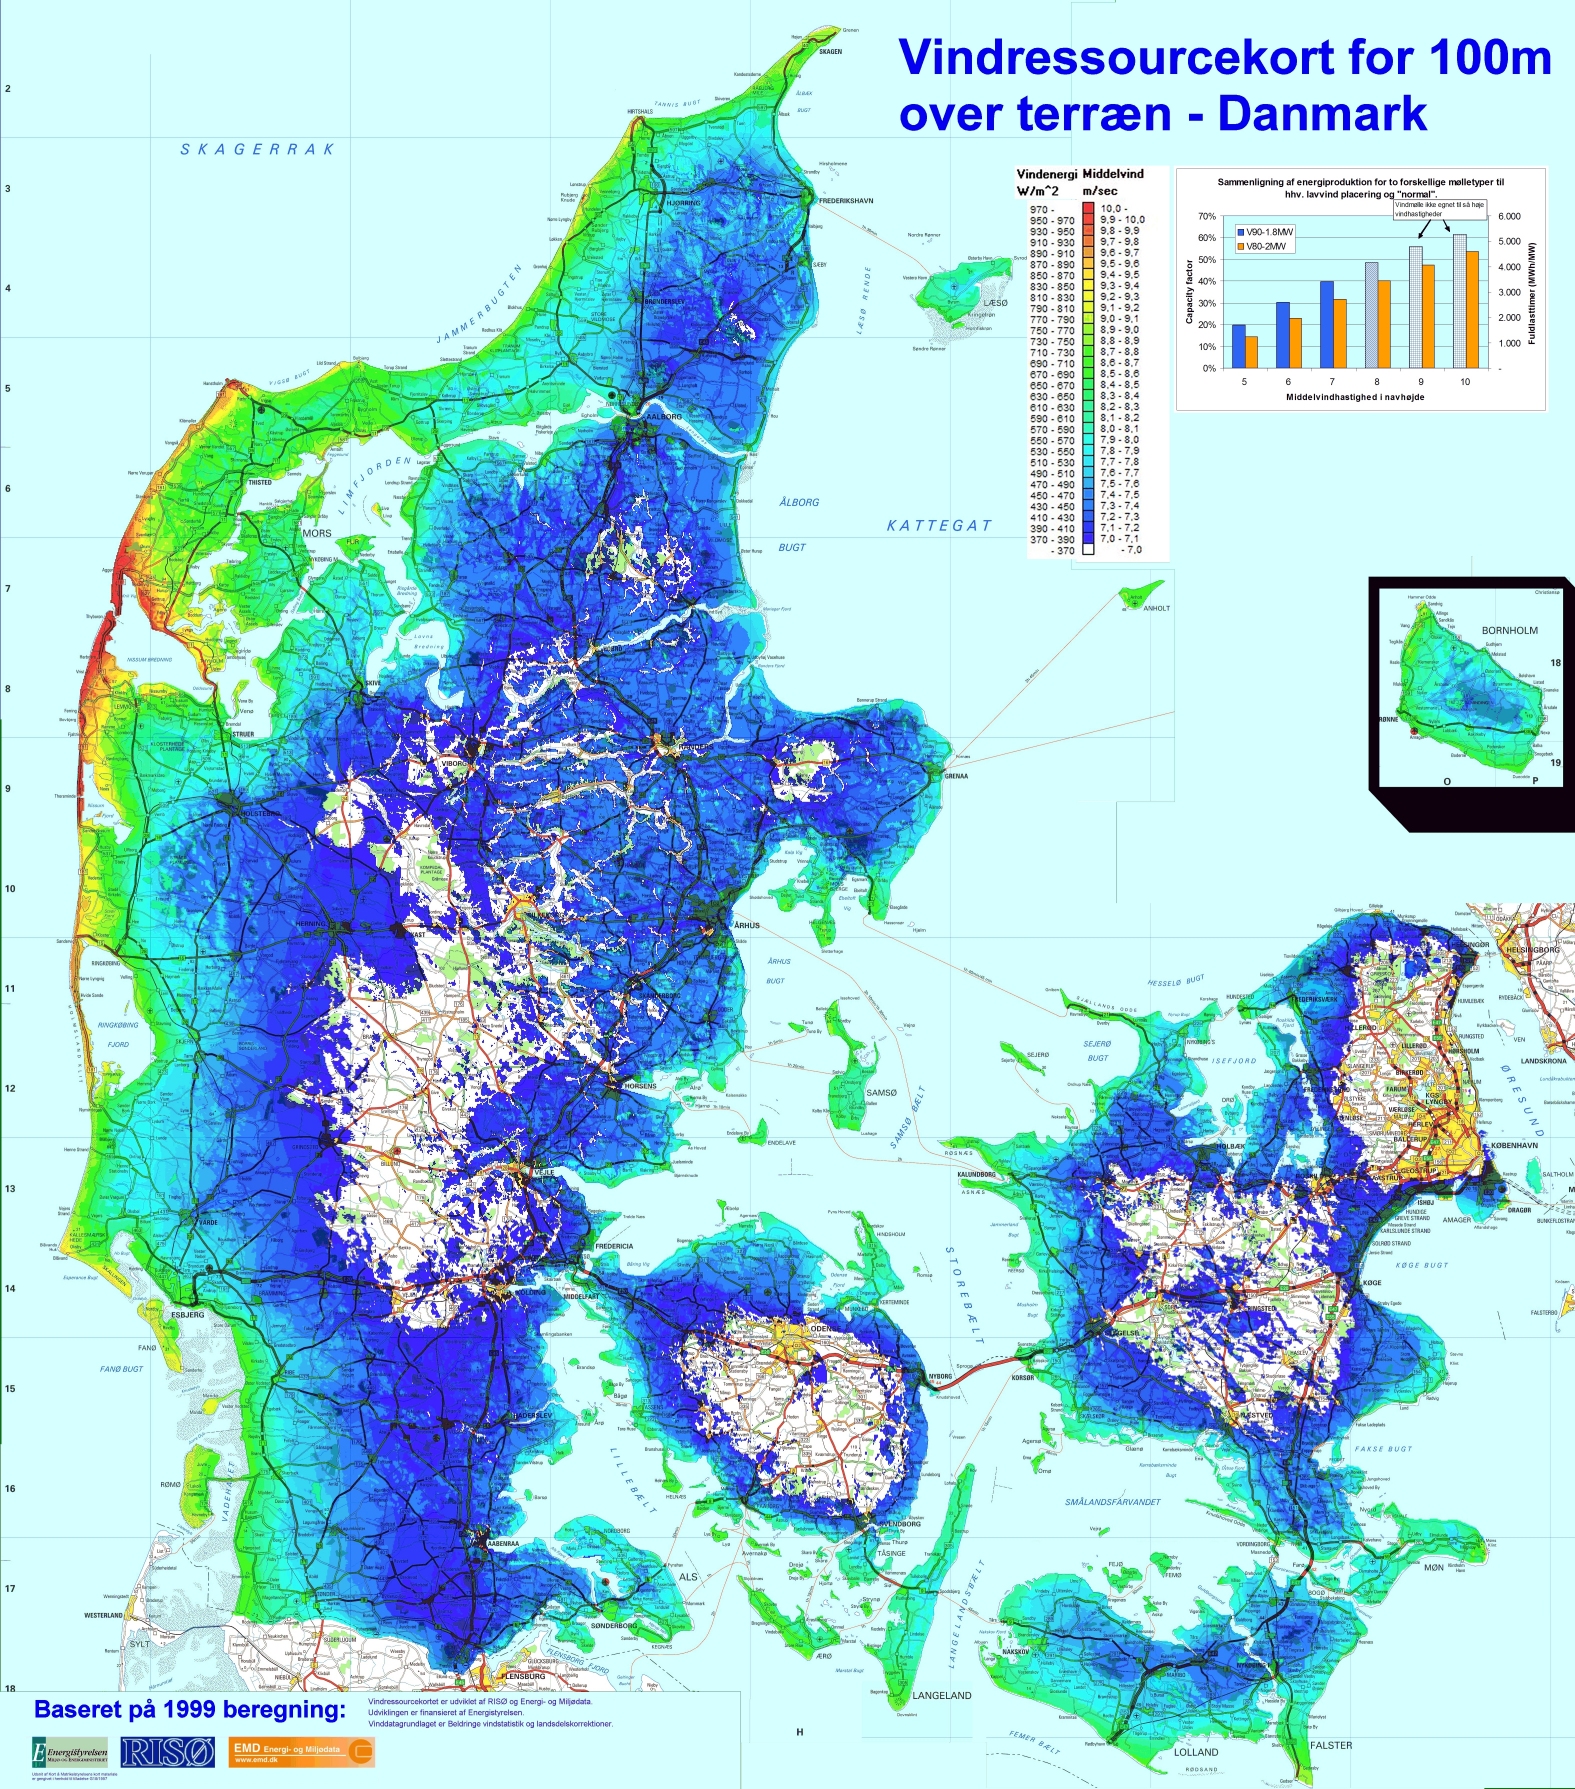
Denmark has relatively modest average wind speeds in the range of 4.9–5.6 m/s measured at 10 m height. Onshore wind resources are highest in the western part of the country, and on the eastern islands with coastlines facing south or west. The country has very large offshore wind resources, and large areas of sea territory with a shallow water depth of 5–15 m, where siting is most feasible. These sites offer higher wind speeds, in the range of roughly 8.5–9.0 m/s at 50 m height.[19] There have been no major problems from wind variability, although there is a temporary problem resulting from the connection of a large bloc of wind power from offshore wind farms to a single point on a weak section of the transmission network.[20] The wind resource over Denmark was mapped in 1999 by EMD International A/S and Risø National Laboratory. The mapping was made using a 200 m grid resolution using the models in WindPRO and WAsP. The results were validated on more than 1200 wind turbines nationwide.[21]
Denmark is connected by transmission line to other European countries (e.g. Cross-Skagerrak)[22] at an electricity interconnection level (transmission capacity relative to production capacity) of 44%.[23] Denmark has also retained its traditional power plants, therefore it does not need to install additional peak-load plants to balance its wind power. Instead, it purchases additional power from its neighbours when necessary. With some strengthening of the grid, Denmark plans to increase wind's share even further[24] to 50% of consumption in 2020,[25] and up to 84% in 2035.[9]
Analysts expect the cost of wind power to be 30 øre/kWh and its handling cost to be 15 øre/kWh, being lower than coal and natural gas at 55 øre/kWh minimum.[26] Due to their inability to follow load wind power gets a lower price.[27]
Consumption related to wind power
Danish district heating plants use 100 Petajoule/year,[28] but little of this consumption is from 180 MW of electrode boilers installed in powerplants or 37 MW of large heat pumps. The boilers are only used to soak up the powerplant's own electricity when prices are negative, to avoid paying tax.[29][30][31][32] Expansion of wind powered district heating is calculated to be economically efficient without taxes.[33][34][35]
The number of household heat pumps has stalled at 70,000 in 2015 due to tax-free wood pellets, and the goal of 300,000 small heat pumps in 2035 is unlikely to be reached, reducing the value of more wind power unless electricity tax is reduced.[36]
Capacities and production
At the end of 2015, Denmark's capacity stood at 5,070 MW.
Denmark has the highest proportion of wind power in the world. In 2015, Denmark produced 42% of electricity from wind,[38][4] up from the 2014 record of 39% of total power consumption. For the month of January 2014, that share was over 61%. The month of lowest wind power share was July at 23%.[5] Denmark also had 548 MW of solar power[39] (790 MW in late 2015).[40] A peak generation period occurred on 21 December 2013 when the wind share was 102%, and for 1 hour the share was 135%.[7]
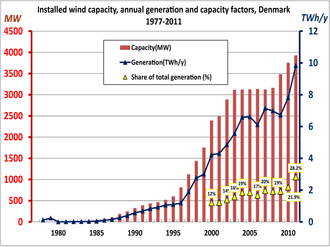
In 2005, Denmark had installed wind capacity of 3,127 MW, which produced 23,810 TJ (6.6 TW·h) of energy, giving an actual average production of 755 MW at a capacity factor of 24%.[41] In 2009, Denmark's wind capacity grew to 3,482 MW; most of the increase came from the 209 MW Horns Rev 2 offshore wind farm, which was inaugurated on September 17, 2009 by Crown Prince Frederik.[42] In 2010, capacity grew to 3,752 MW, and most of the year's increase came from the Rødsand II off-shore wind farm. Large increases occurred in 2014 with the 400 MW Anholt wind farm,[5] and in 2019 with the 407 MW Horns Rev 3 wind farm.[43]
Wind power output reduces spot market prices in general via the merit order effect; in 2008 this caused a net reduction of pre-tax electricity prices (balancing the increase from the feed-in law).[44]
| Year | 1970 | 1971 | 1972 | 1973 | 1974 | 1975 | 1976 | 1977 | 1978 | 1979 |
|---|---|---|---|---|---|---|---|---|---|---|
| Installed wind capacity (kW)[45] | 52 | 813 | 1,090 | |||||||
| Electricity generated (MW·h)[45] | 120 | 240 | ||||||||
| Year | 1980 | 1981 | 1982 | 1983 | 1984 | 1985 | 1986 | 1987 | 1988 | 1989 |
| Installed wind capacity (MW)[45] | 2.7 | 6.3 | 10.6 | 14.3 | 19.8 | 47.0 | 72.4 | 111.9 | 190.3 | 246.7 |
| Electricity generated (GW·h)[45] | 2 | 5 | 12 | 19 | 26 | 44 | 104 | 154 | 266 | 398 |
| Year | 1990 | 1991 | 1992 | 1993 | 1994 | 1995 | 1996 | 1997 | 1998 | 1999 |
| Installed wind capacity (MW)[45] | 326 | 393 | 436 | 468 | 521 | 600 | 814 | 1,123 | 1,438 | 1,753 |
| Electricity generated (TW·h)[45] | 0.57 | 0.68 | 0.83 | 0.92 | 1.06 | 1.09 | 1.19 | 1.89 | 2.76 | 3.00 |
| Year | 2000 | 2001 | 2002 | 2003 | 2004 | 2005 | 2006 | 2007 | 2008 | 2009 |
| Installed wind capacity (MW)[45] | 2,390 | 2,497 | 2,890 | 3,116 | 3,123 | 3,127 | 3,135 | 3,124 | 3,163 | 3,482 |
| Electricity generated (TW·h)[45] | 4.22 | 4.31 | 4.86 | 5.56 | 6.58 | 6.61 | 6.11 | 7.14 | 6.98 | 6.72 |
| Wind power share in the electricity supply (%)[46] | 12.1 | 12.2 | 13.9 | 15.8 | 18.5 | 18.5 | 16.8 | 19.7 | 19.1 | 19.3 |
| Year | 2010 | 2011 | 2012 | 2013 | 2014 | 2015 | 2016 | 2017 | 2018 | 2019 |
| Installed wind capacity (MW)[7][45][47] | 3,752 | 3,927 | 4,162 | 4,792 | 4,855 | 5,070 | 5,229 | 5,475 | 6,131 | 6,128 |
| Electricity generated (TW·h)[7][45][48] | 7.81 | 9.77 | 10.27 | 11.12 | 13.08 | 14.13 | 12.8 | 14.8 | ||
| Wind power share in domestic electricity supply (%)[7][46][49] | 20.2 | 28.0 | 33.7 | 32.2 | 41.0 | 49.2 | N/A | 48 | ||
| Wind power share in domestic electricity usage (%)[4][5][7][46][50] | 21.9 | 28.2 | 29.9 | 32.7 | 39.1 | 42.0 | 37.6 | 43.4 | ||
| Price levels for large offshore wind farms in Denmark | |||||||||||||||||||||||||||||||||||||||||||||||||||||||||||||||||||||||||
|
| ||||||||||||||||||||||||||||||||||||||||||||||||||||||||||||||||||||||||
The chart shows the minimum (guaranteed) price a plant receives during the FLH period in øre/kWh. Subsidy = guaranteed price minus market price. FLH=Full Load Hours; the amount of production the plant receives support for. After that, the plant usually receives market price. Transmission is included in the nearshore "Vesterhav", but not the other plants. The levels are usually below levels in Germany and UK.[52][53][54][55][51]
Peak records

As Denmark continues to install additional capacity, they continue to set new production records. This is a natural consequence of capacity growth. On 9 July 2015, in the evening, unusually strong wind conditions resulted in 116% of national electricity consumption being produced by wind farms and at 3 am the next morning at low demand, wind production exceeded 140% of current demand.[4][56]
Future parks in Denmark
Offshore
On 22 March 2012 a coalition of parties representing 95% of all members of the Danish parliament agreed that the Danish state would increase the country's offshore wind capacity by 1,500 MW.[57][58] The 1,500 MW extra capacity will be achieved by constructing the future offshore wind farms Horns Rev 3 with a capacity of 400 MW in the North Sea[58] at 77 øre/kWh[59] and Kriegers Flak at 37.2 øre/kWh[51] with a capacity of 600 MW in the Baltic Sea close to the borders of Germany and Sweden.[58] Kriegers Flak will also be used to connect Denmark and Germany with a 400MW cable, through the German Baltic 2 Offshore Wind Farm,[60] and Energinet ordered electrical equipment in early 2016.[61][62] Horns Rev 3 is set to be operational in 2019[63] while Kriegers Flak and all the nearshore wind farms are set to be fully operational[58][64] around 2021. Eight groups applied for pre-qualification for Kriegers Flak,[65] of which 7 were approved[66] - 3 more than the 4 companies approved to compete for Horns Rev 3,[67] both having more bidders than the single bidder for Anholt.
Nearshore
In addition 6 nearshore wind farms with a total capacity of up to 450 MW will be constructed along with 50 MW of experimental offshore wind farms. The nearshore differ from conventional offshore in having the being close enough to the coast to have the transformer on land, decreasing cost.[58] The first 350 MW were called for tenders in 2015, with a maximum price of 70 øre/kWh.[68][69][70] Vattenfall bid the lowest price for the 350 MW nearshore farms at 47,5 øre/kWh in September 2016,[71] but the political situation was unclear.[72]
Onshore
In addition to the offshore projects, a further 500 MW additional net capacity of onshore windfarms is expected to be constructed until 2020. The 500 MW of additional net capacity is the expected result of the scrapping of 1,300 MW capacity from obsolete wind turbines combined with the simultaneous building of 1,800 MW capacity of modern wind turbines – a process also known as repowering.[73]
Electricity exports from Denmark
Annual wind power production is currently (2017) equal to about 43% of electricity consumed in Denmark.[50] The proportion of this that is actually consumed in Denmark has been disputed, as the considerable hydropower resources of Norway (and to some extent, Sweden) is used as grid storage with low loss. Hydropower can rapidly reduce generation whenever wind farms are generating power, saving water for later, and can export electricity to Denmark when wind power output drops. Short term, Denmark imports electricity from Norway during daytime and exports in nighttime. Long term, Denmark imports electricity in summer and exports in winter. Wind is higher in autumn and winter, when consumption is also high.[74] This service of timeshifting production and consumption is also found around the world in pumped-storage hydroelectricity balancing coal and nuclear plants.
For timeshifting trade with Norway, Denmark exports at DKK 157/MWh and imports at DKK 212/MWh.[35] The correlation is low between wind power in Norway and Denmark.[74] Market price sometimes falls to near or below zero, particularly in high winds and low consumption.[75] In 2014, there were 46 hours with negative prices, costing DKK 37.7 million.[76] In 2015, negative prices occurred in 65 hours in West Denmark and 36 hours in East Denmark - less than 1% of the time. Danish prices are mainly negative when German prices are even more negative. The 24 hour period of 2 September 2015 was the first such occasion when no central power plants were running in West Denmark, and grid stability was maintained by compensators.[4]
Denmark is generally a transit country for electricity trade between the much larger markets in Norway, Sweden and Germany,[77][78] and plans to add cables to the Netherlands (COBRAcable) and England (Viking Link) as well, further increasing the function of being a crossroads for electricity.
From 2005 50 2010, claims of up to 40% of wind power being exported have been made,[79][80] countered by claims that only 1% was exported.[81]
According to the first argument, power in excess of immediate demand is exported to neighbouring countries at lower prices. Part of the benefit of this goes to Denmark's northern neighbours: when Denmark exports power, it is sold at the spot market price which must be lower than at the importing market in order to be transmitted.
According to the second argument, the correlation between exports and wind power is weak, and a similar correlation exists with conventional thermal plants running partly for district heating; meanwhile, causal analysis shows that export from Denmark typically occurs as a consequence of the merit order effect, when large thermal plants have reserve capacities at times the spot market price of electricity is high.
In any case, the export price is the intermediate between the prices of the two areas, so the exporting TSO (Energinet) uses the profit to relieve tariffs[82] at around DKK 500 million per year.[83] Wind power organizations state that Denmark exports power at a higher price than it imports at.[84]
Economic conditions
Wind turbine industry
The Danish wind turbine industry is the world's largest. Around 90% of the national output is exported, and Danish companies accounted for 38% of the world turbine market in 2003, when the industry employed some 20,000 people and had a turnover of around 3 billion euro.[85] The return of investment dropped from near 20% before the financial crisis, to 10% some years later.[86][87] The Danish wind turbine industry had a turnover of DKK 84 billion in 2014.[88]
The biggest wind turbine manufacturers with production facilities in Denmark are Vestas and Siemens Wind Power.
The development of wind power in Denmark has been characterized by a close collaboration between publicly financed research and industry in key areas such as research and development, certification, testing, and the preparation of standards.[89] For example, in the 1980s, a large number of small Danish companies were developing wind turbines to sell to California, and the Danish Risø laboratory provided test facilities and certification procedures. These resulted in reliable products and the rapid expansion of the Danish turbine manufacturing industry.[90] Components are tested at LORC in Odense, and new large prototype turbines between 4-8 MW (including some non-Danish ones) are being tested at Østerild. Limited production turbines (four Siemens 7MW with 66kV cabling) are to be supported at Nissum Bredning at a cost of DKK 300m, partially financed by local people.[91][92][93]
Danish wind economics
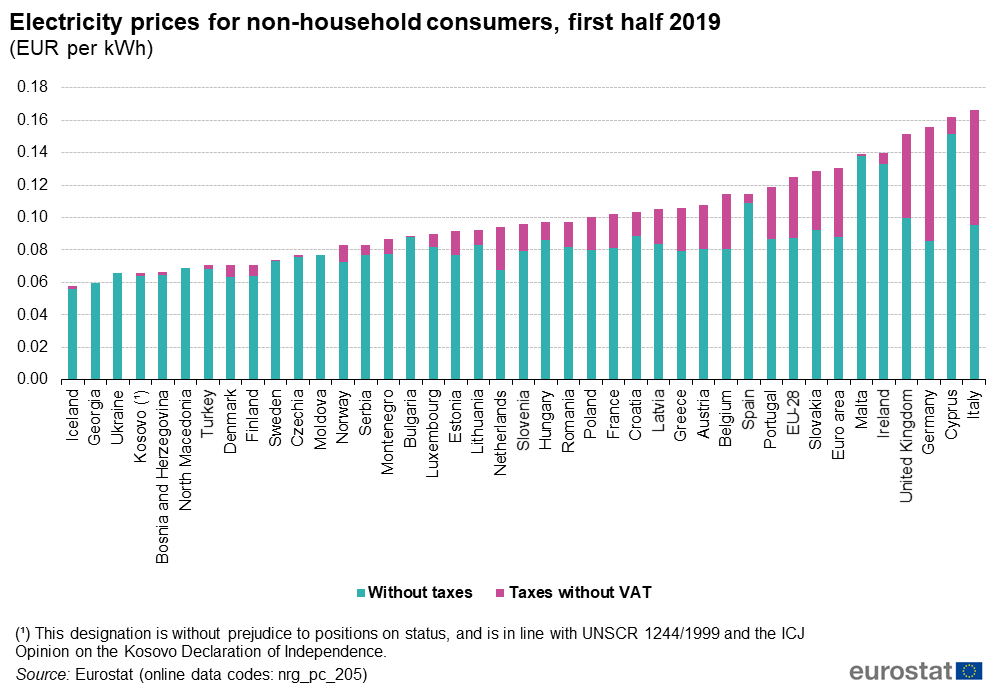
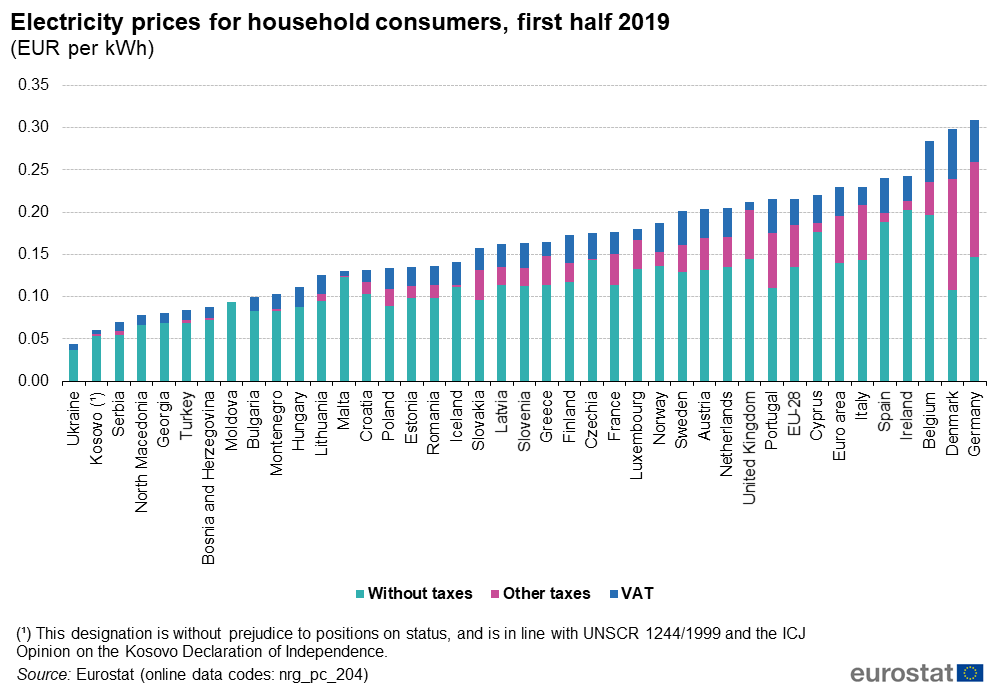
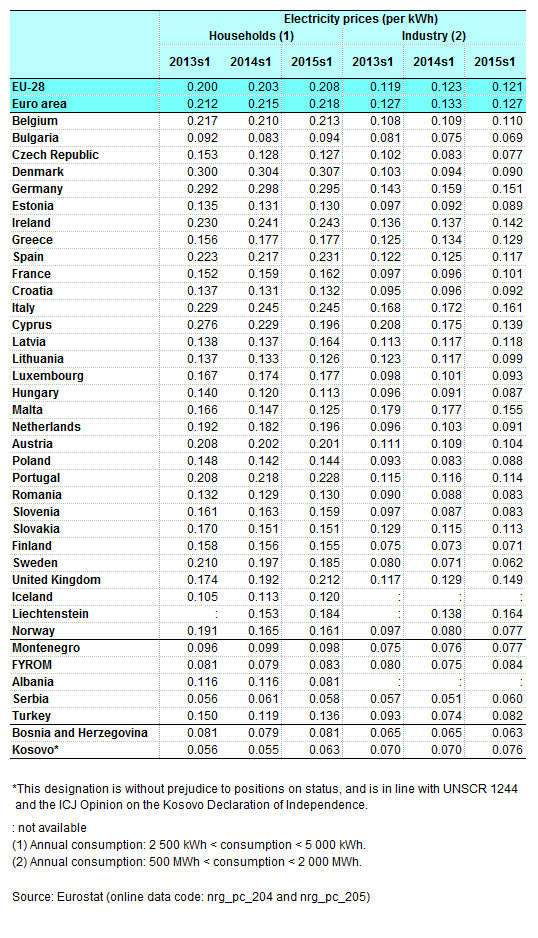
Denmark's electricity costs (including PSO; costs for cleaner energy) are average in the EU,[95][96][97] but taxes increase the price to the highest in Europe.[98] The tax money is a considerable income for the state, and changing the composition of the taxes towards a "greener" mix is difficult. According to a government official, the majority of taxes are not based on environment concerns,[99] in contrast to the DKK 5 billion per year in PSO-money for cleaner energy, paid by electricity consumers to producers of clean electricity. These tolls are not available for government consumption.[100]
Actual consumer-paid incentives (PSO) to new wind turbines depend on year of commission, but is generally around 25 øre (3.4 eurocent) per kWh for a limited number of hours, although support is discounted if combined price exceeds 58 øre/kWh. PSO is also used for biomass, solar, and district heating; total PSO was DKK 5.8 billion in 2013, of which DKK 3.2 billion went to wind power.[100] In 2015, the cost of power was only 32% of the price, while PSO was 9%, and tolls and VAT the remaining 59%.[94]
Wind power displaces coal, oil and gas to some degree, reducing running cost for fossil fuels. Consumption of coal was more than halved over 10 years.[101] Wind power reduces price variability slightly.[102]
- Criticism
In 2009, the think tank Institute for Energy Research (IER) commissioned the Danish think-tank CEPOS (Centre for Political Studies) to report on electricity exports from Denmark and the economic impact of the Danish wind industry. The resulting report states that Danes pay the highest residential electricity rates in the European Union (mostly for government revenue, but partly to subsidize wind power), and that the cost of saving a ton of carbon dioxide between 2001 and 2008 has averaged 647 DKK (€87, US$124). It also estimated that 90% of wind industry jobs were transferred from other technology industries, and states that as a result Danish GDP is 1.8 billion DKK (US$270 million) lower than it would have been without wind industry subsidies of 1.7-2.6 billion DKK (roughly $320M - $480M) yearly in 2001-2005.[103] The report was later heavily criticised.[104] The Danish engineering magazine Ingeniøren claimed that the report was ordered and paid for by the American oil and coal lobby through IER.[105] Later, several Danish researchers and professors from all technical universities in Denmark wrote a joint response to the report, refuting it.[106][107] The report from CEPOS was even brought to government level, where minister of Climate and Energy Lykke Friis discredited the work done by CEPOS and the report.[108] The World Nuclear Association estimates that the report was IER's response to US president Obama's 2009 Earth Day speech in Newton, Iowa, claiming that the United States could generate 20% of its electricity from wind by 2030, as Denmark already was.[109][110]
Wind turbine cooperatives
To encourage investment in wind power, families were offered a tax exemption for generating their own electricity within their own or an adjoining municipality.[111] While this could involve purchasing a turbine outright, more often families purchased shares in wind turbine cooperatives which in turn invested in community wind turbines. By 1996 there were around 2,100 such cooperatives in the country.[111] Opinion polls show that this direct involvement has helped the popularity of wind turbines, with some 86% of Danes supporting wind energy when compared with existing fuel sources.[85]
The role of wind turbine cooperatives is not limited to single turbines. The Middelgrunden offshore wind farm – with 20 turbines the world's largest offshore farm at the time it was built in 2000 – is 50% owned by the 10,000 investors in the Middelgrunden Wind Turbine Cooperative, and 50% by the municipal utility company,[112] as is the Avedøre near-shore turbines.
By 2001 over 100,000 families belonged to wind turbine cooperatives, which had installed 86% of all the wind turbines in Denmark.[113] By 2004 over 150,000 were either members or owned turbines, and about 5,500 turbines had been installed, although with greater private sector involvement the proportion owned by cooperatives had fallen to 75%.[85] The cooperative model has also spread to Germany and the Netherlands.
Samsø Island
The island of Samsø erected 11 one-megawatt, land-based wind turbines in 2000, followed by ten offshore 2.3 MW wind turbines completed in 2003. Together with other renewable energy measures, this community of 4,200 achieved fame,[114] claiming that it is the largest carbon-neutral settlement on the planet.[115] This claim exploits the general understanding that one can neglect carbon-dioxide and other pollution from fossil fuel consumption (cars, imported electricity, heating for houses, etc.), If the yearly average electricity production from sustained sources is higher than the total energy consumed. However, the government of Samsø is addressing the fossil fuel consumption issue in motoring - they've decided that all traffic on Samsø is to go electric.
See also
- List of offshore wind farms in Denmark
- List of offshore wind farms in the North Sea
- List of offshore wind farms in the Baltic Sea
- Vestas V164
- Renewable energy in Denmark
- Energy in Denmark
- Electricity sector in Denmark
- Solar power in Denmark
- Biofuel in Denmark
- Hydrogen energy plant in Denmark
- Danish Organisation for Renewable Energy (OVE)
- Nordic energy market
References
- "Environmental Capital of Europe". Copenhagen, Environmental Capital of Europe. Archived from the original on 2007-07-06. Retrieved 2009-01-05.
- "Denmark sources record 47% of power from wind in 2019". Reuters. 2020-01-02. Retrieved 2020-01-14.
- "Denmark on track to have 50% renewable energy by 2030".
- "New record-breaking year for Danish wind power". Energinet.dk. 15 January 2016. Archived from the original on 25 January 2016.
- Rasmussen, Jesper Nørskov. "Vindmøller slog rekord i 2014 Archived 2015-01-06 at the Wayback Machine" (in Danish) Energinet.dk, 6 January 2015. Accessed: 6 January 2015.
- Kjetil Malkenes Hovland (3 September 2014). "Denmark's Wind Power Output Rises to Record in First Half". WSJ.
- Carsten Vittrup. "2013 was a record-setting year for Danish wind power Archived 2014-10-18 at the Wayback Machine" (in Danish) Energinet.dk, 15 January 2014. Accessed: 20 January 2014.
- The Guardian: "Denmark aims to get 50% of all electricity from wind power", 26 March 2012
- Lindboe, page 3
- "Global Energy Architecture Performance Index Report 2017 – Table of Rankings". World Economic Forum. 22 March 2017. Retrieved 2020-01-14.
- "World Energy Trilemma Index 2019" (PDF). World Energy Council. Retrieved 2020-01-15.
- Lyngsø-Petersen, Erik. "Poul la Cour og hans tid" Ingeniøren, 6 September 1985
- Hansen, Hans Christian (1985): "Poul la Cour, grundtvigianer, opfinder og folkeoplyser." Doctoral thesis in Danish with an English summary. Extract Archived 2016-09-13 at the Wayback Machine
- Soren Krohn (2002-02-22). "Wind Energy Policy in Denmark: Status 2002" (PDF). Danish Wind Industry Association. Archived from the original (PDF) on 2007-09-27. Retrieved 2007-09-08.
- Sørensen, Bent. Renewable energy: its physics, engineering, use, environmental impacts, economy, and planning aspects page 762. Academic Press, 2004. ISBN 0-12-656153-2, ISBN 978-0-12-656153-1 Retrieved: 6 November 2010.
- Møller løber med støtten, Ingeniøren, 6 September 1985
- Opfind noget til en vindmølle, Ingeniøren, 6 September 1985
- Streamline Renewable Energy Policy and make Australia a World Leader Energy Matters, 11 August 2010. Retrieved: 6 November 2010.
- Case Study: Wind energy in Denmark Archived 2008-07-25 at the Wayback Machine. Managenergy.net. Retrieved on 2011-06-11.
- Diesendorf, Mark (2007). Greenhouse Solutions with Sustainable Energy, UNSW Press, p. 121.
- Danish Wind Resource Map (1999). Available online at www.emd.dk/windres Archived 2011-07-19 at the Wayback Machine. Emd.dk. Retrieved on 2011-06-11.
- Gellert, Bjarne Christian. Electricity interconnections Archived 2013-02-09 at the Wayback Machine Energinet.dk, 22 August 2011. Retrieved: 6 December 2011.
- "Achieving the 10% electricity interconnection target Archived 2015-12-25 at the Wayback Machine" page 2-5. European Commission, 25 February 2015. Note: Slovakia has 61% and Hungary has 29%
- Diesendorf, Mark (2007). Greenhouse solutions with sustainable energy, UNSW Press, pp. 121–22.
- Lund 2010, p. 21 "Denmark has a strategy to raise this share to 50 percent and the necessary measures are in the process of being implemented".
- Lindboe, page 6
- Lindboe, page 14
- Lindboe, page 29
- Wittrup, Sanne. "Dong: Vores kraftværker bruger allerede billig vindmøllestrøm i elpatroner" Ingeniøren, 15 January 2015. Retrieved: January 2015.
- Blarke, Morten Boje. "Liste over el-drevne varmepumper i fjernvarmen Archived 2016-01-19 at the Wayback Machine" SmartVarme.dk, 12 February 2014. Retrieved: January 2015.
- Capion, Karsten. "Analyse nr. 9 - Mulighederne for den fremtidige fjernvarmeproduktion i decentrale områder Archived 2015-12-08 at the Wayback Machine" Danish Energy, 15 January 2014. Retrieved: 15 January 2015.
- "Dansk Energi - Stor interesse for reduceret pulje til grøn fjernvarme". Archived from the original on 2016-01-31. Retrieved 2015-10-29.
- Lindboe, page 7
- Blarke, Morten Boje. "Store eldrevne varmepumper" Aalborg University, 17 April 2013. Retrieved: January 2015.
- Wittrup, Sanne. "Varmepumper kunne have øget værdien af vindstrøm med 1,75 mia. på fem måneder" Ingeniøren, 8 June 2015. Retrieved: 29 October 2015.
- Sanne Wittrup (25 March 2016). "Sløvt varmepumpemarked truer elektrificering af varmeforsyningen". Ingeniøren. Retrieved 26 March 2016.
- "Energinet.dk / Previous environmental reports". Archived from the original on 2016-06-29. Retrieved 2016-11-13.
- "Denmark breaks its own world record in wind energy". EurActiv - EU News & policy debates, across languages.
- "Global Market Outlook for Photovoltaics 2014-2018" (PDF). www.epia.org. EPIA - European Photovoltaic Industry Association. p. 34. Archived from the original (PDF) on 12 June 2014. Retrieved 12 June 2014.
- http://ing.dk/artikel/kaempe-solcelleparker-slar-bunden-ud-af-energiforlig-181991
- "Danish Annual Energy Statistics 2008" (PDF). Retrieved 2010-07-31.
- Matthew McDermott. "Denmark Inaugurates World's Largest Offshore Wind Farm – 209 MW" Treehugger.
- "Horns Rev 3" (in Danish). Vattenfall. Retrieved 25 August 2019.
- Lund 2010, p. 6 "The cost of wind power is paid solely by the electricity consumers and the net influence on consumer prices was as low as 1–3 percent on average in the period 2004–2008. In 2008, the net influence even decreased the average consumer price, although only slightly."
- Spliid, Iben. Stamdataregister for vindmøller HTML-spreadsheet, column E Archived 2012-06-10 at the Wayback Machine Danish Energy Agency November 2014. Accessed: 6 January 2014.
- Månedlig elforsyningsstatistik, HTML-spreadsheet Archived 2012-03-03 at the Wayback Machine summary tab B58-B72 Danish Energy Agency 18 January 2012. Accessed: 11 March 2012.
- {{webarchive|url=https://library.wwindea.org/ |date=2020. Accessed: 13 June 2020.
- https://www.bp.com/content/dam/bp/en/corporate/pdf/energy-economics/statistical-review/bp-stats-review-2018-renewable-energy.pdf
- https://www.bp.com/en/global/corporate/energy-economics/statistical-review-of-world-energy/renewable-energy/wind-energy.html
- https://www.rte.ie/news/newslens/2018/0111/932573-denmark-wind-farm/
- Steel, William (9 November 2016). "Vattenfall wins Kriegers Flak with record €49.90/MWh". Recharge. Archived from the original on 10 November 2016. Retrieved 10 November 2016.
- "Nearshore wind farms". Energinet.dk. 24 November 2014. Retrieved 14 September 2016.
- "Nearshore Wind Tender". Energistyrelsen. Retrieved 14 September 2016.
- "Kriegers Flak". Energistyrelsen. Retrieved 14 September 2016.
- Prices adjusted for inflation, page 14
- Arthur Neslen. "Wind power generates 140% of Denmark's electricity demand". the Guardian.
- "Så er energiforliget på plads" (in Danish). Ingeniøren. 2012-03-22. Retrieved 2014-04-17.
- Therese Kofoed Jensen, Adviser, Danish Energy Agency (2014-03-14). "Offshore investments in Denmark" (PDF). Danish Energy Agency. Archived from the original (PDF) on 2014-04-18. Retrieved 2014-04-17.CS1 maint: multiple names: authors list (link)
- Wittrup, Sanne. "Svenske Vattenfall skal bygge Danmarks næste havmøllepark Archived 2015-02-26 at the Wayback Machine" Ingeniøren, 26 February 2015. Accessed: 26 February 2015.
- "Verdens første offshore elnet bliver en realitet i Østersøen". Ingeniøren.
- "Energinet.dk køber komponenter til Kriegers Flak Havmøllepark". Energinet.dk. Archived from the original on 2016-01-30. Retrieved 2016-01-20.
- "Core component ordered for new German-Danish interconnector". Energinet.dk. Archived from the original on 2016-03-11. Retrieved 2016-03-10.
- "Horns Rev 3 havmøller" (in Danish). Energinet.dk. 2014-04-07. Archived from the original on 2014-04-18. Retrieved 2014-04-17.
- "Kriegers Flak havmøller" (in Danish). Energinet.dk. 2013-11-26. Archived from the original on 2014-04-18. Retrieved 2014-04-17.
- Wittrup, Sanne. "Otte selskaber vil bygge mega-havmøllepark i Østersøen " Ingeniøren, 1 October 2015. Accessed: 2 October 2015.
- Wittrup, Sanne. "Danmark tiltrækker masser af nye konsortier til kæmpe havmøllepark " Ingeniøren, 28 October 2015. Accessed: 28 October 2015.
- Wittrup, Sanne. "Horns Rev 3 er en godbid" Ingeniøren, 16 February 2015. Accessed: 12 March 2015.
- Wittrup, Sanne. "Discount-udbud af 350 MW havmøller skudt i gang " Ingeniøren, 20 February 2015. Accessed: 22 February 2015.
- "New nearshore wind tenders" (PDF). Archived from the original (PDF) on 2015-02-22. Retrieved 2015-02-22.
- "Archived copy". Archived from the original on 2016-01-22. Retrieved 2016-01-24.CS1 maint: archived copy as title (link)
- "Rekordlav pris: Vattenfall vinder kystmølleudbud med 47,5 øre pr. kWh". Ingeniøren. Retrieved 12 September 2016.
- "ANALYSE: 350 MW kystmøller klemt i højpolitisk spil". Ingeniøren. Retrieved 12 September 2016.
- "Markant udbygning af vindenergi" (PDF) (in Danish). Klima-, Energi- og Bygningsministeriet. 2012-03-27. Archived from the original (PDF) on 2014-04-21. Retrieved 2014-04-20.
- Hannele Holttinen, Simo Rissanen, Xiaoli Larsen, Anne Line Løvholm. "Wind and load variability in the Nordic countries" pages 20, 25, 53. VTT Technical Research Centre of Finland, 2013. Quote: "correlation between Finland and Denmark, and Norway and Denmark is almost non-existent"
"Wind power production is higher during autumn and winter in all countries and the Nordic region."
"in Denmark where the production is at the highest level in the afternoons from 1 to 5 pm" - "Nord Pool Spot implements negative price floor in Elspot from October 2009" (Press release). Nord Pool Spot. 4 February 2009. Archived from the original on 2010-08-15. Retrieved 2010-04-14.
- "Elkunder betalte 37,7 millioner kr. til overflødig grøn strøm i 2014". Ingeniøren.
- Tyske elpriser smitter af i Vestdanmark Archived 2016-03-08 at the Wayback Machine Energinet.dk, 19. november 2010
- Import og eksport Archived 2016-03-08 at the Wayback Machine Energinet.dk, 30. april 2015
-
"Analysis of Wind Power in the Danish Electricity Supply in 2005 and 2006" (PDF). Techconsult. 2007-10-08. Retrieved 2009-04-04.
It is often said that wind power covers ca. 20% of Danish electricity consumption. It is more correct to say that the production of power by Danish wind turbines corresponds to about 20% of electricity demand. But a considerable part of the wind energy produced is exported to neighbouring countries and thus does not cover any part of Danish electricity consumption. (...) For the whole country the degree of cover in 2005 was 13.6% (not 18.7% as stated by the Wind Turbine Industry), and in 2006 it was 10.3%, not 17%.
Translation of "Analyse af Vindkraft i Dansk Elforsyning 2005 og 2006", Summary. - Sharman, Hugh (May 2005). "Why Wind Power Works in Denmark" (PDF). Proceedings of ICE, Civil Engineering. Thomas Telford, Ltd.: 66–72. Retrieved 2009-04-04.
- Lund 2010, pp. 20–21 "the wind export in 2008 was only 61 GWh, equal to approx. 1 percent of the wind power production"
- TSO Congestion rent Archived 2010-11-21 at the Wayback Machine Nord Pool Spot. Retrieved: 24 September 2010.
- Danske forbrugere tjener styrtende på vindstrøm Politiken, 16 September 2015.
- "Denmark sells power at a higher price than we buy" VidenOmVind, 25 May 2012. Accessed: 5 September 2013.
- The world's leader in Wind Power, Scandinavica.com, published 2004, accessed 2007-06-22. Archived 2018-01-25 at the Wayback Machine
- KASPER BRØNDGAARD ANDERSEN (20 September 2015). "Indtjeningsfest i vindmølleindustrien".
- Analyse af leverandører til vindindustrien. Markedsudvikling 2013 Archived 2016-03-04 at the Wayback Machine, page 5. Deloitte
- "Vindmøllebranchen tilbage på sporet efter krisen". Ingeniøren.
- "Wind energy: A visionary match". Risø National Laboratory. Archived from the original on 2007-10-12. Retrieved 2010-07-31.
- Boyle, 2004, p. 414.
- Korsgaard Nielsen, Michael. "Vestjyder får havvindmøllepark til 300 mio. kroner" Berlingske, 10 February 2016
- http://www.4coffshore.com/windfarms/nissum-bredning-denmark-dk44.html
- http://www.4coffshore.com/windfarms/danish-pilot-to-cut-operating-costs-nid3286.html
- Afgiftsstruktur gør el langt dyrere end olie CSR.dk, 29 February 2016
- Forbedring af den nationale elprisstatistik for erhverv page 7. Danish Energy Agency
- Electricity price statistics EuroStat, November 2019
- Electricity prices (table) Eurostat, October 2015
- Electricity and natural gas price statistics EuroStat, May 2015.
- "Derfor er omlægning af energiafgifter en svær øvelse". Ingeniøren. Retrieved 17 April 2016.
The main part of tolls are not based on environment concerns
- "Fremskrivning af PSO-udgifter" page 6+17. Danish Energy Agency, 19 May 2014. Retrieved: 17 January 2015.
- Energy statistics, 2014 Archived 2016-01-21 at the Wayback Machine page 12
- Mauritzen, Johannes. "Windonomics : empirical essays on the economics of wind power in the Nordic electricity market" page 32. Thesis from Norwegian School of Economics, 2012. Handle page. Quote: "wind power has the effect of lowering intraday variability for both the entire Nordic system price as well as in the two Danish price areas"
- Sharman, Hugh; Meyer, Henrik. "Wind Energy: The Case of Denmark" (PDF). Archived from the original (PDF) on 2010-05-21. Retrieved 2010-08-17.
- Ritzau (2010-03-18). "Kul- og olielobby betalte Cepos-rapport". jv.dk. Retrieved 2020-01-15.
- Andersen, Kasper Brøndgaard. "Omstridt CEPOS-rapport var betalt af kul- og olielobby Disputed CEPOS report was paid for by coal and oil lobby Ingeniøren, 18 March 2010. Retrieved: January 2015.
- Lund 2010 "the results of the CEPOS study are in general not correct"
- "Archived copy" (PDF). Archived from the original (PDF) on 2015-11-23. Retrieved 2016-09-13.CS1 maint: archived copy as title (link)
- Andersen, Kasper Brøndgaard. "Lykke Friis: CEPOS-rapport giver »fortegnet« billede af vindkraft Archived 2011-02-11 at the Wayback Machine Ingeniøren, 19 March 2010. Retrieved: January 2015.
- "Nuclear Energy in Denmark". World Nuclear Association. Archived from the original on 2016-03-05. Retrieved 2016-03-07.
the CEPOS report was funded by American Institute of Energy Research .. and seems to be aimed at addressing the analogy made by President Barack Obama in his 22 April 2009 Earth Day speech, where he cited the example of Denmark and claimed that, by 2030, the USA could generate 20% of its electricity from wind
- Obama, Barack. "Remarks by the President in Newton, IA Archived 2016-03-03 at the Wayback Machine" White House Office of the Press Secretary, 22 April 2009. Quote: "Even as we're conserving energy, we need to change the way we produce energy. Today, America produces less than 3 percent of our electricity through renewable sources like wind and solar -- less than 3 percent. Now, in comparison, Denmark produces almost 20 percent of their electricity through wind power."
- Paul Gipe (1996). "Community-Owned Wind Development in Germany, Denmark, and the Netherlands". Wind Works. Retrieved 2007-06-21.
- Hans Christian Sørensen; Lars Kjeld Hansen; Jens H. Mølgaard Larsen (2002). "Middelgrunden 40 MW offshore wind farm Denmark: Lessons Learned" (PDF). SPOK Consult. Archived from the original (PDF) on 2006-08-20. Retrieved 2007-06-21.
- Jens H. Larsen, Copenhagen Environment and Energy Office (2001). "The world's largest off-shore windfarm, Middelgrunden 40 MW". Middelgrunden Wind Turbine Co-operative. Archived from the original on 2007-08-17. Retrieved 2007-06-21.
- Kolbert, Elizabeth. (2009-01-07) A Reporter at Large: The Island in the Wind. The New Yorker. Retrieved on 2011-06-11.
- Denmark's carbon-neutral island, Deutsche Welle, 27 September 2011
Sources
- Lund, Henrik; et al. (2010-02-19). Danish Wind Power Export and Cost (PDF). CEESA (Coherent Energy and Environmental System Analysis) Research Project. Department of Development and Planning, Aalborg University. ISBN 978-87-91830-40-2. Retrieved 2 November 2011.CS1 maint: ref=harv (link)
- Lindboe, Hans Henrik&, János Hethey. "Vindintegration i Danmark" Ea Energianalyse, November 2014. Retrieved: January 2015. Source
Bibliography
- Petersen, Flemming (2018). Da Danmark fik vinger: vindmøllehistorien 1978-2018 ISBN 8789270053, ISBN 9788789270050
- Boyle, Godfrey (2004). Renewable energy: Power for a sustainable future, Oxford University Press, ISBN 0-19-926178-4
- Caldicott, Helen (2006). Nuclear power is not the answer to global warming or anything else, Melbourne University Press, ISBN 0-522-85251-3
External links
| Wikimedia Commons has media related to Wind power in Denmark. |
- Danish Wind Industry Association
- NREL Signs MOU With Riso National Laboratory
- Danish Wind Energy development 1975–1995 by Blade Pioneer Erik Grove-Nielsen
- Sharman, Hugh (September 2009). "Wind Energy — The Case of Denmark" (PDF). Center for Politiske Studier (CEPOS). Archived from the original (PDF) on 2010-05-21. Retrieved 2010-04-14.
| Africa |
| ||||
|---|---|---|---|---|---|
| Asia | |||||
| Europe |
| ||||
| North America | |||||
| Oceania | |||||
| South America | |||||
| |||||