Wind power by country
The worldwide total cumulative installed electricity generation capacity from wind power has increased rapidly since the start of the third millennium, and as of the end of 2019, it amounts to 651 GW. Since 2010 more than half of all new wind power was added outside the traditional markets of Europe and North America, mainly driven by the continuing boom in China and India. At the end of 2015, China had 145 GW of wind power installed.[2] In 2015, China installed close to half the world's added wind power capacity. However, as of 2019, wind provided only 5% of China's power.[3]
Wind power is used on a commercial basis in more than half of all the countries of the world.[4] By 2018, several countries have achieved high levels of wind power penetration, such as 41% of stationary electricity production in Denmark, 28% in Ireland, 24% in Portugal, 21% in Germany and 19% in Spain.[5] In November 2018 wind power generation in Scotland was higher than the country's electricity consumption during the month.[6] Wind power's share of worldwide electricity usage at the end of 2018 was 4.8%,[7] up from 3.1% four years earlier.[8] In Europe, its share of power generation capacity was 18.8% in 2018.[4]
Global deployment figures
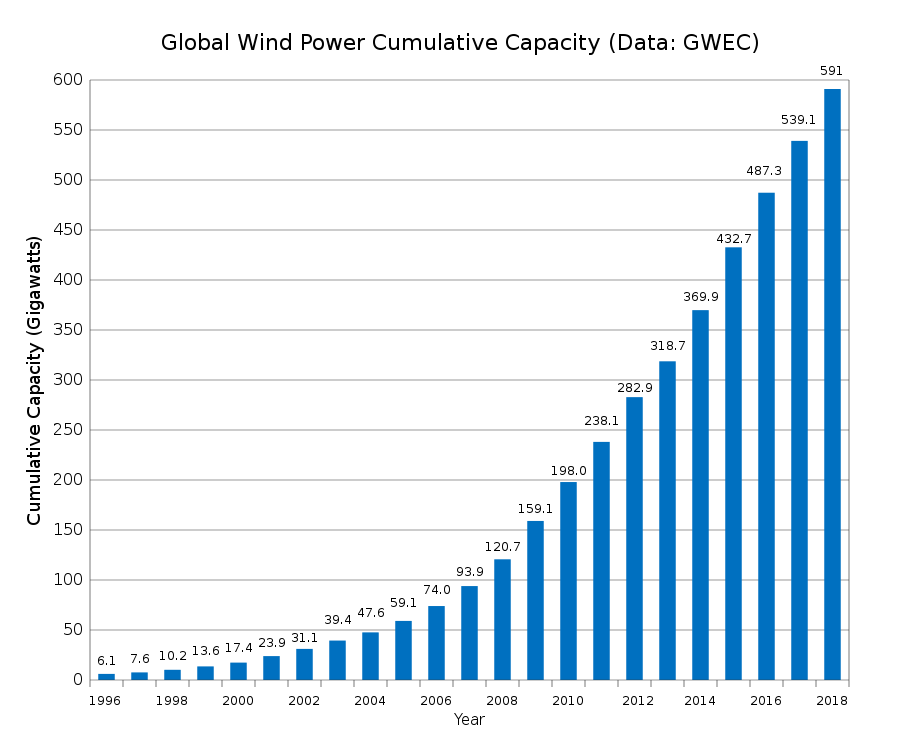
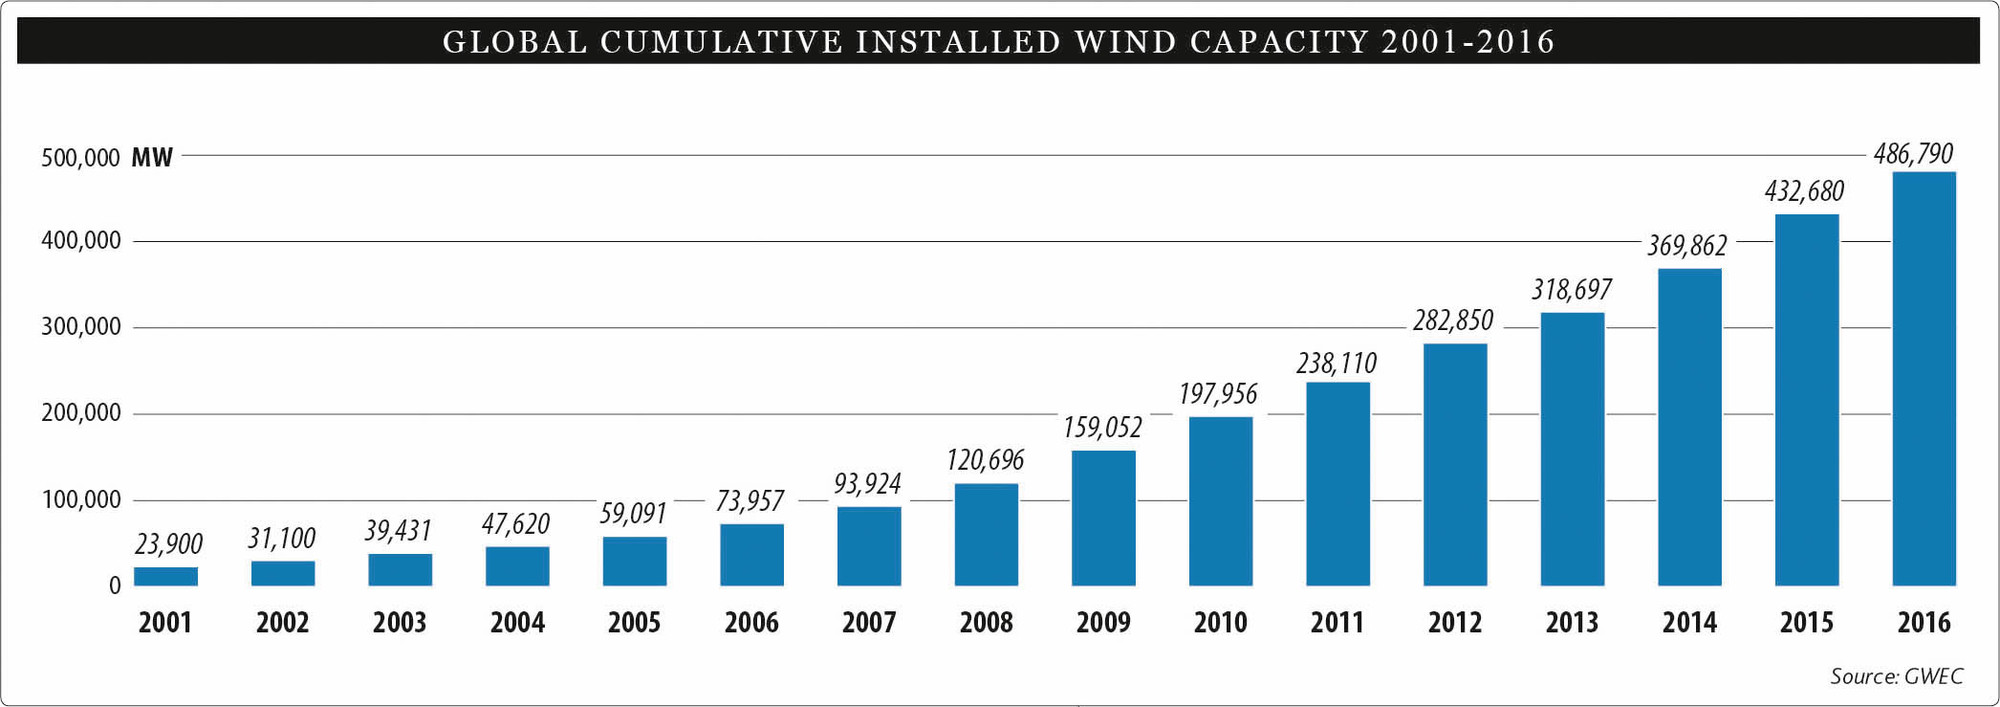
This section provides end-of-year figures of worldwide installed wind power capacity by country, including both onshore and offshore. The data is sourced from Global Wind Energy Council.[9] In 2018, global wind power capacity increased by 51 GW to 591 GW, an increase of 9.6% compared to the end of 2017.[10]
|
Top 10 countries by cumulative wind capacity in 2019[13]
|
Number of countries with wind capacities in the gigawatt-scale
10
20
30
40
2005
2010
2015
2019
Growing number of wind gigawatt-markets
Countries above the 1-GW mark
Countries above the 10-GW mark
Countries above the 100-GW mark
|

| # | Country or territory | 2006 | 2007 | 2008[22] | 2009[23] | 2010[24] | 2011[25] | 2012[26] | 2013[27] | 2014[28] | 2015[2] | 2016[29] | 2017[30] | 2018[31] | 2019[32] |
|---|---|---|---|---|---|---|---|---|---|---|---|---|---|---|---|
| 1 | 2,599 | 5,912 | 12,210 | 25,104 | 44,733 | 62,733 | 75,564 | 91,412 | 114,763 | 145,104 | 168,690 | 188,232 | 211,392 | 236,402 | |
| – | 48,122 | 56,614 | 65,255 | 74,919 | 84,278 | 93,957 | 106,454 | 117,384 | 128,752 | 141,579 | 153,730 | 169,319 | 178,826 | 192,020 | |
| 2 | 11,603 | 16,819 | 25,170 | 35,159 | 40,200 | 46,919 | 60,007 | 61,110 | 65,879 | 74,472 | 82,183 | 89,077 | 96,665 | 105,466 | |
| 3 | 20,622 | 22,247 | 23,903 | 25,777 | 27,214 | 29,060 | 31,332 | 34,250 | 39,165 | 44,947 | 50,019 | 56,132 | 59,311 | 61,357 | |
| 4 | 6,270 | 7,850 | 9,587 | 10,925 | 13,064 | 16,084 | 18,421 | 20,150 | 22,465 | 27,151 | 28,665 | 32,848 | 35,129 | 37,506 | |
| 5 | 11,630 | 15,145 | 16,740 | 19,149 | 20,676 | 21,674 | 22,796 | 22,959 | 22,987 | 23,025 | 23,075 | 23,170 | 23,494 | 25,808 | |
| 6 | 1,963 | 2,389 | 3,288 | 4,070 | 5,203 | 6,540 | 8,445 | 10,711 | 12,440 | 13,603 | 15,030 | 18,872 | 20,970 | 23,515 | |
| 7 | 1,589 | 2,477 | 3,426 | 4,410 | 5,660 | 6,800 | 7,196 | 8,243 | 9,285 | 10,358 | 12,065 | 13,759 | 15,309 | 16,643 | |
| 8 | 237 | 247 | 339 | 606 | 932 | 1,509 | 2,508 | 3,466 | 5,939 | 8,715 | 10,740 | 12,763 | 14,707 | 15,452 | |
| 9 | 1,460 | 1,846 | 2,369 | 3,319 | 4,008 | 5,265 | 6,200 | 7,823 | 9,694 | 11,205 | 11,898 | 12,239 | 12,816 | 13,413 | |
| 10 | 2,123 | 2,726 | 3,537 | 4,850 | 5,797 | 6,747 | 8,144 | 8,558 | 8,663 | 8,958 | 9,257 | 9,479 | 9,958 | 10,512 | |
| 11 | 571 | 831 | 1,067 | 1,560 | 2,163 | 2,970 | 3,745 | 4,382 | 5,425 | 6,025 | 6,519 | 6,691 | 7,407 | 8,804 | |
| 12 | 65 | 207 | 433 | 801 | 1,329 | 1,799 | 2,312 | 2,958 | 3,763 | 4,718 | 6,101 | 6,516 | 7,369 | 8,056 | |
| 13 | 84 | 85 | 85 | 520 | 733 | 873 | 1,370 | 1,859 | 2,551 | 3,073 | 3,527 | 4,005 | 4,935 | 6,215 | |
| 14 | 651 | 824 | 1,306 | 1,712 | 1,991 | 2,176 | 2,584 | 3,239 | 3,806 | 4,187 | 4,327 | 4,557 | 5,362 | 6,199 | |
| 15 | 3,140 | 3,129 | 3,164 | 3,465 | 3,752 | 3,871 | 4,162 | 4,807 | 4,845 | 5,063 | 5,227 | 5,476 | 5,758 | 6,128 | |
| 16 | 153 | 276 | 472 | 725 | 1,107 | 1,616 | 2,497 | 3,390 | 3,834 | 5,100 | 5,782 | 6,397 | 5,864 | 5,917 | |
| 17 | 1,716 | 2,130 | 2,862 | 3,535 | 3,702 | 4,083 | 4,525 | 4,730 | 4,914 | 5,079 | 5,316 | 5,316 | 5,380 | 5,437 | |
| 18 | 1,571 | 1,759 | 2,237 | 2,223 | 2,237 | 2,328 | 2,391 | 2,671 | 2,805 | 3,431 | 4,328 | 4,341 | 4,471 | 4,600 | |
| 19 | 746 | 805 | 1,245 | 1,260 | 1,379 | 1,614 | 1,738 | 2,049 | 2,272 | 2,486 | 2,830 | 3,127 | 3,564 | 4,155 | |
| 20 | 1,309 | 1,528 | 1,880 | 2,056 | 2,304 | 2,501 | 2,614 | 2,669 | 2,789 | 3,038 | 3,234 | 3,400 | 3,661 | 3,923 | |
| 21 | 194 | 287 | 384 | 563 | 911 | 1,078 | 1,375 | 1,651 | 1,959 | 2,229 | 2,386 | 2,843 | 3,360 | 3,879 | |
| 22 | 758 | 873 | 990 | 1,087 | 1,208 | 1,629 | 1,749 | 1,866 | 1,980 | 2,152 | 2,374 | 2,651 | 2,844 | 3,576 | |
| 23 | 965 | 982 | 995 | 995 | 1,011 | 1,084 | 1,378 | 1,684 | 2,095 | 2,412 | 2,632 | 2,828 | 3,045 | 3,159 | |
| 24 | 2 | 7 | 10 | 14.1 | 462 | 982 | 1,905 | 2,599 | 2,953 | 2,976 | 3,028 | 3,029 | 3,029 | 3,029 | |
| 25 | 325 | 333 | 428 | 431 | 441 | 512 | 704 | 811 | 819 | 838 | 838 | 1,162 | 1,675 | 2,444 | |
| 26 | 86 | 110 | 143 | 147 | 197 | 199 | 288 | 447 | 627 | 1,005 | 1,539 | 2,113 | 2,041 | 2,284 | |
| 27 | – | – | – | 20 | 168 | 172 | 205 | 331 | 836 | 933 | 1,424 | 1,540 | 1,621 | 2,150 | |
| 28 | – | – | – | – | – | – | – | 10 | 570 | 1,053 | 1,471 | 2,094 | 2,085 | 2,085 | |
| 29 | – | – | – | – | – | 43 | 56 | 59 | 701 | 845 | 1,210 | 1,505 | 1,516 | 1,647 | |
| 30 | – | – | – | – | – | 113 | 167 | 204 | 204 | 204 | 204 | 228 | 722 | 1,604 | |
| 31 | – | – | – | – | – | 7 | 112 | 223 | 223 | 223 | 430 | 648 | 778 | 1,538 | |
| 32 | 230 | 310 | 390 | 430 | 550 | 550 | 550 | 550 | 610 | 610 | 810 | 810 | 1,190 | 1,452 | |
| 33 | 176 | 192 | 278 | 348 | 379 | 407 | 483 | 561 | 609 | 852 | 1,089 | 1,136 | 1,302 | 1,420 | |
| 34 | – | – | – | – | – | – | – | – | – | 255 | 591 | 792 | 1,189 | 1,238 | |
| 35 | 64 | 125 | 125 | 253 | 286 | 291 | 291 | 487 | 787 | 787 | 787 | 787 | 1,207 | 1,207 | |
| 36 | 86 | 89 | 90 | 94 | 87 | 151 | 302 | 371 | 498 | 514 | 526 | 593 | 533 | 1,170 | |
| 37 | 188 | 280 | 358 | 436 | 519 | 564 | 564 | – | – | 647 | 682 | 692 | 702 | 712 | |
| 38 | 36 | 70 | 120 | 177 | 500 | 612 | 674 | 681 | 691 | 691 | 691 | 691 | 691 | 691 | |
| 39 | 171 | 322 | 325 | 497 | 530 | 623 | 623 | 623 | 623 | 623 | 623 | 623 | 689 | 690 | |
| 40 | n/a | n/a | 69.4 | 104 | 152 | 187.4 | 207.1 | 302 | 347 | 387 | 422 | 613 | 613 | 652 | |
| 41 | – | – | – | – | – | 62 | 102 | 146 | 186 | 186 | 186 | 562 | 635 | ||
| 42 | 56 | 50 | 54 | 91 | 163 | 203 | 263 | 279 | 279 | 315 | 493 | 493 | 439 | 548 | |
| 43 | – | – | 74 | 123 | 119 | 132 | 147 | 148 | 198 | 268 | 319 | 378 | 408 | 459 | |
| 44 | – | – | – | – | – | 54 | 104 | 245 | 245 | 245 | 358 | 248 | 449 | ||
| 45 | – | – | – | – | – | 23 | 81 | 171 | 171 | 324 | 324 | 324 | 324 | 444 | |
| 46 | – | – | – | – | – | – | – | 66 | 216 | 216 | 427 | 427 | 427 | 427 | |
| 47 | – | – | – | – | – | – | – | – | – | 135 | 151 | 197 | 228 | 388 | |
| 48 | – | – | – | – | – | – | – | 146 | 148 | 148 | 243 | 243 | 375 | 375 | |
| 49 | – | – | – | – | – | – | – | – | – | 85 | 135 | 135 | 193 | 375 | |
| 50 | – | – | – | – | – | – | – | – | – | 10 | 10 | 18 | 374 | 374 | |
| 51 | – | – | – | – | – | – | – | 63 | 63 | 272 | 343 | 345 | 367 | ||
| 52 | – | – | – | – | – | – | – | – | – | 26 | 26 | 26 | 338 | 338 | |
| 53 | 57 | 116 | 150 | 192 | 215 | 217 | 260 | 269 | 281 | 281 | 281 | 308 | 317 | 337 | |
| 54 | 61 | 65 | 127 | 201 | 295 | 329 | 329 | 329 | 329 | 329 | 329 | 329 | 329 | 329 | |
| 55 | 31.8 | 59 | 78 | 142 | 149 | 184 | 269 | 280 | 302 | 303 | 310 | 310 | 310 | 320 | |
| 56 | 47 | 67 | 82 | 91 | 91 | 91 | 91 | 91 | n.a. | 129 | 134 | 191 | 282 | ||
| 57 | – | – | – | – | – | – | 102 | 102 | 126 | 176 | 180 | 225 | 274 | 274 | |
| 58 | – | – | – | – | – | – | – | – | 35 | 270 | 270 | 270 | 270 | 270 | |
| 59 | – | – | – | – | – | – | – | – | – | 17 | 17 | 17 | 141 | 191 | |
| 60 | – | – | – | – | – | – | – | – | – | 119 | 119 | 119 | 120 | 190 | |
| 61 | – | – | – | – | – | – | – | – | 147 | 158 | 158 | 158 | 158 | 158 | |
| 62 | – | – | – | – | – | – | – | 50 | 50 | 50 | 50 | 100 | 149 | 149 | |
| 63 | – | – | – | – | – | – | – | – | 58 | 58 | 100 | 120 | 120 | 136 | |
| – | Caribbean | – | – | – | – | – | – | 191 | 250 | 250 | 250 | 200 | 218 | n.a. | |
| – | Pacific Islands | – | – | – | – | – | 12 | 12 | 12 | 12 | 12 | 13 | 13 | n.a. | |
| – | Rest of Europe | – | – | – | – | – | – | 3,815 | 4,956 | 5,715 | 6,543 | ||||
| – | Rest of Latin America & Caribbean | – | – | – | – | – | 54 | 54 | 250 | 250 | 285 | ||||
| – | Rest of Africa & Middle East | – | – | – | – | – | – | 1,165 | 1,255 | 129 | 151 | 159 | 159 | ||
| – | Rest of Asia | – | – | – | – | – | – | 71 | 87 | – | 167 | 70 | 70 | n.a. | |
| World total capacity (MW) | 74,151 | 93,927 | 121,188 | 157,899 | 197,637 | 238,035 | 282,482 | 318,596 | 369,553 | 432,419 | 487,657 | 539,581 | 591,549 | 650,758 | |
Historical wind power capacity
| Rank | Country | 2004 | 2005[22] | 2006[22] | 2007[22] | 2008[22] | 2009[17] | 2010[16] | 2011[41] | 2012[42] | 2013[43] |
|---|---|---|---|---|---|---|---|---|---|---|---|
| 1 | 764 | 1,266 | 2,599 | 5,912 | 12,210 | 25,777 | 44,733 | 62,364 | 75,324 | 91,324 | |
| 2 | 6,725 | 9,149 | 11,603 | 16,818 | 25,170 | 35,159 | 40,180 | 46,919 | 59,882 | 61,108 | |
| 3 | 16,628 | 18,427 | 20,622 | 22,247 | 23,902 | 25,777 | 27,215 | 29,075 | 31,038 | 34,660 | |
| 4 | 8,263 | 10,027 | 11,630 | 15,145 | 16,740 | 19,149 | 20,676 | 21,673 | 22,796 | 22,959 | |
| 5 | 3,000 | 4,430 | 6,270 | 7,850 | 9,587 | 10,925 | 13,065 | 15,880 | 18,321 | 20,150 | |
| 6 | 888 | 1,353 | 1,962 | 2,389 | 3,287 | 4,092 | 5,204 | 6,018 | 8,445 | 10,531 | |
| 7 | 1,265 | 1,718 | 2,123 | 2,726 | 3,736 | 4,850 | 5,797 | 6,737 | 8,144 | 8,551 | |
| 8 | 386 | 757 | 1,567 | 2,455 | 3,404 | 4,521 | 5,660 | 6,640 | 7,473 | 8,254 | |
| 9 | 444 | 683 | 1,460 | 1,846 | 2,369 | 3,319 | 4,008 | 5,265 | 6,201 | 7,698 | |
| 10 | 3,124 | 3,128 | 3,136 | 3,125 | 3,160.0 | 3,497 | 3,734 | 3,927 | 4,162 | 4,772 | |
| 11 | 522 | 1,022 | 1,716 | 2,130 | 2,862 | 3,535 | 3,702 | 4,083 | 4,525 | 4,724 | |
| 12 | 452 | 509.1 | 571.2 | 831.0 | 1066 | 1,579 | 2,052 | 2,798 | 3,745 | 4,470 | |
| 13 | 23.8 | 28.6 | 236.9 | 247.1 | 338.5 | 606 | 920 | 1,429 | 2,507 | 3,399 | |
| 14 | 58.2 | 73 | 153 | 276 | 544 | 725 | 1,107 | 1,616.4 | 2,497 | 3,390 | |
| 15 | 379 | 579 | 817.3 | 817.3 | 1,494.0 | 1,877 | 1,880 | 2,005 | 2,584 | 3,049 | |
| 16 | 20.6 | 20.1 | 64.6 | 206.8 | 333.4 | 796.5 | 1,274 | 1,799 | 2,312 | 2,959 | |
| 17 | 1,078 | 1,224 | 1,559 | 1,747 | 2,225.0 | 2,229 | 2,237 | 2,328 | 2,391 | 2,693 | |
| 18 | 896.2 | 1,040 | 1,309 | 1,528 | 1,880.0 | 2,056 | 2,304 | 2,501 | 2,614 | 2,661 | |
| 19 | 0 | 0.9 | 2.8 | 7.8 | 7.0 | 14.0 | 591 | 826 | 1,905 | 2,599 | |
| 20 | 338.9 | 495.2 | 746 | 805 | 1,244.7 | 1,260 | 1,428 | 1,614 | 1,738 | 2,037 | |
| 21 | 2.2 | 2.2 | 84 | 85.0 | 85.0 | 402 | 521 | 929 | 1,348 | 1,992 | |
| 22 | 473 | 573.3 | 757.6 | 873.3 | 989.7 | 1,109 | 1,208 | 1,626.5 | 1,749 | 1,865 | |
| 23 | 606 | 819 | 964.5 | 981.5 | 994.9 | 995 | 1,011 | 1,084 | 1,378 | 1,684 | |
| 24 | 95 | 167.4 | 194.3 | 286.9 | 383.6 | 555 | 886 | 1,078 | 1,375 | 1,651 | |
| 25 | 270 | 268 | 325 | 333.0 | 428.0 | 431 | 434 | 520.0 | 703.0 | 768 | |
| 26 | 10 | 14 | 36 | 57 | 120 | 177 | 375 | 503.0 | 684.0 | 681 | |
| 27 | 168.1 | 168.2 | 171 | 321.8 | 325.3 | 497 | 506 | 622.8 | 622.8 | 623 | |
| 28 | 13 | 103.7 | 187.7 | 279.9 | 358.2 | 436 | 519 | 563.8 | 563.8 | 614 | |
| 29 | 22.5 | 119.1 | 176.3 | 192.1 | 278.0 | 364.4 | 379 | 406.3 | 482.6 | 561 | |
| 30 | 145 | 145 | 230 | 310 | 390.0 | 430 | 550 | 550.0 | 550.0 | 550 | |
| 31 | 53.9 | 64 | 64 | 125.2 | 125.2 | 253 | 286 | 291.0 | 291.0 | 494.8 | |
| 32 | 82 | 82 | 86 | 110 | 140.0 | 147 | 197 | 197.0 | 288.0 | 448.0 | |
| 33 | 68.8 | 77.3 | 85.6 | 89.0 | 90.0 | 90 | 87.4 | 151.1 | 276.0 | 371.0 | |
| 34 | 2 | 2 | 2 | 20.1 | 20.1 | 78 | 170 | 190.0 | 190.0 | 335.0 | |
| 35 | 3.5 | 17.5 | 60.9 | 65.0 | 127.0 | 201 | 295 | 329.4 | 329.4 | 329.4 | |
| 36 | 6 | 6 | 17.2 | 17.2 | 18.2 | 27.8 | 69.8 | 131.0 | 180.0 | 302.0 | |
| 37 | 22.1 | 33 | 33 | 58.6 | 78.3 | 142.3 | 149 | 184.0 | 269.0 | 280.0 | |
| 38 | 7 | 7 | 55.0 | 52.3 | 54.4 | 91 | 154 | 179.0 | 225.0 | 279.0 | |
| 39 | 16.5 | 29.5 | 56.5 | 116 | 150.0 | 191 | 215 | 217.0 | 260.0 | 269.0 | |
| 40 | 25.6 | 26.8 | 27.8 | 29.8 | 29.8 | 29.8 | 54.0 | 129.2 | 233.2 | 217.1 | |
| 41 | 193.0 | ||||||||||
| 42 | 30.0 | 30.0 | 51.0 | 171.0 | |||||||
| 43 | 69.9 | 71 | 74 | 74 | 74.0 | 123 | 123 | 148.2 | 148.2 | 148.2 | |
| 44 | 0 | 0 | 0 | 0 | 0 | 0 | 82.0 | 134.0 | 147.0 | 147.0 | |
| 45 | 0 | 0 | 0 | 0 | 0 | 40 | 40.0 | 63.0 | 102.0 | 141.6 | |
| 46 | Puerto Rico | 0 | 125.0 | 125.0 | |||||||
| 47 | 0 | 0 | 0 | 0 | 6.0 | 6.0 | 6.0 | 6.0 | 106.0 | 106.0 | |
| 48 | 20 | 20 | 20 | 20 | 20.0 | 20.0 | 54.0 | 54.0 | 104.0 | 104.0 | |
| 49 | 16.55 | 16.6 | 16.6 | 16.6 | 21.8 | 21.8 | 10.0 | 10.1 | 10.1 | 102.0 | |
| 50 | 0.0 | 70.0 | 70.0 | 102.0 | |||||||
| 51 | 25 | 31.6 | 47.4 | 66.5 | 82.0 | 82 | 100 | 100.0 | 100.0 | 100.0 | |
| 52 | 26.7 | 22.9 | 26.9 | 26.9 | 26.9 | 28.5 | 31.0 | 31.0 | 68.0 | 68.0 | |
| 53 | 8.7 | 11.6 | 11.6 | 11.6 | 13.8 | 17.6 | 42.0 | 45.5 | 50.0 | 60.0 | |
| 54 | 0.15 | 0.2 | 0.2 | 0.6 | 20.5 | 20.5 | 30.5 | 40.5 | 52.0 | 59.3 | |
| 55 | 35.3 | 35.3 | 35.3 | 35.3 | 35.3 | 35.3 | 42.0 | 44.0 | 45.0 | 58.0 | |
| 56 | 0 | 0 | 0 | 0 | 2.4 | 2.4 | 1.3 | 1.3 | 1.3 | 50.9 | |
| 57 | 20.7 | 20.7 | 20.7 | 20.7 | 20.7 | 29.7 | 29.7 | 47.7 | 47.7 | 47.7 | |
| 58 | 0.0 | 38.2 | 38.2 | 38.2 | |||||||
| 59 | 0 | 0.2 | 0.2 | 0.2 | 33.6 | 33.6 | 33.6 | ||||
| 60 | 25.2 | 25.2 | 25.2 | 25.2 | 25.2 | 33.0 | 33 | 33.0 | 33.0 | 33.0 | |
| 61 | 0 | 0 | 0 | 0 | 1.3 | 8.8 | 30.5 | 31.0 | 31.0 | 31.0 | |
| 62-63 | 0.0 | 30.0 | 30.0 | ||||||||
| 62-63 | 0.0 | 30.0 | 30.0 | 30.0 | |||||||
| 64 | 20.5 | 20.5 | 20.5 | 20.5 | 20.5 | 20.5 | 20.5 | 26.8 | 26.8 | 26.8 | |
| 65 | 2.78 | 2.8 | 2.8 | 2.8 | 2.8 | 2.8 | 25.5 | 38.3 | 24.0 | 25.5 | |
| 66 | 23.4 | ||||||||||
| 67 | 19.5 | 19.5 | 19.5 | 19.5 | 19.5 | 20.0 | 20.0 | 19.5 | 19.5 | 19.5 | |
| 68 | 0 | 0 | 0 | 3.1 | 4.0 | 2.5 | 2.5 | 2.5 | 19.0 | 19.0 | |
| 69 | 10.8 | 14 | 15.5 | 16.5 | 16.5 | 16.5 | 15.4 | 15.4 | 16.8 | 16.8 | |
| 70 | 10.2 | 13.5 | 13.5 | 13.5 | 13.5 | 13.5 | 13.5 | 13.5 | 13.5 | 13.5 | |
| 71 | 0.0 | 12.0 | 12.0 | 12.0 | |||||||
| 72 | 0.45 | 0.5 | 0.5 | 2.1 | 7.2 | 7.2 | 11.7 | 11.7 | 11.7 | 11.7 | |
| 73 | 0.0 | 10.8 | 10.8 | 10.8 | |||||||
| 74 | 0 | 0.1 | 10.1 | ||||||||
| 75 | 0.0 | 10.0 | 10.0 | 10.0 | |||||||
| 76 | 0.2 | 7.2 | 7.2 | 7.2 | |||||||
| 77 | 7 | 7.0 | 7.0 | 6.0 | 6.0 | 6.0 | 6.0 | 6.0 | 6.0 | 6.0 | |
| 78 | 0.15 | 4.1 | 4.1 | 4.1 | 4.1 | 4.1 | 4.0 | 4.0 | 4.0 | 4.0 | |
| 79-80 | 5 | 5 | 5 | 5 | 6.0 | 6.0 | 6.0 | 3.0 | 3.0 | 3.0 | |
| 79-80 | 0.0 | 3.0 | 3.0 | 3.0 | |||||||
| 81-82 | 2.2 | 2.2 | 2.2 | 2.2 | 2.2 | 2.2 | 2.2 | 2.2 | 2.2 | 2.2 | |
| 81-82 | 0.0 | 2.2 | 2.2 | 2.2 | |||||||
| 83-84 | 0 | 0.5 | 0.5 | 0.5 | 0.5 | 0.5 | 1.5 | 2.2 | 2.0 | 2.0 | |
| 83-84 | 0.0 | 2.2 | 2.0 | 2.0 | |||||||
| 85 | 1.1 | 1.1 | 1.1 | 1.1 | 1.1 | 1.9 | 1.9 | 3.5 | 1.9 | 1.9 | |
| 86 | 0.0 | 1.8 | 1.8 | ||||||||
| 87 | 0 | 0.6 | 1.6 | 1.6 | 1.6 | 1.6 | 1.6 | ||||
| 88 | 1.45 | 1.5 | 1.5 | 1.5 | 1.5 | 1.5 | 1.5 | 1.5 | 1.5 | 1.5 | |
| 89 | 0 | 0.8 | 0.8 | 1.0 | 1.2 | 1.4 | 1.4 | 1.4 | 1.4 | 1.4 | |
| 90 | 1.2 | 1.2 | 1.2 | 1.2 | |||||||
| 91-92 | 1.1 | 1.1 | 1.1 | 1.1 | 1.1 | 1.1 | 1.1 | 1.1 | 1.1 | ||
| 91-92 | 0.0 | 1.1 | 1.1 | 1.1 | |||||||
| 93 | 0 | 0 | 1.0 | 1.0 | 1.0 | 1.0 | 1.0 | 1.0 | 1.0 | 1.0 | |
| 0 | 0 | 17.2 | 17.2 | 18.2 | 24.3 | 24.3 | |||||
| 0.0 | 2.6 | ||||||||||
| World | 47,693 | 59,024.1 | 74,122.8 | 93,930.4 | 120,902.9 | 159,213.3 | 196,630 | 237,022 | 282,482 | 318,530 |
Electricity generation by wind 2017
| Country | Wind-power Production (TWh) |
|---|---|
| China | 305 |
| United States | 257 |
| Germany | 106 |
| United Kingdom | 50.0 |
| Spain | 49.1 |
| India | 47.7 |
| Brazil | 42.3 |
| Canada | 28.8 |
| France | 24.7 |
| Turkey | 17.9 |
References
- "GWEC, Global Wind Report Annual Market Update". Gwec.net. Retrieved 20 May 2017.
- "Global Wind Report 2015" (PDF). report. GWEC. 22 April 2016. Retrieved 23 May 2016.
- "Renewable energy". BP. Retrieved 15 January 2020.
- "Countries - Online Access - The wind power - Wind energy market intelligence". The Wind Power. Retrieved 13 January 2020.
- "Wind energy in Europe in 2018" (PDF). WindEurope.org. Retrieved 13 January 2020.
- "'Historic' month as wind power meets 109% of energy demands". STV. Retrieved 18 December 2018.
- https://www.bp.com/en/global/corporate/energy-economics/statistical-review-of-world-energy/renewable-energy.html.html#wind-energy BP Global: Wind Energy
- http://www.ren21.net/wp-content/uploads/2015/07/REN12-GSR2015_Onlinebook_low1.pdf pg31
- "Global Wind Report 2018". Global Wind Energy Council. Retrieved 20 January 2020.
- "51.3 GW of global wind capacity installed in 2018". Global Wind Energy Council. Retrieved 20 January 2020.
- "GWEC Global Wind Report 2018" (PDF). Global Wind Energy Council. April 2019. pp. 25, 28.
- "Wind energy in Europe in 2018" (PDF). WindEurope. 21 February 2019. p. 10.
- Wind Energy International. 19 March 2020 https://library.wwindea.org/global-statistics/. Retrieved 13 June 2020. Missing or empty
|title=(help) - "Wind in numbers". Retrieved 13 February 2015.
- "Brazil Wind Energy Report 2011". Report. Global Wind Energy Council. September 2011. Retrieved 20 November 2011.
- "World Wind Energy Report 2010" (PDF). Report. World Wind Energy Association. February 2011. Retrieved 13 March 2011.
- "World Wind Energy Report 2009" (PDF). Report. World Winiation. February 2010. Retrieved 13 March 2010.
- (in Hungarian) 25 MW teljesítményű szélerőműparkot helyzetek üzembe Bőnyben, 10 January 2010
- "Global installed wind power capacity 2008/2009 (MW)" (PDF) (Press release). Retrieved 29 August 2010.
- "Irish Wind Energy Association – Wind Energy in Ireland". Iwea.com. Retrieved 14 May 2011.
- http://panchabuta.com/2011/08/07/14-55-gw-of-wind-installed-in-india-627-monitoring-stations-established-to-harness-potential/
- "World Wind Energy Report 2008" (PDF). Report. World Wind Energy Association. February 2009. Retrieved 19 March 2009.
- "EWEA.org" (PDF). Retrieved 29 August 2010.
- "EWEA.org" (PDF). Retrieved 28 March 2011.
- "Wind Energy Report 2011" (PDF). Report. Global Wind Energy Council. February 2012. Retrieved 7 February 2012.
- "Wind Energy Report 2012" (PDF). Report. Global Wind Energy Council. February 2013. Retrieved 14 February 2013.
- "Wind Energy Report 2013" (PDF). Report. Global Wind Energy Council. February 2014. Retrieved 13 February 2014.
- "GWEC Global Wind Statistics 2014" (PDF). report. GWEC. 10 February 2015.
- "AWEA 2016 Fourth Quarter Market Report". AWEA. American Wind Energy Association. Retrieved 9 February 2017.
- "Global Wind Statistics 2017" (PDF).
- "Global Wind Report 2018" (PDF).
- Wind Energy International. 19 March 2020 https://library.wwindea.org/global-statistics/. Retrieved 13 June 2020. Missing or empty
|title=(help) - "Installed Capacity - Canadian Wind Energy Association". Canadian Wind Energy Association. Retrieved 31 January 2018.
- "TÜRKİYE ELEKTRİK SİSTEMİ KURULUŞ ve KAYNAKLARA GÖRE KURULU GÜÇ" (PDF). Retrieved 5 February 2018.
- "Clean Energy Report 2011". Clean Energy Council Australia. Retrieved 1 February 2012.
- "Vindkraftproduksjon 2013". Norwegian Water Resources and Energy Directorate. Retrieved 8 March 2014.
- "Vindkraft – produksjon i 2012" (PDF). Norwegian Water Resources and Energy Directorate. Retrieved 8 March 2014.
- "Vindkraft–Produksjonsstatistikk-2011" (PDF). Norwegian Water Resources and Energy Directorate. Retrieved 8 March 2014.
- "Current Status". Alternate Energy Development Board, Pakistan. Retrieved 3 April 2016.
- World Wind Energy Association (also wwindea.org or WWEA). See the periodical "Wind Energy International" or WWEA press releases for additional data.
- "World Wind Energy Report 2011". World Wind Energy Association. Missing or empty
|url=(help) - "World Wind Energy Report 2012". World Wind Energy Association. Missing or empty
|url=(help) - "World Wind Energy Report 2013". World Wind Energy Association. Missing or empty
|url=(help) - http://resourceirena.irena.org/gateway/dashboard/?topic=4&subTopic=18
| Wind power | ||
|---|---|---|
| Wind farms | ||
| Wind turbines | ||
| Wind power industry | ||
| Manufacturers |
| |
| Concepts | ||
| ||