Wardley map
A Wardley map is a map of the structure of a business or service, mapping the components needed to serve the customer or user. Wardley maps are named after Simon Wardley who says that he says that he created the technique at Fotango in 2005 having created the evolutionary framing the previous year.[1][2] The technique was further developed within Canonical UK between 2008 and 2010[3] and components of mapping can be found in the "Better For Less" paper published in 2010.[4]
Summary
Each component in a Wardley map is classified by the value it has to the customer or user and by the maturity of that component, ranging from custom-made to commodity. Components are drawn as nodes on a graph with value on the y-axis and commodity on the x-axis. A custom-made component with no direct value to the user would sit at the bottom-left of such a graph while a commodity component with high direct value to the user would sit at the top-right of such a graph. Components are connected on the graph with edges showing that they are linked.
Much of the theory of Wardley mapping is set out in a series of nineteen blog posts written by Wardley[5] and a dedicated wiki called Wardleypedia.[6] As use of the technique has broadened to new institutions and been used to map new things the application of the technique in practice has drifted from the original vision.
Example
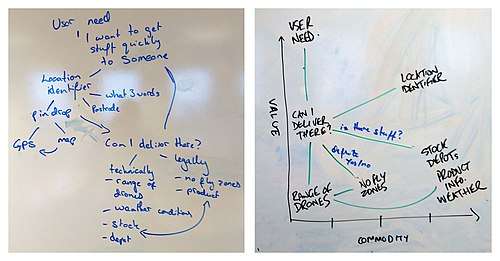
Imagine that we want to set up a new drone courier service. The user need is to receive packages quickly from our company. Our objective as a company is to meet this user need by delivering packages quickly to customers. This is a high-value, low-commodity component and is placed at the top-left of a Wardley map. If there were dozens of competing drone courier companies this component would move right on the Wardley map, indicating that the service is closer to being a commodity.
Other components are mapped similarly. For example, a drone operator needs to be aware of the weather conditions to determine the route a drone should take and the maximum weight it can carry. Weather information is of little value to the customer and can be bought from a wide range of weather data providers. It is thus placed at the bottom-right of the Wardley map.
Uses
Wardley maps are used within UK government, with particular interest within the Government Digital Service (GDS)[7] for strategic planning and identifying the best targets for government digital service modernisation.
They have been used to map the existing and planned technology infrastructure and services for High Speed 2 (HS2).[8]
They have been used to map the value chain and maturity of components in security operations to support a large scale commercial organisation decide to build or outsource their security operations centre, SOC Value Chain & Delivery Models
Tools
The Atlas2[9] tool, by Leading Edge Forum, aims to assist with the creation of Wardley maps.[10]
Criticisms
Simon Wardley claims that much of the process's value lies in "exposing assumptions. allowing challenge and creating consensus"[11] — but detractors worry that the process in fact lets people "launder assumptions into facts, delegitimise challenge (and still create consensus)".[12]
References
- Wardley, Simon (2 February 2015). "An introduction to Wardley (Value Chain) Mapping". blog.gardeviance.org. Retrieved 5 November 2018.
- Wardley, Simon (3 February 2014). "A Wardley Map". blog.gardeviance.org. Retrieved 1 November 2019.
- Wardley, Simon (24 August 2013). "Mapping and playing games". blog.gardeviance.org. Retrieved 1 November 2019.
- Maxwell, Liam (7 September 2010). "Better for Less" (PDF). The Network for the Post-Bureaucratic Age.
- Wardley, Simon (7 March 2018). "Wardleymaps". Medium. Retrieved 5 November 2018.
- "Wardleypedia". wardleypedia.org. 31 October 2017. Retrieved 5 November 2018.
- Thompson, Mark (9 October 2015). "The power of situational awareness for digital government". Computer Weekly. Retrieved 5 November 2018.
- Thompson, Mark; Fishenden, Jerry (December 2014). "Practical application of ITC framework: mapping HS2's infrastructure". Digitizing Government: Understanding and Implementing New Digital Business Models. Figure 3: Palgrave Macmillan. ISBN 9781137443625. OCLC 942512666. Retrieved 5 November 2018 – via ResearchGate.CS1 maint: location (link)
- "LeadingEdgeForum/atlas2". Leading Edge Forum. Retrieved 5 November 2018 – via GitHub.
- "atlas2". atlas2.wardleymaps.com. Leading Edge Forum. Retrieved 14 December 2018.
- Wardley, Simon [@swardley] (22 July 2017). "All maps are imperfect representations. Their value is in exposing assumptions. allowing challenge and creating consensus" (Tweet). Retrieved 5 November 2018 – via Twitter.
- Edgar, Matt (13 August 2017). "What do Wardley maps really map? A settler writes". Matt Edgar writes here. Retrieved 5 November 2018.