Transport network
A transport network, or transportation network is a realisation of a spatial network, describing a structure which permits either vehicular movement or flow of some commodity.[1] Examples include but are not limited to road networks, railways, air routes, pipelines, aqueducts, and power lines.
| Network science | ||||
|---|---|---|---|---|
| Network types | ||||
| Graphs | ||||
|
||||
| Models | ||||
|
||||
| ||||
|
||||
Methods
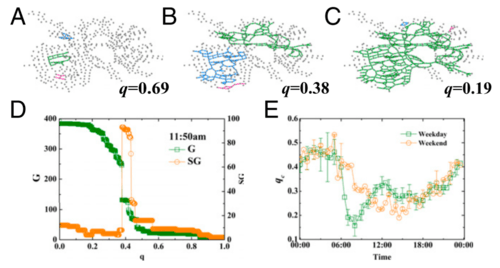
Transport network analysis is used to determine the flow of vehicles (or people) through a transport network, typically using mathematical graph theory. It may combine different modes of transport, for example, walking and car, to model multi-modal journeys. Transport network analysis falls within the field of transport engineering. Traffic has been studied extensively using statistical physics methods.[2][3][4] Recently a real transport network of Beijing was studied using a network approach and percolation theory. The research showed that one can characterize the quality of global traffic in a city at each time in the day using percolation threshold, see Fig. 1. In recent articles, percolation theory has been applied to study traffic congestion in a city. The quality of the global traffic in a city at a given time is by a single parameter, the percolation critical threshold. The critical threshold represents the velocity below which one can travel in a large fraction of city network. The method is able to identify repetitive traffic bottlenecks. [5] Critical exponents characterizing the cluster size distribution of good traffic are similar to those of percolation theory.[6]
An empirical study regarding the size distribution of traffic jams has been performed recently by Zhang et al. [7] They found an approximate universal power law for the jam sizes distribution.

See also
- Braess' paradox
- Flow network
- Heuristic routing
- Interplanetary Transport Network
- Network science
- Percolation theory
- Street network
- Rail network
- Multimodal transport
References
- Barthelemy, Marc (2010). "Spatial Networks". Physics Reports. 499 (1–3): 1–101. arXiv:1010.0302. Bibcode:2011PhR...499....1B. doi:10.1016/j.physrep.2010.11.002.
- Helbing, D (2001). "Traffic and related self-driven many-particle systems". Reviews of Modern Physics. 73 (4): 1067–1141. arXiv:cond-mat/0012229. Bibcode:2001RvMP...73.1067H. doi:10.1103/RevModPhys.73.1067.
- S., Kerner, Boris (2004). The Physics of Traffic : Empirical Freeway Pattern Features, Engineering Applications, and Theory. Berlin, Heidelberg: Springer Berlin Heidelberg. ISBN 9783540409861. OCLC 840291446.
- Wolf, D E; Schreckenberg, M; Bachem, A (June 1996). Traffic and Granular Flow. Traffic and Granular Flow. WORLD SCIENTIFIC. pp. 1–394. doi:10.1142/9789814531276. ISBN 9789810226350.
- Li, Daqing; Fu, Bowen; Wang, Yunpeng; Lu, Guangquan; Berezin, Yehiel; Stanley, H. Eugene; Havlin, Shlomo (2015-01-20). "Percolation transition in dynamical traffic network with evolving critical bottlenecks". Proceedings of the National Academy of Sciences. 112 (3): 669–672. Bibcode:2015PNAS..112..669L. doi:10.1073/pnas.1419185112. ISSN 0027-8424. PMC 4311803. PMID 25552558.
- Switch between critical percolation modes in city traffic dynamics G Zeng, D Li, S Guo, L Gao, Z Gao, HE Stanley, S Havlin Proceedings of the National Academy of Sciences 116 (1), 23-28 (2019) Scale-free resilience of real traffic jams
- Scale-free resilience of real traffic jams Limiao Zhang, Guanwen Zeng, Daqing Li, Hai-Jun Huang, H Eugene Stanley, Shlomo Havlin Proceedings of the National Academy of Sciences 116(18), 8673-8678 (2019)