Sustainability measurement
Sustainability measurement is the quantitative basis for the informed management of sustainability.[1] The metrics used for the measurement of sustainability (involving the sustainability of environmental, social and economic domains, both individually and in various combinations) are still evolving: they include indicators, benchmarks, audits, indexes and accounting, as well as assessment, appraisal[2] and other reporting systems. They are applied over a wide range of spatial and temporal scales.[3][4]
Some of the best known and most widely used sustainability measures include corporate sustainability reporting, Triple Bottom Line accounting, and estimates of the quality of sustainability governance for individual countries using the Global Green Economy Index (GGEI), Environmental Sustainability Index and Environmental Performance Index. An alternative approach, used by the United Nations Global Compact Cities Programme and explicitly critical of the triple-bottom-line approach is Circles of Sustainability.[5][6]
Sustainability need and framework.
Sustainability development has become yardstick of improvement for industries and are being integrated into effective business strategies. The needs for sustainability measurement are, improvement in the operations, bench-marking performances, tracking progress, evaluating process, etc.[7] For the purpose of building a proper sustainability indicator, framework is developed and the steps are as follows:[8]
- Defining the system- A proper and definite system is defined. A proper system boundary is drawn for further analysis.
- Elements of the system- The whole input, output of materials, emissions, energy and other auxiliary elements are properly analysed. The working conditions, process parameters and characteristics are defined in this step.
- Indicators selection- The indicators is selected of which measurement has to be done. This forms the metric for this system whose analysis is done in the further steps.
- Assessment and Measurement- Proper assessing tools are used and tests or experiments are performed for the pre-defined indicators to give a value for the indicators measurement.
- Analysis and reviewing the results- Once the results have been obtained, proper analysis and interpretation is done and tools are used to improve and revise the processes present in the system.
Sustainability indicators and their function
The principal objective of sustainability indicators is to inform public policy-making as part of the process of sustainability governance.[9] Sustainability indicators can provide information on any aspect of the interplay between the environment and socio-economic activities.[10] Building strategic indicator sets generally deals with just a few simple questions: what is happening? (descriptive indicators), does it matter and are we reaching targets? (performance indicators), are we improving? (efficiency indicators), are measures working? (policy effectiveness indicators), and are we generally better off? (total welfare indicators).
The International Institute for Sustainable Development and the United Nations Conference on Trade and Development established the Committee on Sustainability Assessment (COSA) in 2006 to evaluate sustainability initiatives operating in agriculture and develop indicators for their measurable social, economic and environmental objectives. [11]
One popular general framework used by The European Environment Agency uses a slight modification of the Organisation for Economic Co-operation and Development DPSIR system.[12] This breaks up environmental impact into five stages. Social and economic developments (consumption and production) (D)rive or initiate environmental (P)ressures which, in turn, produces a change in the (S)tate of the environment which leads to (I)mpacts of various kinds. Societal (R)esponses (policy guided by sustainability indicators) can be introduced at any stage of this sequence of events.
Metrics at the global scale
There are numerous indicators which could be used as basis for sustainability measurement. Few commonly used indicators are:
Environmental sustainability indicators:[13]
- Global warming potential
- Acidification potential
- Ozone depletion potential
- Aerosol optical depth
- Eutrophication potential
- Ionization radiation potential
- Photochemical ozone potential
- Waste treatment
- Freshwater use
- Energy resources use
- Gross domestic product
- Trade balance
- Local government income
- Profit, value and tax
- Investments
Social indicators:[15]
- Employment generated
- Equity
- Health and safety
- Education
- Housing/living conditions
- Community cohesion
- Social security
Due to the large numbers of various indicators that could be used for sustainability measurement, proper assessment and monitoring is required.[15] In order to organize the chaos and disorder in selecting the metrics, specific organizations have been set up which groups the metrics under different categories and defines proper methodology to implement it for measurement. They provide modelling techniques and indexes to compare the measurement and have methods to convert the scientific measurement results into easy to understand terms.[16]
United Nations indicators
The United Nations has developed extensive sustainability measurement tools in relation to sustainable development [17] as well as a System of Integrated Environmental and Economic Accounting.[18]

The UN Commission on Sustainable Development (CSD) has published a list of 140 indicators which covers environmental, social, economical and institutional aspects of sustainable development.[19]
Benchmarks, indicators, indexes, auditing etc.
In the last couple of decades, there has arisen a crowded toolbox of quantitative methods used to assess sustainability — including measures of resource use like life cycle assessment, measures of consumption like the ecological footprint and measurements of quality of environmental governance like the Environmental Performance Index. The following is a list of quantitative "tools" used by sustainability scientists - the different categories are for convenience only as defining criteria will inter grade. It would be too difficult to list all those methods available at different levels of the organisation so those listed here are at for the global level only.
- A benchmark is a point of reference for a measurement. Once a benchmark is established it is possible to assess trends and measure progress. Baseline global data on a range of sustainability parameters is available in the list of global sustainability statistics.
- A sustainability index is an aggregate sustainability indicator that combines multiple sources of data. There is a Consultative Group on Sustainable Development Indices[20]
|
|
|
- Metrics
- Many environmental problems ultimately relate to the human effect on those global biogeochemical cycles that are critical to life. Over the last decade monitoring these cycles have become a more urgent target for research:
|
|
|
- Sustainability auditing and reporting are used to evaluate the sustainability performance of a company, organization, or other entity using various performance indicators.[24] Popular auditing procedures available at the global level include:
- ISO 14000
- ISO 14031
- The Natural Step
- Triple Bottom Line Accounting
- input-output analysis can be used for any level of organization with a financial budget. It relates environmental impact to expenditure by calculating the resource intensity of goods and services.
- Reporting
- Global Reporting Initiative modelling and monitoring procedures.[25][26][27] Many of these are currently in their developing phase.
- State of the Environment reporting provides general background information on the environment and is progressively including more indicators.
- European sustainability [28]
- Accounting
- Some accounting methods attempt to include environmental costs rather than treating them as externalities
- Green accounting
- Sustainable value
- Sustainability economics [29]
Resource metrics
Part of this process can relate to resource use such as energy accounting or to economic metrics or price system values as compared to non-market economics potential, for understanding resource use.[30]
An important task for resource theory (energy economics) is to develop methods to optimize resource conversion processes.[31] These systems are described and analyzed by means of the methods of mathematics and the natural sciences.[32] Human factors, however, have dominated the development of our perspective of the relationship between nature and society since at least the Industrial Revolution, and in particular, have influenced how we describe and measure the economic impacts of changes in resource quality. A balanced view of these issues requires an understanding of the physical framework in which all human ideas, institutions, and aspirations must operate.[33]

Energy returned on energy invested
When oil production first began in the mid-nineteenth century, the largest oil fields recovered fifty barrels of oil for every barrel used in the extraction, transportation, and refining. This ratio is often referred to as the Energy Return on Energy Investment (EROI or EROEI). Currently, between one and five barrels of oil are recovered for each barrel-equivalent of energy used in the recovery process.[34] As the EROEI drops to one, or equivalently the Net energy gain falls to zero, the oil production is no longer a net energy source.[35] This happens long before the resource is physically exhausted.
Note that it is important to understand the distinction between a barrel of oil, which is a measure of oil, and a barrel of oil equivalent (BOE), which is a measure of energy. Many sources of energy, such as fission, solar, wind, and coal, are not subject to the same near-term supply restrictions that oil is. Accordingly, even an oil source with an EROEI of 0.5 can be usefully exploited if the energy required to produce that oil comes from a cheap and plentiful energy source. Availability of cheap, but hard to transport, natural gas in some oil fields has led to using natural gas to fuel enhanced oil recovery. Similarly, natural gas in huge amounts is used to power most Athabasca Tar Sands plants. Cheap natural gas has also led to Ethanol fuel produced with a net EROEI of less than 1, although figures in this area are controversial because methods to measure EROEI are in debate.
Growth-based economic models
Insofar as economic growth is driven by oil consumption growth, post-peak societies must adapt. M. King Hubbert believed:[36]
Our principal constraints are cultural. During the last two centuries we have known nothing but exponential growth and in parallel we have evolved what amounts to an exponential-growth culture, a culture so heavily dependent upon the continuance of exponential growth for its stability that it is incapable of reckoning with problems of nongrowth.
Some economists describe the problem as uneconomic growth or a false economy. At the political right, Fred Ikle has warned about "conservatives addicted to the Utopia of Perpetual Growth".[37] Brief oil interruptions in 1973 and 1979 markedly slowed - but did not stop - the growth of world GDP.[38]
Between 1950 and 1984, as the Green Revolution transformed agriculture around the globe, world grain production increased by 250%. The energy for the Green Revolution was provided by fossil fuels in the form of fertilizers (natural gas), pesticides (oil), and hydrocarbon fueled irrigation.[39]
David Pimentel, professor of ecology and agriculture at Cornell University, and Mario Giampietro, senior researcher at the National Research Institute on Food and Nutrition (INRAN), place in their study Food, Land, Population and the U.S. Economy the maximum U.S. population for a sustainable economy at 200 million. To achieve a sustainable economy world population will have to be reduced by two-thirds, says the study.[40] Without population reduction, this study predicts an agricultural crisis beginning in 2020, becoming critical c. 2050. The peaking of global oil along with the decline in regional natural gas production may precipitate this agricultural crisis sooner than generally expected. Dale Allen Pfeiffer claims that coming decades could see spiraling food prices without relief and massive starvation on a global level such as never experienced before.[41][42]
Hubbert peaks
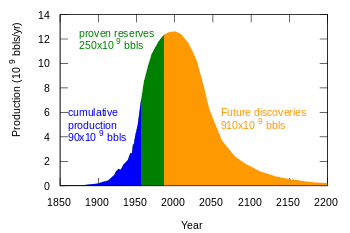
There is an active debate about most suitable sustainability indicator's use and by adopting a thermodynamic approach through the concept of "exergy" and Hubbert peaks, it is possible to incorporate all into a single measure of resource depletion.The exergy analysis of minerals could constitute a universal and transparent tool for the management of the earth's physical stock.[43][15]
Hubbert peak can be used as a metric for sustainability and depletion of non-renewable resources. It can be used as reference for many metrics for non-renewable resources such as:[44]
- Stagnating supplies
- Rising prices
- Individual country peaks
- Decreasing discoveries
- Finding and development costs
- Spare capacity
- Export capabilities of producing countries
- System inertia and timing
- Reserves-to-production ratio
- Past history of depletion and optimism
Although Hubbert peak theory receives most attention in relation to peak oil production, it has also been applied to other natural resources.
Natural gas
Doug Reynolds predicted in 2005 that the North American peak would occur in 2007.[45] Bentley (p. 189) predicted a world "decline in conventional gas production from about 2020".[46]
Coal
Peak coal is significantly further out than peak oil, but we can observe the example of anthracite in the US, a high grade coal whose production peaked in the 1920s. Anthracite was studied by Hubbert, and matches a curve closely.[47] Pennsylvania's coal production also matches Hubbert's curve closely, but this does not mean that coal in Pennsylvania is exhausted—far from it. If production in Pennsylvania returned at its all-time high, there are reserves for 190 years. Hubbert had recoverable coal reserves worldwide at 2500 × 109 metric tons and peaking around 2150(depending on usage).
More recent estimates suggest an earlier peak. Coal: Resources and Future Production (PDF 630KB [48]), published on April 5, 2007 by the Energy Watch Group (EWG), which reports to the German Parliament, found that global coal production could peak in as few as 15 years.[49] Reporting on this Richard Heinberg also notes that the date of peak annual energetic extraction from coal will likely come earlier than the date of peak in quantity of coal (tons per year) extracted as the most energy-dense types of coal have been mined most extensively.[50] A second study, The Future of Coal by B. Kavalov and S. D. Peteves of the Institute for Energy (IFE), prepared for European Commission Joint Research Centre, reaches similar conclusions and states that ""coal might not be so abundant, widely available and reliable as an energy source in the future".[49]
Work by David Rutledge of Caltech predicts that the total of world coal production will amount to only about 450 gigatonnes.[51] This implies that coal is running out faster than usually assumed.
Finally, insofar as global peak oil and peak in natural gas are expected anywhere from imminently to within decades at most, any increase in coal production (mining) per annum to compensate for declines in oil or NG production, would necessarily translate to an earlier date of peak as compared with peak coal under a scenario in which annual production remains constant.
Fissionable materials
In a paper in 1956,[52] after a review of US fissionable reserves, Hubbert notes of nuclear power:
There is promise, however, provided mankind can solve its international problems and not destroy itself with nuclear weapons, and provided world population (which is now expanding at such a rate as to double in less than a century) can somehow be brought under control, that we may at last have found an energy supply adequate for our needs for at least the next few centuries of the "foreseeable future."
Technologies such as the thorium fuel cycle, reprocessing and fast breeders can, in theory, considerably extend the life of uranium reserves. Roscoe Bartlett claims [53]
Our current throwaway nuclear cycle uses up the world reserve of low-cost uranium in about 20 years.
Caltech physics professor David Goodstein has stated[54] that
... you would have to build 10,000 of the largest power plants that are feasible by engineering standards in order to replace the 10 terawatts of fossil fuel we're burning today ... that's a staggering amount and if you did that, the known reserves of uranium would last for 10 to 20 years at that burn rate. So, it's at best a bridging technology ... You can use the rest of the uranium to breed plutonium 239 then we'd have at least 100 times as much fuel to use. But that means you're making plutonium, which is an extremely dangerous thing to do in the dangerous world that we live in.
Metals
Hubbert applied his theory to "rock containing an abnormally high concentration of a given metal"[55] and reasoned that the peak production for metals such as copper, tin, lead, zinc and others would occur in the time frame of decades and iron in the time frame of two centuries like coal. The price of copper rose 500% between 2003 and 2007[56] was by some attributed to peak copper.[57][58] Copper prices later fell, along with many other commodities and stock prices, as demand shrank from fear of a global recession.[59] Lithium availability is a concern for a fleet of Li-ion battery using cars but a paper published in 1996 estimated that world reserves are adequate for at least 50 years.[60] A similar prediction [61] for platinum use in fuel cells notes that the metal could be easily recycled.
Phosphorus
Phosphorus supplies are essential to farming and depletion of reserves is estimated at somewhere from 60 to 130 years.[62] Individual countries supplies vary widely; without a recycling initiative America's supply [63] is estimated around 30 years.[64] Phosphorus supplies affect total agricultural output which in turn limits alternative fuels such as biodiesel and ethanol.
Peak water
Hubbert's original analysis did not apply to renewable resources. However over-exploitation often results in a Hubbert peak nonetheless. A modified Hubbert curve applies to any resource that can be harvested faster than it can be replaced.[65]
For example, a reserve such as the Ogallala Aquifer can be mined at a rate that far exceeds replenishment. This turns much of the world's underground water [66] and lakes [67] into finite resources with peak usage debates similar to oil. These debates usually center around agriculture and suburban water usage but generation of electricity [68] from nuclear energy or coal and tar sands mining mentioned above is also water resource intensive. The term fossil water is sometimes used to describe aquifers whose water is not being recharged.
Renewable resources
- Fisheries: At least one researcher has attempted to perform Hubbert linearization (Hubbert curve) on the whaling industry, as well as charting the transparently dependent price of caviar on sturgeon depletion.[69] Another example is the cod of the North Sea.[70] The comparison of the cases of fisheries and of mineral extraction tells us that the human pressure on the environment is causing a wide range of resources to go through a depletion cycle which follows a Hubbert curve.
Sustainability gaps
Sustainability measurements and indicators is an ever-evolving and changing process and has various gaps to be filled in order to achieve a proper framework and model. Following points are some of the breaks in continuity:
- Global Indicators- Due to difference in social, economical and environmental conditions of countries, each country has their own indicators and indexes to measure sustainability which can lead to improper and varying interpretation at the global level. Hence, there is a requirement of indexes and measuring parameters which is intended to be common among the countries, which could possibly give a comparison among countries[71][72]. In agriculture, comparable indicators are already in use. Coffee and cocoa studies in twelve countries[73] using common indicators are among the first to report insights from comparing across countries.
- Policy making- After the indicators are defined and analysis is done for the measurements from the indicators, proper policy making methodology can be set up to improve the results achieved. Policy making would implement changes in the particular inventory list used in measuring the metric, which can lead to better and positive results.[74][75]
- Development of individual indicators- Value based indicators can be developed to measure the efforts by every human being part of the ecosystem. This can affect the policy making, as a policy is effective only if there is public participation.[71]
- Data collection- Due to improper methodology applied to data collection, dynamics of change in data, lack of adequate time and improper framework in analysis of data, can lead to measurements which can be outdated, inaccurate and unpresentable. Data collections are intended to be from grass roots level and there can be proper framework and regulation associated with it. It is intended to have a proper hierarchy of data collection starting from local zones to state level to national level and finally contributing to the global level measurements. Data collected can be made easy to understand so that it could be correctly interpreted and in a presentable manner consisting of graphs, charts and analysis bars.[76][74][71]
- Integration across academic disciplines- Sustainability involves whole of the ecosystem and is intended to have a holistic approach. For this purpose measurements intends to involve data and knowledge from all academic backgrounds. Moreover, these disciplines and insights is intended to align with the societal actions.[71][74][72][75][76]
See also
- Balanced scorecard
- Carbon accounting
- Circles of Sustainability
- Context-Based Sustainability
- Corporate social responsibility
- Ecolabel
- Ecological indicator
- Embodied energy
- Environmental audits
- Glossary of environmental science
- Green accounting
- Helix of sustainability
- Social accounting
- Sustainability governance
- Sustainability metrics and indices
- Sustainability science
References
- "Sustainability Accounting in UK Local Government". The Association of Chartered Certified Accountants. Archived from the original on 2008-04-11. Retrieved 2008-06-18.
- Dalal-Clayton, Barry and Sadler, Barry 2009. Sustainability Appraisal. A Sourcebook and Reference Guide to International Experience. London: Earthscan. ISBN 978-1-84407-357-3.
- Hak, T. et al. 2007. Sustainability Indicators, SCOPE 67. Island Press, London.
- Bell, Simon and Morse, Stephen 2008. Sustainability Indicators. Measuring the Immeasurable? 2nd edn. London: Earthscan. ISBN 978-1-84407-299-6. https://books.google.com/books/about/Sustainability_Indicators.html?id=6DOC13cd9c0C
- Singh, Rajesh Kumar; Murty, H.R.; Gupta, S.K.; Dikshit, A.K. (2012). "An overview of sustainability assessment methodologies". Ecological Indicators. 15: 281–299. doi:10.1016/j.ecolind.2011.01.007.
- Moldan, Bedřich; Janoušková, Svatava; Hák, Tomáš (2012). "How to understand and measure environmental sustainability: Indicators and targets". Ecological Indicators. 17: 4–13. doi:10.1016/j.ecolind.2011.04.033.
- Martins, António A.; Mata, Teresa M.; Costa, Carlos A. V.; Sikdar, Subhas K. (2007-05-01). "Framework for Sustainability Metrics". Industrial & Engineering Chemistry Research. 46 (10): 2962–2973. doi:10.1021/ie060692l. ISSN 0888-5885.
- https://www.epa.gov/sites/production/files/2014-10/documents/framework-for-sustainability-indicators-at-epa.pdf
- Boulanger, P. M. (2008-11-26). "Sustainable development indicators: a scientific challenge, a democratic issue". S.A.P.I.EN.S. 1 (1). Retrieved 2013-07-23.
- Hak, T., Moldan, B. & Dahl, A.L. 2007. SCOPE 67. Sustainability indicators. Island Press, London.
- Giovannucci D, Potts J (2007). The COSA Project (PDF) (Report). International Institute for Sustainable Development.
- Stanners, D. et al. 2007. Frameworks for environmental assessment and indicators at the EEA. In: Hak, T., Moldan, B. & Dahl, A.L. 2007. SCOPE 67. Sustainability indicators. Island Press, London.
- Dong, Yan; Hauschild, Michael Z. (2017). "Indicators for Environmental Sustainability". Procedia CIRP. 61: 697–702. doi:10.1016/j.procir.2016.11.173.
- Tisdell, Clem (May 1996). "Economic indicators to assess the sustainability of conservation farming projects: An evaluation". Agriculture, Ecosystems & Environment. 57 (2–3): 117–131. doi:10.1016/0167-8809(96)01017-1.
- Labuschagne, Carin; Brent, Alan C.; van Erck, Ron P.G. (March 2005). "Assessing the sustainability performances of industries". Journal of Cleaner Production. 13 (4): 373–385. doi:10.1016/j.jclepro.2003.10.007. hdl:2263/4325.
- "Indicators and a Monitoring Framework for the Sustainable Development Goals .:. Sustainable Development Knowledge Platform". sustainabledevelopment.un.org. Retrieved 2019-02-27.
- United Nations sustainable development indicators
- , International Standard Industrial Classification UN System of Integrated Environmental and Economic Accounting
- http://www.pvsustain.org/dmdocuments/Class%203%20Singh%20Sustainable%20Assessment.pdf
- "Consultative Group on Sustainable Development Indices". International Institute for Sustainable Development. Retrieved 2008-06-18.
- "SGI – Sustainable Governance Indicators 2011". Sgi-network.org. Retrieved 2013-07-23.
- Mitropoulos, Lambros K.; Prevedouros, Panos D. (2013). "Mitropoulos L. and P.Prevedouros. 2014. Assessment of Sustainability for Transportation Vehicles". Transportation Research Record: Journal of the Transportation Research Board. 2344: 88–97. doi:10.3141/2344-10.
- Sullivan, C.A. et al. (eds) 2003. The water poverty index: development and application at the community scale. Natural Resources Forum 27: 189-199.
- Hill, J. 1992. Towards Good Environmental Practice. The Institute of Business Ethics, London.
- "Global Reporting Initiative". Global Reporting Initiative. Archived from the original on 2008-06-16. Retrieved 2008-06-18.
- "Global Reporting Initiative Guidelines 2002" (PDF). Archived from the original (PDF) on 2008-12-17. Retrieved 2008-06-18.
- "International Corporate Sustainability Reporting". Archived from the original on 2007-11-21. Retrieved 2008-06-18.
- Eurostat. (2007). "Measuring progress towards a more sustainable Europe. 2007 monitoring report of the EU sustainable development strategy." Retrieved on 2009-04-14.
- Archived 2008-02-05 at the Wayback Machine|Publications on sustainability measurement used in sustainability economics
- "Net energy analysis". Eoearth.org. 2010-07-23. Retrieved 2013-07-23.
- "Environmental Decision Making, Science, and Technology". Telstar.ote.cmu.edu. Archived from the original on 2010-01-05. Retrieved 2013-07-23.
- "Exergy - A Useful Concept.Intro". Exergy.se. Retrieved 2013-07-23.
- "Energy and economic myths (historical)". Eoearth.org. Retrieved 2013-07-23.
- Tripathi, Vinay S.; Brandt, Adam R. (2017-02-08). "Estimating decades-long trends in petroleum field energy return on investment (EROI) with an engineering-based model". PLoS ONE. 12 (2): e0171083. Bibcode:2017PLoSO..1271083T. doi:10.1371/journal.pone.0171083. ISSN 1932-6203. PMC 5298284. PMID 28178318.
- Michaux, Simon. "Appendix D -ERoEI Comparison of Energy Resources". Cite journal requires
|journal=(help) - "Exponential Growth as a Transient Phenomenon in Human History". Hubbertpeak.com. Retrieved 2013-07-23.
- "Our Perpetual Growth Utopia". Dieoff.org. Retrieved 2013-07-23.
- http://www.imf.org/external/np/speeches/2006/pdf/050206.pdf
- How peak oil could lead to starvation Archived 2007-08-18 at the Wayback Machine
- Taggart, Adam (2003-10-02). "Eating Fossil Fuels". EnergyBulletin.net. Archived from the original on 2007-06-11. Retrieved 2013-07-23.
- Peak Oil: the threat to our food security Archived July 14, 2009, at the Wayback Machine
- The Oil Drum: Europe. "Agriculture Meets Peak Oil". Europe.theoildrum.com. Retrieved 2013-07-23.
- Valero, Alicia; Valero, Antonio; Mudd, Gavin M (2009). Exergy – A Useful Indicator for the Sustainability of Mineral Resources and Mining. Proceedings of SDIMI Conference. Gold Coast, QLD. pp. 329–38. ISBN 978-1-921522-01-7.
- Brecha, Robert (12 February 2013). "Ten Reasons to Take Peak Oil Seriously". Sustainability. 5 (2): 664–694. doi:10.3390/su5020664.
- White, Bill (December 17, 2005). "State's consultant says nation is primed for using Alaska gas". Anchorage Daily News. Archived from the original on February 21, 2009.
- Bentley, R.W. (2002). "Viewpoint - Global oil & gas depletion: an overview" (PDF). Energy Policy. 30 (3): 189–205. doi:10.1016/S0301-4215(01)00144-6.
- GEO 3005: Earth Resources Archived July 25, 2008, at the Wayback Machine
- "Startseite" (PDF). Energy Watch Group. Archived from the original (PDF) on 2013-09-11. Retrieved 2013-07-23.
- Hamilton, Rosie (2007-05-21). "Peak coal: sooner than you think". Energybulletin.net. Archived from the original on 2008-05-22. Retrieved 2013-07-23.
- "Museletter". Richard Heinberg. December 2009. Retrieved 2013-07-23.
- "Coal: Bleak outlook for the black stuff", by David Strahan, New Scientist, Jan. 19, 2008, pp. 38-41.
- "Archived copy" (PDF). Archived from the original (PDF) on 2008-05-27. Retrieved 2014-11-10.CS1 maint: archived copy as title (link)
- "Archived copy" (PDF). Archived from the original (PDF) on 2006-10-25. Retrieved 2006-11-13.CS1 maint: archived copy as title (link)
- Jones, Tony (23 November 2004). "Professor Goodstein discusses lowering oil reserves". Australian Broadcasting Corporation. Archived from the original on 2013-05-09. Retrieved 14 April 2013.
- "Exponential Growth as a Transient Phenomenon in Human History". Hubbertpeak.com. Retrieved 2013-07-23.
- http://minerals.usgs.gov/minerals/pubs/commodity/copper/mcs-2008-coppe.pdf Copper Statistics and Information, 2007. USGS
- Andrew Leonard (2006-03-02). "Peak copper?". Salon - How the World Works. Retrieved 2008-03-23.
- Silver Seek LLC. "Peak Copper Means Peak Silver - SilverSeek.com". News.silverseek.com. Archived from the original on 2013-11-04. Retrieved 2013-07-23.
- COMMODITIES-Demand fears hit oil, metals prices, Jan 29, 2009.
- Will, Fritz G. (1996). "Impact of lithium abundance and cost on electric vehicle battery applications". Journal of Power Sources. Cat.inist.fr. 63 (1): 23–26. Bibcode:1996JPS....63...23W. doi:10.1016/S0378-7753(96)02437-8. Retrieved 2013-07-23.
- "Department for Transport - Inside Government - GOV.UK". Dft.gov.uk. Retrieved 2013-07-23.
- "APDA" (PDF). Apda.pt. Retrieved 2013-07-23.
- http://minerals.usgs.gov/minerals/pubs/commodity/phosphate_rock/phospmcs06.pdf
- "Archived copy" (PDF). Archived from the original (PDF) on 2006-08-05. Retrieved 2013-12-27.CS1 maint: archived copy as title (link)
- Meena Palaniappan and Peter H. Gleick (2008). "The World's Water 2008-2009, Ch 1" (PDF). Pacific Institute. Archived from the original (PDF) on 2009-03-20. Retrieved 2009-01-31.
- "WorldŐs largest acquifer going dry". Uswaternews.com. Archived from the original on 2012-12-09. Retrieved 2013-07-23.
- Archived July 20, 2008, at the Wayback Machine
- "How General is the Hubbert Curve?". Aspoitalia.net. Retrieved 2013-07-23.
- "Laherrere: Multi-Hubbert Modeling". Hubbertpeak.com. Retrieved 2013-07-23.
- Dahl, Arthur Lyon (2012). "Achievements and gaps in indicators for sustainability". Ecological Indicators. 17: 14–19. doi:10.1016/j.ecolind.2011.04.032.
- Udo, Victor E.; Jansson, Peter Mark (2009). "Bridging the gaps for global sustainable development: A quantitative analysis". Journal of Environmental Management. 90 (12): 3700–3707. doi:10.1016/j.jenvman.2008.12.020. PMID 19500899.
- Allen S, Bennett M, Garcia C, Giovannucci D, Ingersoll C, Kraft K, Potts J, Rue C (2014-01-31). Everage L, Ingersoll C, Mullan J, Salinas L, Childs A (eds.). The COSA Measuring Sustainability Report (Report). Committee on Sustainability Assessment.
- Keirstead, James; Leach, Matt (2008). "Bridging the gaps between theory and practice: A service niche approach to urban sustainability indicators". Sustainable Development. 16 (5): 329–340. doi:10.1002/sd.349.
- Fischer, Joern; Manning, Adrian D.; Steffen, Will; Rose, Deborah B.; Daniell, Katherine; Felton, Adam; Garnett, Stephen; Gilna, Ben; Heinsohn, Rob; Lindenmayer, David B.; MacDonald, Ben; Mills, Frank; Newell, Barry; Reid, Julian; Robin, Libby; Sherren, Kate; Wade, Alan (2007). "Mind the sustainability gap". Trends in Ecology & Evolution. 22 (12): 621–624. doi:10.1016/j.tree.2007.08.016. PMID 17997188.
- Ekins, Paul; Simon, Sandrine (2001). "Estimating sustainability gaps: Methods and preliminary applications for the UK and the Netherlands" (PDF). Ecological Economics. 37: 5–22. doi:10.1016/S0921-8009(00)00279-2.
External links
- Curated bibliography at IDEAS/RePEc