Optical spectrometer
An optical spectrometer (spectrophotometer, spectrograph or spectroscope) is an instrument used to measure properties of light over a specific portion of the electromagnetic spectrum, typically used in spectroscopic analysis to identify materials.[1] The variable measured is most often the light's intensity but could also, for instance, be the polarization state. The independent variable is usually the wavelength of the light or a unit directly proportional to the photon energy, such as reciprocal centimeters or electron volts, which has a reciprocal relationship to wavelength.
A spectrometer is used in spectroscopy for producing spectral lines and measuring their wavelengths and intensities. Spectrometers may also operate over a wide range of non-optical wavelengths, from gamma rays and X-rays into the far infrared. If the instrument is designed to measure the spectrum in absolute units rather than relative units, then it is typically called a spectrophotometer. The majority of spectrophotometers are used in spectral regions near the visible spectrum.
In general, any particular instrument will operate over a small portion of this total range because of the different techniques used to measure different portions of the spectrum. Below optical frequencies (that is, at microwave and radio frequencies), the spectrum analyzer is a closely related electronic device.
Spectrometers are used in many fields. For example, they are used in astronomy to analyze the radiation from astronomical objects and deduce chemical composition. The spectrometer uses a prism or a grating to spread the light from a distant object into a spectrum. This allows astronomers to detect many of the chemical elements by their characteristic spectral fingerprints. If the object is glowing by itself, it will show spectral lines caused by the glowing gas itself. These lines are named for the elements which cause them, such as the hydrogen alpha, beta, and gamma lines. Chemical compounds may also be identified by absorption. Typically these are dark bands in specific locations in the spectrum caused by energy being absorbed as light from other objects passes through a gas cloud. Much of our knowledge of the chemical makeup of the universe comes from spectra.
Spectroscopes
 | |
| Other names | Spectrograph |
|---|---|
| Related items | Mass spectrograph |
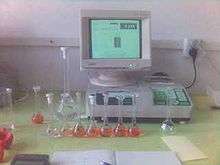
Spectroscopes are often used in astronomy and some branches of chemistry. Early spectroscopes were simply prisms with graduations marking wavelengths of light. Modern spectroscopes generally use a diffraction grating, a movable slit, and some kind of photodetector, all automated and controlled by a computer.
Joseph von Fraunhofer developed the first modern spectroscope by combining a prism, diffraction slit and telescope in a manner that increased the spectral resolution and was reproducible in other laboratories. Fraunhofer also went on to invent the first diffraction spectroscope.[2] Gustav Robert Kirchhoff and Robert Bunsen discovered the application of spectroscopes to chemical analysis and used this approach to discover caesium and rubidium.[3][4] Kirchhoff and Bunsen's analysis also enabled a chemical explanation of stellar spectra, including Fraunhofer lines.[5]
When a material is heated to incandescence it emits light that is characteristic of the atomic makeup of the material. Particular light frequencies give rise to sharply defined bands on the scale which can be thought of as fingerprints. For example, the element sodium has a very characteristic double yellow band known as the Sodium D-lines at 588.9950 and 589.5924 nanometers, the color of which will be familiar to anyone who has seen a low pressure sodium vapor lamp.
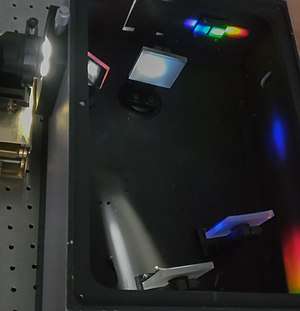
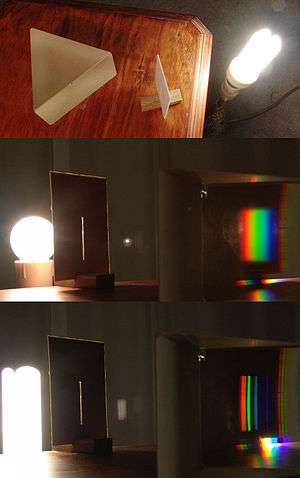
In the original spectroscope design in the early 19th century, light entered a slit and a collimating lens transformed the light into a thin beam of parallel rays. The light then passed through a prism (in hand-held spectroscopes, usually an Amici prism) that refracted the beam into a spectrum because different wavelengths were refracted different amounts due to dispersion. This image was then viewed through a tube with a scale that was transposed upon the spectral image, enabling its direct measurement.
With the development of photographic film, the more accurate spectrograph was created. It was based on the same principle as the spectroscope, but it had a camera in place of the viewing tube. In recent years, the electronic circuits built around the photomultiplier tube have replaced the camera, allowing real-time spectrographic analysis with far greater accuracy. Arrays of photosensors are also used in place of film in spectrographic systems. Such spectral analysis, or spectroscopy, has become an important scientific tool for analyzing the composition of unknown material and for studying astronomical phenomena and testing astronomical theories.
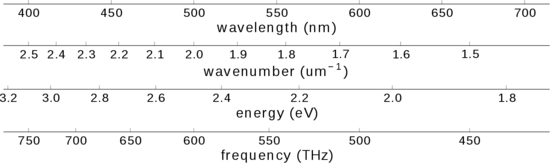
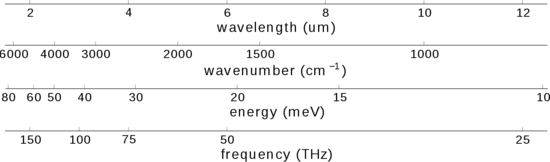
In modern spectrographs in the UV, visible, and near-IR spectral ranges, the spectrum is generally given in the form of photon number per unit wavelength (nm or μm), wavenumber (μm−1, cm−1), frequency (THz), or energy (eV), with the units indicated by the abscissa. In the mid- to far-IR, spectra are typically expressed in units of Watts per unit wavelength (μm) or wavenumber (cm−1). In many cases, the spectrum is displayed with the units left implied (such as "digital counts" per spectral channel).
Spectrographs
A spectrograph is an instrument that separates light by its wavelengths and records this data.[7] A spectrograph typically has a multi-channel detector system or camera that detects and records the spectrum of light.[7][8]
The term was first used in 1876 by Dr. Henry Draper when he invented the earliest version of this device, and which he used to take several photographs of the spectrum of Vega. This earliest version of the spectrograph was cumbersome to use and difficult to manage.[9]
There are several kinds of machines referred to as spectrographs, depending on the precise nature of the waves. The first spectrographs used photographic paper as the detector. The plant pigment phytochrome was discovered using a spectrograph that used living plants as the detector. More recent spectrographs use electronic detectors, such as CCDs which can be used for both visible and UV light. The exact choice of detector depends on the wavelengths of light to be recorded.
A spectrograph is sometimes called polychromator, as an analogy to monochromator.
Stellar and solar spectrograph
The star spectral classification and discovery of the main sequence, Hubble's law and the Hubble sequence were all made with spectrographs that used photographic paper. The forthcoming James Webb Space Telescope will contain both a near-infrared spectrograph (NIRSpec) and a mid-infrared spectrograph (MIRI).
Echelle spectrograph
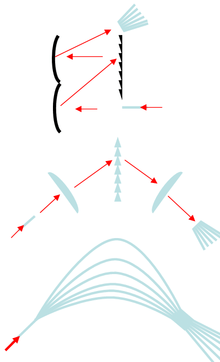
An Echelle spectrograph uses two diffraction gratings, rotated 90 degrees with respect to each other and placed close to one another. Therefore, an entrance point and not a slit is used and a 2d CCD-chip records the spectrum. Usually one would guess to retrieve a spectrum on the diagonal, but when both gratings have a wide spacing and one is blazed so that only the first order is visible and the other is blazed that a lot of higher orders are visible, one gets a very fine spectrum nicely folded onto a small common CCD-chip. The small chip also means that the collimating optics need not to be optimized for coma or astigmatism, but the spherical aberration can be set to zero.
See also
References
- Butler, L. R. P.; Laqua, K. (1995). "Nomenclature, symbols, units and their usage in spectrochemical analysis-IX. Instrumentation for the spectral dispersion and isolation of optical radiation (IUPAC Recommendations 1995)". Pure Appl. Chem. 67 (10): 1725–1744. doi:10.1351/pac199567101725.
A spectrometer is the general term for describing a combination of spectral apparatus with one or more detectors to measure the intensity of one or more spectral bands.
- Brand, John C. D. (1995). Lines of Light: The Sources of Dispersive Spectroscopy, 1800–1930. Gordon and Breach Publishers. pp. 37–42. ISBN 978-2884491624.CS1 maint: ref=harv (link)
- Weeks, Mary Elvira (1932). "The discovery of the elements. XIII. Some spectroscopic discoveries". Journal of Chemical Education. 9 (8): 1413–1434. Bibcode:1932JChEd...9.1413W. doi:10.1021/ed009p1413.
- "Robert Bunsen". infoplease. Pearson Education. 2007. Retrieved 2011-11-21.
- Brand 1995, p. 63
- "Powerful New VLT Instrument Arrives in Chile". ESO Announcement. Retrieved 11 October 2012.
- Spectrometer, Spectroscope, and SpectrographExcerpt from Field Guide to Spectroscopy
- IUPAC, Compendium of Chemical Terminology, 2nd ed. (the "Gold Book") (1997). Online corrected version: (2006–) "spectrograph". doi:10.1351/goldbook.S05836
- George Barker, Memoir of Henry Draper, 1837-1882 (PDF), p. 103
Bibliography
- J. F. James and R. S. Sternberg (1969), The Design of Optical Spectrometers (Chapman and Hall Ltd)
- James, John (2007), Spectrograph Design Fundamentals (Cambridge University Press) ISBN 0-521-86463-1
- Browning, John (1882), How to work with the spectroscope : a manual of practical manipulation with spectroscopes of all kinds
- Palmer, Christopher (2020). Diffraction Grating Handbook (8th ed.). MKS Newport.
External links
| Look up optical spectrometer in Wiktionary, the free dictionary. |
| Wikimedia Commons has media related to Spectrographs. |
Optical spectrometer at Curlie
- Spectrograph for astronomical Spectra
- Photographs of spectrographs used in the Lick Observatory from the Lick Observatory Records Digital Archive, UC Santa Cruz Library’s Digital Collections
| Instrumentation |
|
|---|---|
| Techniques |
|
| Sampling |
|
| Calibration | |
| Prominent publications | |
| |