Southern Cone
The Southern Cone (Spanish: Cono Sur, Portuguese: Cone Sul) is a geographic and cultural region composed of the southernmost areas of South America, south of the Tropic of Capricorn. Traditionally, it covers Argentina, Chile and Uruguay, bounded on the west by the Pacific Ocean and on the east by the Atlantic Ocean. In terms of social, economic and political geography, the Southern Cone comprises Argentina, Chile and Uruguay, and sometimes includes Brazil's four southernmost states (Paraná, Rio Grande do Sul, Santa Catarina and São Paulo). In its broadest definition, taking into account common history and geography, it also includes Paraguay.[2]
| Southern Cone | |
|---|---|
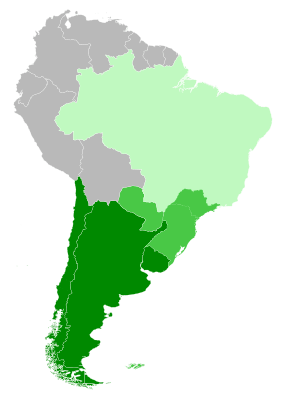 Regions always included in all definitions
Regions sometimes included
States of Brazil not generally included
| |
| Area | 5,712,034 kilometres (3,549,293 mi) |
| Population | 135,707,204 (July 2010 est.) |
| Density | 27.45/km2 (71.1/sq mi)[1] |
| Countries | |
| Dependencies | |
| Languages | Spanish, Portuguese and Guarani |
| Demonym | South American |
| Largest urban agglomerations | 1. 2. 3. 4. 5. 6. 7. 8. 9. 10. |
High life expectancy, the highest Human Development Index of Latin America, high standard of living, low fertility rates, significant participation in the global markets and the emerging economy of its members make the Southern Cone the most prosperous macro-region in Latin America.[2][3]
Geography and extent
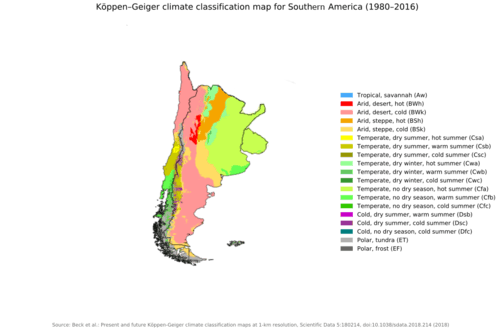


The climates are mostly temperate, but include humid subtropical, Mediterranean, highland tropical, maritime temperate, sub-Antarctic temperate, highland cold, desert and semi-arid temperate regions. Except for northern regions of Argentina (thermal equator in January), the whole country of Paraguay, the Argentina-Brazil border and the interior of the Atacama Desert, the region rarely suffers from heat. In addition to that, the winter presents mostly cool temperatures. Strong and constant wind and high humidity is what brings low temperatures in the winter. The Atacama is the driest place on Earth.
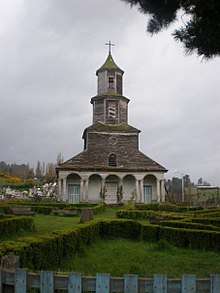
One of the most peculiar plants of the region is the Araucaria tree, which can be found in Brazil, Chile and Argentina. The only native group of conifers found in the southern hemisphere had its origin in the Southern Cone. Araucaria angustifolia, once widespread in Southern Brazil, is now a critically endangered species, protected by law. The prairies region of central Argentina, Uruguay and southern Brazil is known as the Pampas.
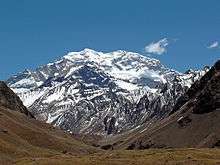
Central Chile has Mediterranean vegetation and climate, grading southward into oceanic climate. The Atacama, Patagonian and Monte deserts form a diagonal of arid lands separating the woodlands, croplands and pastures of La Plata basin from Central and Southern Chile. Apart from the desert diagonal, the north-south running Andes form a major divide in the Southern Cone and constitute, for most of its part in the southern cone, the Argentina–Chile border. In the east the river systems of the La Plata basin form natural barriers and sea-lanes between Argentina, Brazil, Paraguay and Uruguay.
| Location | January | April | July | October |
|---|---|---|---|---|
| Buenos Aires[4] | 30.1 °C (86.2 °F) 20.1 °C (68.2 °F) |
22.9 °C (73.2 °F) 13.8 °C (56.8 °F) |
15.4 °C (59.7 °F) 7.4 °C (45.3 °F) |
22.6 °C (72.7 °F) 13.3 °C (55.9 °F) |
| Santiago de Chile[5] | 30.1 °C (86.2 °F) 13.4 °C (56.1 °F) |
22.3 °C (72.1 °F) 6.5 °C (43.7 °F) |
14.3 °C (57.7 °F) 1.6 °C (34.9 °F) |
22.8 °C (73.0 °F) 8.4 °C (47.1 °F) |
| Montevideo | 28.1 °C (82.6 °F) 18.0 °C (64.4 °F) |
21.7 °C (71.1 °F) 12.9 °C (55.2 °F) |
14.6 °C (58.3 °F) 6.9 °C (44.4 °F) |
20.3 °C (68.5 °F) 11.5 °C (52.7 °F) |
| Córdoba | 31.1 °C (88.0 °F) 18.1 °C (64.6 °F) |
24.9 °C (76.8 °F) 12.3 °C (54.1 °F) |
18.5 °C (65.3 °F) 5.5 °C (41.9 °F) |
26.1 °C (79.0 °F) 12.6 °C (54.7 °F) |
| Valparaiso | 21.4 °C (70.5 °F) 13.5 °C (56.3 °F) |
18.3 °C (64.9 °F) 11.4 °C (52.5 °F) |
14.3 °C (57.7 °F) 9.2 °C (48.6 °F) |
17.0 °C (62.6 °F) 10.5 °C (50.9 °F) |
| Concepción | 22.8 °C (73.0 °F) 10.9 °C (51.6 °F) |
18.3 °C (64.9 °F) 8.1 °C (46.6 °F) |
13.2 °C (55.8 °F) 5.8 °C (42.4 °F) |
17.2 °C (63.0 °F) 7.4 °C (45.3 °F) |
| Mar del Plata | 26.3 °C (79.3 °F) 14.3 °C (57.7 °F) |
20.5 °C (68.9 °F) 9.1 °C (48.4 °F) |
13.1 °C (55.6 °F) 3.8 °C (38.8 °F) |
18.5 °C (65.3 °F) 7.6 °C (45.7 °F) |
| Neuquén | 32.0 °C (89.6 °F) 16.2 °C (61.2 °F) |
22.0 °C (71.6 °F) 7.0 °C (44.6 °F) |
12.2 °C (54.0 °F) 0.0 °C (32.0 °F) |
23.4 °C (74.1 °F) 8.2 °C (46.8 °F) |
| Iquique | 25.3 °C (77.5 °F) 19.2 °C (66.6 °F) |
22.7 °C (72.9 °F) 16.9 °C (62.4 °F) |
18.0 °C (64.4 °F) 14.0 °C (57.2 °F) |
20.1 °C (68.2 °F) 15.4 °C (59.7 °F) |
| Bariloche | 21.4 °C (70.5 °F) 6.5 °C (43.7 °F) |
14.8 °C (58.6 °F) 1.8 °C (35.2 °F) |
6.4 °C (43.5 °F) −1.3 °C (29.7 °F) |
13.9 °C (57.0 °F) 1.3 °C (34.3 °F) |
| Ushuaia | 13.9 °C (57.0 °F) 5.4 °C (41.7 °F) |
9.6 °C (49.3 °F) 2.3 °C (36.1 °F) |
4.2 °C (39.6 °F) −1.7 °C (28.9 °F) |
10.5 °C (50.9 °F) 2.3 °C (36.1 °F) |
| Porto Alegre | 30.2 °C (86.4 °F) 20.5 °C (68.9 °F) |
25.2 °C (77.4 °F) 16.3 °C (61.3 °F) |
19.4 °C (66.9 °F) 10.7 °C (51.3 °F) |
24.4 °C (75.9 °F) 15.0 °C (59.0 °F) |

Culture

Besides sharing languages and colonial heritage, the residents of the states of the Southern Cone are avid players and fans of football, with top-notch teams competing in the sport. Argentina and Uruguay have both won the FIFA World Cup twice; they are the only national teams along with Brazil outside Europe to have won the cup. Argentina, Chile, Uruguay, and Brazil have all hosted the World Cup. Additionally, national teams from the region have won several Olympic medals in football. Also, football clubs from the Southern Cone countries have won large numbers of club competitions in South-American competitions, Pan-American competitions, and world-FIFA Club World Cup-level competitions.
The asado barbecue is a culinary tradition typical of the Southern Cone. The asado developed from the horsemen and cattle culture of the region, more specifically from the gauchos of Argentina, Uruguay and Southern Brazil (and Southern Chile) and the huasos of Chile. In the Southern Cone, horsemen are considered icons of national identity; they are featured in the epic poem Martín Fierro. Mate is popular throughout the Southern Cone.
In this area, there was extensive European immigration during the 19th- and 20th-centuries, who, with their descendants, have strongly influenced the culture, social life and politics of these countries.
In a social survey, residents rated their countries as 'good places for gay or lesbian people to live;' the following percentages said 'yes' in Uruguay (69%), Argentina (58%) and Chile (52%). By contrast, fewer people in the following countries agreed: Bolivia (24%), Ecuador (31%) and Peru (32%).[6]
Language
The overwhelming majority, including those of recent immigrant background, speak Spanish (in Argentina, Chile and Uruguay) or Portuguese in the case of Southern Brazil. The Spanish-speaking countries of the Southern Cone are divided into two main dialects:
- Castellano Rioplatense (River Plate Spanish), spoken in Argentina and Uruguay, where the accent and daily language is heavily influenced by 19th-20th century Italian immigrants, has a particular intonation famously recognized by Spanish speakers from around the world. It is sometimes erroneously referred to as "Castellano Argentino/Argentinean Spanish" due to the majority of the speakers (by population) being Argentinians. Preliminary research has shown that Rioplatense Spanish, has intonation patterns that resemble those of Italian dialects in the Naples region, and differ markedly from the patterns of other forms of Spanish.[7] Buenos Aires, Rosario, and Montevideo had a massive influx of Italian immigrant settlers from the mid-19th until mid-20th centuries. Researchers note that the development of this dialect is a relatively recent phenomenon, developing at the beginning of the 20th century with the main wave of Italian immigration.[8]
- Castellano Chileno (Chilean Spanish)
These dialects share common traits, such as a number of Lunfardo and Quechua words.
Other minor languages and dialects include Portuñol, a hybrid between Rioplatense and Brazilian Portuguese that is spoken in Uruguay on the border with Brazil.
Native American languages
Some Native American groups, especially in rural areas, continue to speak autochthonous languages, including Mapudungun (also known as Mapuche), Quechua, Aymara, and Guarani. The first is primarily spoken in Araucanía and adjacent areas of Patagonia, in southern Argentina and Chile. Guarani is an official language of Paraguay, the most widely spoken language in that country, and in 2010, the city of Tacuru, in the Brazilian state of Mato Grosso do Sul, adopted Guarani as the official language, besides Portuguese. It is also a co-official language in the northeastern Argentine provinces of Corrientes and Misiones.[9]
Non-Iberian immigrant languages
English is spoken in the Falkland Islands, a British Overseas Territory, and by descendants of British settlers in Argentina and Chile. Welsh is spoken by descendants of immigrants in the Patagonia region of Argentina.
Italian (mostly its Northern dialects, such as Venetian), is spoken in rural communities across Argentina and São Paulo where immigrants had settled. German in some dialects is mostly spoken in Southern Chile and Southern Brazil. German dialects are the second most spoken mother tongue in Brazil.[10][11][12] Polish, Dutch and Ukrainian are also spoken in Southern Brazil. Dutch is spoken in Chile as well, Ukrainian is used in Argentina as well. Croatian and other Slavic languages are also spoken in the southernmost areas of Chilean Patagonia, reflecting patterns of immigration and settlement.
Yiddish can be heard mainly in Buenos Aires, Argentina and São Paulo, Brazil.
In Brazil, Japanese is mostly common in the states of São Paulo and Paraná.
Religion
The majority of residents are Roman Catholic, but there are Jewish and Protestants as well (mostly in Argentina and Chile). Religions include Islam, Anglicanism, Lutheranism, Eastern Orthodoxy, Buddhism, the Church of Jesus Christ of Latter-day Saints and Daoism. Jewish communities have thrived in cities of Argentina and Uruguay.
While the Southern Cone has been conservative in some aspects of religion, it has had a tradition of social reform and "liberation theology" has been followed by many in the Catholic Church. Uruguay, where agnosticism and atheism is common, has a policy of strong separation of church and state; it is one of the most secular countries in the Americas.[13] Uruguay, Argentina and Chile, in that order, have the least religious residents in South America, according to their responses about the significance of religion in their lives. According to a Gallup poll, 51% of Uruguayans, 56% of Argentines, and 60% of Chileans think of religion 'as something important in their lives,' contrasting with the higher values given by the residents of countries such as Brazil (87%), Bolivia (89%) and Paraguay (92%).
Countries
| Country | Area (km²)[14] |
Population (2020)[14] |
Population density (per km²) |
HDI (2019)[15] | Capital |
|---|---|---|---|---|---|
| 2,780,000 | 45,054,628 | 16.20 |
0,830 (very high) |
Buenos Aires | |
| 756,950 | 19,060,413 | 25.1 | 0.847 (very high) |
Santiago | |
| 176,215 | 3,424,595 | 19.43 | 0.808 (very high) |
Montevideo | |
| Total | 3,713,165 | 67,539,636 | 16.57 | (very high) |
Inclusion of other regions
Brazil
Brazil being a country of continental dimensions, it presents great internal regional differences.
While its 4 southernmost states (Paraná, Rio Grande do Sul, Santa Catarina and São Paulo) share the same characteristics with Argentina, Chile and Uruguay: high standard of living, subtropical and temperate climate, high levels of industrialization and strong European ethnic component due to immigration, the other states are more similar to the other South American countries in these issues.
For this reason, Brazil is included in some meanings when speaking in Southern Cone, but excluded in others.
When the definition is not limited to entire countries, the states of the South Region and the state of São Paulo are generally included.
| State | Area (km²)[14] |
Population (2017)[14] |
Population density (per km²) |
HDI (2017)[15] | Capital |
|---|---|---|---|---|---|
| 199,314 | 11,800,000 | 59.80 | 0.792 (high) |
Curitiba | |
| 291,748 | 11,286,500 | 39.10 | 0.787 (high) |
Porto Alegre | |
| 95,346 | 6,727,000 | 71.18 | 0.808 (very high) |
Florianópolis | |
| 248,222 | 45,595,497 | 95.83 | 0.826 (very high) |
São Paulo | |
| Total | 834,630 | 75,408,997 | 90.35 | 0.803 (very high) |
Paraguay
Due to the geographical proximity, common history, geography and political cycles, Paraguay is usually included in what is meant by Southern Cone. However, it contrasts strongly with other countries given the high level of poverty, low standard of living and low level of industrialization, and is therefore sometimes excluded from the definition.
Demography

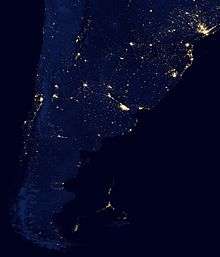
The population of Argentina, Chile and Uruguay is 40, 16.8 and 3.6 million respectively. Buenos Aires is the largest metropolitan area at 13.1 million and Santiago, Chile has 6.4 million. Uruguay's capital and largest city, Montevideo, has 1.8 million, and it receives many visitors on ferry boats across the Río de la Plata from Buenos Aires, 50 km (31 mi) away.
Ethnicity
The population of the Southern Cone has been strongly influenced by waves of immigration from Europe in the late nineteenth and early twentieth centuries. People of European descent, make up 85% of the total population of Argentina, 88% of total population of Uruguay and 53% of total population of Chile.[16][17][18][19] Mestizos make up 15.8% of the population and are a majority in Paraguay. Native Americans make up 3% of the population, mulattoes (people of European and African ancestry) mostly in Uruguay (0.2%), and Asians (1.0%), mostly in Argentina, the remaining 1.2%.[20]
Genetic and historical roots
Since interethnic marriages are widespread in Latin America, complex ethnic classifications emerged, including more than a dozen of "racial" categories created in 18th century Hispanic America, with notorious examples being castizo, morisco and cambujo. In Brazil, about 190 "racial" categories were detected by the Census of 1976.[21]
Blacks made up 25% of the population of Buenos Aires in 1810, 1822 and 1838. In 1887, the government decided to cease asking Argentine citizens about their race. According to Laura López, it was a way to "hide" the Black population, not only from the Census, but also from the public opinion.[22][23] Chile does not ask its citizens about race, but a study from the University of Chile concluded that Whites make 60% of the Chilean population,[24] while the CIA World Factbook described 88.4% of the population as white and mestizo.[25]
A study conducted on 218 individuals in 2010 by the Argentine geneticist Daniel Corach, has established that the genetic map of Argentina is composed by 79% from different European ethnicities (mainly Spanish and Italian ethnicities), 18% of different indigenous ethnicities, and 4.3% of African ethnic groups, in which 63.6% of the tested group had at least one ancestor who was Indigenous.[26][27] An autosomal DNA study from 2009 found the composition of the Argentine population to be 78,50% European, 17,30% Native American, and 4,20% Sub-Saharan African (SSA).[28]
A DNA study from 2009, published in the American Journal of Human Biology, showed the genetical composition of Uruguay to be mainly European, but with Native American (which varies from 1% to 20% in different parts of the country) and also SSA (7% to 15% in different parts of the country).[29]
An autosomal DNA study from 2014 found out Chile to be 44.34% (± 3.9%) Native American, 51.85% (± 5.44%) European and 3.81% (± 0.45%) African.[30][31]
In the case of Chile,"The use of mitochondrial DNA and Y chromosome" test results show the following: The European component is predominant (91.0%, versus 9.0% of the aboriginal one) in the Chilean upper class,[32] the middle classes, 66.8%-62.3% European component[32][33] and 37.7%-33.2 of mixed aboriginal[32][34] and lower classes at 55%-52.9% European component[32][33] and 47.1%-45% mix of Aboriginal.[32][33]
Similar to the rest of Latin America, the genetic ancestry of the population of the Southern Cone reflects the history of the continent: the Iberian colonizers were mostly men who arrived without women. In consequence, they had children with the local Indigenous or enslaved African women. A European immigration to this part of the World in the late 19th and early 20th centuries (massive in Argentina, Uruguay, Southern Chile, and south and southeastern Brazil, modest in elsewhere in Brazil, Central Chile and Paraguay)[17][35] [36] brought more European and northern Middle Eastern components to the local population – mainly Spaniards in Chile, Italians and Spaniards in Argentina and Uruguay, Italians in São Paulo, Italians, Germans and Poles in southern Brazil.[37] European immigration was encouraged by local governments, among other reasons, to "whiten" the local population, which reflected the scientific racism that considered the Amerindian and African elements "inferior", while the European element was seen as "superior".[38] As a consequence, the White phenotype came to dominate these areas that received larger numbers of European immigrants. But the predominantly non-white majority before the mass European immigration did not disappear, of course, but was largely assimilated into the white population.
Education and standards of living
The other conspicuous characteristic of the Southern Cone is its relatively high standard of living and quality of life. Argentina's, Chile's, and Uruguay's HDIs — (0.827), (0.847) and (0.804) — are the highest in Latin America, similar to the rich countries in Eastern Europe, such as Hungary, Croatia or Romania.[39] Uruguay, where illiteracy technically does not exist, reaches the same level in this area, even considering that it faces restrictions to its industrial and economic growth. The Southern Cone is the most prosperous macro-region in Latin America. It has high life expectancy, access to health care and education.[40] From an economic and liberal point of view the region has been praised for its significant participation in the global markets, and its "emerging economy" profile.[40] More troubling are high levels of income inequality.[41]
| Country | GDP per capita (PPP)[42] (2015 estimates) USD |
Income equality[43] (2015) Gini index |
Human Develop.[44] (2014 estimates) HDI |
Environmental Perform.[45] (2014) EPI | Failed States Index[46] 2014 | Lack of Corruption[47] 2014 | Economic Freedom 2015 | Peace 2014 | Democracy[48] 2010 |
|---|---|---|---|---|---|---|---|---|---|
| Southern Cone[note 3] | 22,493 | 45.2 | 0.820 (VH) | 57.7 | 42.4 | 60 | 1.648 | 7.60 | 7.84 |
| Mexico | 18,714 | 48.1 | 0.774 (H) | 55.0 | 71.1 | 35 | 66.4 | 2.500 | 6.91 |
| Brazil | 15,518 | 52.7 | 0.759 (H) | 52.9 | 64.8 | 43 | 56.6 | 2.073 | 7.12 |
| South America[note 4] | 11,955 | 47.5 | 0.715 (H) | 50.3 | 76.7 | 31 | 55.0 | 2.233 | 6.01 |
| Central America[note 5] | 10,502 | 49.7 | 0.678 (M) | 51.0 | 68.8 | 37 | 62.2 | 2.058 | 6.45 |
Southern Cone = ![]()
![]()
![]()
Mexico = ![]()
Brazil = ![]()
South America = ![]()
![]()
![]()
![]()
![]()
![]()
Central America = ![]()
![]()
![]()
![]()
![]()
![]()
Politics
During the second half of 20th century, these countries were in some periods ruled by right-wing juntas, military nationalistic dictatorships. Around the 1970s, these regimes collaborated in Plan Cóndor against leftist opposition, including urban guerrillas.[49] However, by the early 1980s Argentina and Uruguay restored their democracies; Chile followed suit in 1990.
Governments
Timeline of presidents

Notes
- Only Paraná, Rio Grande do Sul, Santa Catarina and São Paulo are sometimes included.
- Sometimes included.
- Excluding the Falkland Islands and South Georgia and the South Sandwich Islands.
- Excluding The Guianas and Bouvet Island.
- Excluding Belize and Clipperton Island.
References
- This North American density figure is based on a total land area of 4,944,081sq km
- Steven, F. (2001). Regional Integration and Democratic Consolidation in the Southern Cone of Latin America. Democratization. 14. Routledge. pp. 75–100. doi:10.1080/714000210. ISBN 978-950-738-053-2. Retrieved 12 May 2009.
- Krech III, Shepard; Merchant, Carolyn; McNeill, John Robert, eds. (2004). Encyclopedia of World Environmental History. 3: O–Z, Index. Routledge. pp. 1142–. ISBN 978-0-415-93735-1.
- "Servicio Meteorológico Nacional". smn.gov.ar.
- Lazcano, Luis. "Climatología". 164.77.222.61. Archived from the original on 2016-09-16. Retrieved 2015-05-25.
- WorldView Archived October 19, 2013, at the Wayback Machine, Gallup
- Colantoni, Laura; Gurlekian, Jorge (August 2004). "Convergence and intonation: historical evidence from Argentine Spanish". Bilingualism: Language and Cognition. 7 (2): 107–119. doi:10.1017/S1366728904001488.
- Colantoni, Laura; Gurlekian, Jorge (2004). "Convergence and intonation: historical evidence from Buenos Aires Spanish". Bilingualism: Language and Cognition. 7 (2): 107–119. doi:10.1017/S1366728904001488.
- "Official languages include indigenous" Archived 2012-02-20 at the Wayback Machine, IPS News
- "Hunsrückish". Ethnologue. Retrieved 20 July 2015.
- "Standard German". Ethnologue. Retrieved 20 July 2015.
- "Olivet Second Most Spoken Languages Around the World". olivet.edu. Retrieved 29 March 2016.
- Latin American Area Studies: Uruguay Archived 2010-07-14 at the Wayback Machine, University of Minnesota
- Land areas and population estimates are taken from The 2008 World Factbook which currently uses July 2008 data, unless otherwise noted.
- "2018 Human Development Report" (PDF). United Nations Development Programme. 2018. Retrieved 14 September 2018.
- Fernández, Francisco Lizcano (2007). Composición Étnica de las Tres Áreas Culturales del Continente Americano al Comienzo del Siglo XXI (in Spanish). ISBN 978-970-757-052-8.
- SOCIAL IDENTITY Marta Fierro Social Psychologist. Archived February 25, 2009, at the Wayback Machine
- (in Spanish) massive immigration of European Argentina Uruguay Chile Brazil
- Waiss, Óscar (1 January 1983). "La literatura hispanoamericana y el exilio" (PDF). Anales de Literatura Hispanoamericana. 12.
- Historia de las repúblicas de la Plata, Manuel González Llana
- Salzano, Francisco M. (1 September 2004). "Interethnic variability and admixture in Latin America - social implications". Revista de Biología Tropical. 52 (3): 405–415. doi:10.15517/rbt.v1i2.15273. PMID 17361535 – via SciELO.
- Clarin.com. "Negros en el país: censan cuántos hay y cómo viven".
- Cahoon, Ben. "Argentina". www.worldstatesmen.org.
- "5.2.6. Estructura racial". La Universidad de Chile. Archived from the original on 2007-10-16. Retrieved 2007-08-26. (Main page Archived 2009-09-16 at the Wayback Machine)
- "The World Factbook — Central Intelligence Agency". www.cia.gov.
- Corach, Daniel; Lao, Oscar; Bobillo, Cecilia; Van Der Gaag, Kristiaan; Zuniga, Sofia; Vermeulen, Mark; Van Duijn, Kate; Goedbloed, Miriam; Vallone, Peter M; Parson, Walther; De Knijff, Peter; Kayser, Manfred (2010). "Inferring Continental Ancestry of Argentineans from Autosomal, Y-Chromosomal and Mitochondrial DNA". Annals of Human Genetics. 74 (1): 65–76. doi:10.1111/j.1469-1809.2009.00556.x. PMID 20059473.
- Carnese, Francisco R.; Dejean, Cristina B.; Dugoujon, Jean M.; Rey, Jorge; Goicoechea, Alicia S.; Avena, Sergio A. (April 2006). "Medicina (B. Aires) vol.66 número2; Resumen: S0025-76802006000200004". Medicina (Buenos Aires). 66 (2): 113–118. Archived from the original on 19 July 2011.
- Corach Daniel (2010). "Inferring Continental Ancestry of Argentineans from Autosomal, Y-Chromosomal and Mitochondrial DNA". Annals of Human Genetics. 74 (1): 65–76. doi:10.1111/j.1469-1809.2009.00556.x. PMID 20059473.
- Bonilla, Carolina; Bertoni, Bernardo; González, Susana; Cardoso, Horacio; Brum-Zorrilla, Nadir; Sans, Mónica (1 May 2004). "Substantial native American female contribution to the population of Tacuarembó, Uruguay, reveals past episodes of sex-biased gene flow". American Journal of Human Biology. 16 (3): 289–297. doi:10.1002/ajhb.20025. PMID 15101054.
- Fuentes M, Pulgar I, Gallo C, Bortolini MC, Canizales-Quinteros S, Bedoya G, González-José R, Ruiz-Linares A, Rothhammer F (Mar 2014). "[Gene geography of Chile: regional distribution of American, European and African genetic contributions]". Rev Med Chil. 142 (3): 281–9. doi:10.4067/S0034-98872014000300001. PMID 25052264.
- "Gene geography of Chile" (PDF). scielo.conicyt.cl.
- Zemelman, Viviana; von Beck, Petra; Alvarado, Orlando; Valenzuela, Carlos Y. (2002). "El estrato socioeconómico alto se constituye mayoritariamente por una población caucásica y el estrato bajo por una mezcla de población caucásica 65% y amerindia 35% Revista médica de Chile". Revista Médica de Chile. 130 (8): 879–84. doi:10.4067/S0034-98872002000800006. PMID 12360796.
- Acuña, M.; Jorquera, H.; Cifuentes, L.; Armanet, L. (2002). "Frequency of the hypervariable DNA loci D18S849, D3S1744, D12S1090 and D1S80 in a mixed ancestry population of Chilean blood donors". Genetics and Molecular Research. 1 (2): 139–46. PMID 14963840.
- M. Acuña1, H. Jorquera, L. Cifuentes, and L. Armanet. "Frequency of the hypervariable DNA loci D18S849, D3S1744, D12S1090 and D1S80 in a mixed ancestry population of Chilean blood donors".CS1 maint: multiple names: authors list (link)
- Juan Bialet Massé en su informe sobre "El estado de las clases obreras en el interior del país" Archived September 27, 2011, at the Wayback Machine
- Caribe, Comisión Económica para América Latina y el (27 October 2014). "Etnicidad y ciudadanía en América Latina: la acción colectiva de los pueblos indígenas". www.cepal.org. Archived from the original on 2017-09-01. Retrieved 2016-05-06.
- "Demografia - Imigrações: 4. A imigração alemã - Passeiweb". www.passeiweb.com.
- RIBEIRO, Darcy. O Povo Brasileiro, Companhia de Bolso, fourth reprint, 2008 (2008).
- "- Human Development Reports" (PDF). hdr.undp.org.
- "Wayback Machine". 4 September 2006. Archived from the original on 4 September 2006.CS1 maint: BOT: original-url status unknown (link)
- Science, London School of Economics and Political. "Department of Economic History" (PDF).
- "World Economic Outlook Database". imf.org. International Monetary Fund. October 2014. Retrieved February 15, 2015.
- "UNDP".
- UNDP Human Development Report 2015 Update. "Table 1: Human Development Index Trends" (PDF). Retrieved 2015-12-15. page 25–26
- Yale Center for Environmental Law & Policy / Center for International Earth Science Information Network at Columbia University. "Environmental Performance Index 2014". Archived from the original on 2014-01-26. Retrieved 2015-02-15.
- "Failed States Index Scores 2014". The Fund for Peace. 2015-02-15. Archived from the original on February 15, 2015. Retrieved 2015-02-15.
- e.V., Transparency International. "How corrupt is your country?". www.transparency.org.
- "Democracy Index 2010" (PDF). Retrieved 2011-01-07.
- Victor Flores Olea. "Editoriales - El Universal - 10 de abril 2006 : Operacion Condor" (in Spanish). El Universal (Mexico). Archived from the original on 2007-06-28. Retrieved 2009-03-24.
External links
![]()