Semiconductor industry
The semiconductor industry is the aggregate collection of companies engaged in the design and fabrication of semiconductors. It formed around 1960, once the fabrication of semiconductor devices became a viable business. The industry's annual semiconductor sales revenue has since grown to over $481 billion, as of 2018.[1] The semiconductor industry is in turn the driving force behind the wider electronics industry,[2] with annual power electronics sales of £135 billion ($218 billion) as of 2011,[3] annual consumer electronics sales expected to reach $2.9 trillion by 2020,[4] tech industry sales expected to reach $5 trillion in 2019,[5] and e-commerce with over $29 trillion in 2017.[6]

| Semiconductor device fabrication |
|---|
 |
|
(process nodes) |
The most widely used semiconductor device is the MOSFET (metal-oxide-semiconductor field-effect transistor, or MOS transistor),[7] which was invented by Mohamed M. Atalla and Dawon Kahng at Bell Labs in 1959.[8][9] MOSFET scaling and miniaturization has been the primary factor behind the rapid exponential growth of semiconductor technology since the 1960s.[10][11] The MOSFET, which accounts for 99.9% of all transistors, is the driving force behind the semiconductor industry and the most widely manufactured device in history,[12][13] with an estimated total of 13 sextillion (1.3 × 10²²) MOSFETs having been manufactured between 1960 and 2018.[12]
Industry structure
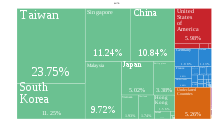
The global semiconductor industry is dominated by companies from the United States, Taiwan, South Korea, and the European Union.
Unique features of the industry include continuous growth but in a cyclical pattern with high volatility. While the current 20 year annual average growth of the semiconductor industry is on the order of 13%, this has been accompanied by equally above-average market volatility, which can lead to significant if not dramatic cyclical swings. This has required the need for high degrees of flexibility and innovation in order to constantly adjust to the rapid pace of change in the market as many products embedding semiconductor devices often have a very short life cycle.
At the same time, the rate of constant price-performance improvement in the semiconductor industry is staggering. As a consequence, changes in the semiconductor market not only occur extremely rapidly but also anticipate changes in industries evolving at a slower pace. The semiconductor industry is widely recognized as a key driver and technology enabler for the whole electronics value chain.[14]
Semiconductor sales
Sales revenue
|
|
Market share
| Semiconductor type | 2008 | 2005[21] | 2000[22] | 1995[21] | 1990[21] | 1987[23] | 1985[21] | 1982[23] | 1980[21] |
|---|---|---|---|---|---|---|---|---|---|
| Silicon MOSFET | >90% | 90% | 88% | 84% | 74% | 64% | 59% | 55% | 53% |
| III-V semiconductors | <7% | 4% | 4% | 2% | 1% | 1% | 1% | 1% | 1% |
| Silicon BJT | <3% | 6% | 8% | 14% | 25% | 35% | 40% | 44% | 46% |
| MOSFET fabrication process | 2003[23] | 2000[21] | 1990[21] | 1987[23] | 1985[21] | 1982[23] |
|---|---|---|---|---|---|---|
| CMOS | 99% | 99% | 88% | 61% | 47% | 22% |
| PMOS and NMOS | 1% | 1% | 12% | 39% | 53% | 78% |
| Industry sector | Market share |
|---|---|
| Computer and peripheral equipment | 32.3% |
| Consumer electronics | 21.2% |
| Telecommunications equipment | 16.5% |
| Industrial electronics | 14.3% |
| Defense and space industry | 11.5% |
| Transportation technology | 4.2% |
Largest companies
| Rank | 2018[24] | 2017[24] | 2011[25] | 2006[26] | 2000[26] | 1995[26] | 1992[27] | 1990[26] | 1986[28] | 1985[26] | 1975[28] |
|---|---|---|---|---|---|---|---|---|---|---|---|
| 1 | Samsung | Samsung | Intel | Intel | Intel | Intel | NEC | NEC | NEC | NEC | TI |
| 2 | Intel | Intel | Samsung | Samsung | Toshiba | NEC | Toshiba | Toshiba | Toshiba | TI | Motorola |
| 3 | SK Hynix | TSMC | TSMC | TI | NEC | Toshiba | Intel | Hitachi | Hitachi | Motorola | Philips |
| 4 | TSMC | SK Hynix | TI | Toshiba | Samsung | Hitachi | Motorola | Intel | ? | Hitachi | ? |
| 5 | Micron | Micron | Toshiba | ST | TI | Motorola | Hitachi | Motorola | ? | Toshiba | |
| 6 | Broadcom | Broadcom | Renesas | Renesas | Motorola | Samsung | TI | Fujitsu | ? | Fujitsu | |
| 7 | Qualcomm | Qualcomm | Qualcomm | Hynix | ST | TI | ? | Mitsubishi | ? | Philips | |
| 8 | Toshiba | TI | ST | Freescale | Hitachi | IBM | Mitsubishi | TI | ? | Intel | |
| 9 | TI | Toshiba | Hynix | NXP | Infineon | Mitsubishi | ? | Philips | ? | National | |
| 10 | Nvidia | Nvidia | Micron | NEC | Philips | Hyundai | ? | Matsushita | ? | Matsushita |
| Name | HQ country | Manufacturer type[29] | Hardware products |
|---|---|---|---|
| Samsung Electronics | South Korea | IDM | NAND flash memory, DRAM, CMOS sensor, RF transceivers, OLED display, SSD |
| Intel | USA | IDM | |
| TSMC | Taiwan | Pure-play | |
| SK Hynix[lower-alpha 1] | South Korea | IDM | |
| Micron[lower-alpha 2] | USA | IDM | DRAM, NAND flash, SSD, NOR flash, Managed NAND, multichip packages |
| Qualcomm | USA | Fabless | |
| Broadcom | USA | Fabless | |
| Toshiba | Japan | IDM | |
| Texas Instruments (TI) | USA | IDM | |
| Analog Devices | USA | IDM | Amplifiers, data converters, audio & video products, RF & microwave, sensors, MEMS |
| Microchip | USA | IDM | Microcontroller and analog semiconductors |
| NXP | Netherlands/USA | IDM | |
| MediaTek | Taiwan | Fabless | |
| Infineon | Germany | IDM | |
| STMicroelectronics | Switzerland | IDM | |
| Sony | Japan | IDM | |
| ARM | United Kingdom/USA | Fabless | |
| AMD | USA | Fabless | |
| Nvidia | USA | Fabless | |
| Renesas[lower-alpha 3] | Japan | IDM | |
| GlobalFoundries[lower-alpha 4] | USA | Pure-play | |
| ON Semiconductor | USA | IDM | |
| UMC | Taiwan | Pure-play | |
| Apple | USA | Fabless | |
| Fujitsu | Japan | IDM | |
| Hitachi | Japan | IDM | |
| IBM | USA | Fabless | |
| Mitsubishi Electric | Japan | IDM | |
| Panasonic | Japan | IDM | |
| Maxim Integrated | USA |
Notes:
- Pure-play foundries – They specialize in foundry services. They may or may not offer design services to third parties, as well as mask (photomask) making, semiconductor packaging and testing services, which can also be outsourced to other companies. An example is TSMC, which offers design, testing and packaging services, TCE phtomasks, which offers only mask making services, and ChipMOS, which offers only packaging and testing services.
- IDMs (integrated device manufacturers) – They may or may not offer foundry services.
- Fabless suppliers – They do not offer foundry services. They may or may not offer design services to third parties.
Device shipments
| Year | Optoelectronics | Sensor / Actuator | MOSFET[12] |
|---|---|---|---|
| 1960–2001 | ? | ? | 2,900,000,000,000,000 |
| 2002 | 23,164 | 1,654 | |
| 2003 | 28,955 | 2,482 | |
| 2004 | 38,056 | 3,310 | |
| 2005 | 44,675 | 4,137 | |
| 2006[31] | 55,429 | 4,137 | |
| 2007[32] | 67,839 | 4,136 | |
| 2008 | 76,939 | 4,964 | |
| 2009 | 91,003 | 4,964 | |
| 2010 | 97,622 | 6,619 | |
| 2011 | 110,031 | 8,273 | |
| 2012 | 129,886 | 11,583 | |
| 2013 | 131,541 | 14,064 | |
| 2014–2015 | ? | ? | 10,100,000,000,000,000 |
| 2016[33][34] | 217,200 | 17,376 | |
| 2017–2018 | ? | ? | |
| 1960–2018 | 1,112,340+ | 87,699+ | 13,000,000,000,000,000 |
Integrated circuits
| Year | MOS memory | MPU / MCU | Analog | Logic | ASIC | ASSP | Total |
|---|---|---|---|---|---|---|---|
| 1960–1991 | ? | 15,000[35] | ? | ? | ? | ? | 350,000[35] |
| 1992[36] | 3,706 | ||||||
| 1993[36] | 4,060 | ||||||
| 1994[36] | 4,938 | ||||||
| 1995[36] | 6,092 | ||||||
| 1996[36] | 6,206 | ||||||
| 1997 | 7,155[37] | ? | ? | ? | ? | ? | 60,100[32] |
| 1998–1999 | ? | ? | ? | ? | ? | ? | ? |
| 2000[38] | ? | ? | ? | ? | ? | ? | 89,100 |
| 2001 | ? | ? | ? | ? | ? | ? | ? |
| 2002 | 9,100 | 6,619 | 24,819 | 11,582 | 2,482 | 23,992 | 78,594 |
| 2003 | 10,755 | 6,618 | 30,611 | 14,064 | 1,655 | 25,646 | 89,349 |
| 2004 | 13,237 | 9,100 | 33,092 | 14,064 | 1,654 | 33,092 | 104,239 |
| 2005 | 15,719 | 8,273 | 37,229 | 14,891 | 2,481 | 38,056 | 116,649 |
| 2006[31] | 18,201 | 10,755 | 43,020 | 18,200 | 2,482 | 45,501 | 141,600 |
| 2007[32] | 23,992 | 12,409 | 48,811 | 18,201 | 3,309 | 45,502 | 156,000 |
| 2008 | 25,646 | 12,410 | 49,639 | 18,200 | 1,655 | 47,156 | 154,706 |
| 2009 | 28,128 | 11,582 | 43,020 | 14,892 | 2,482 | 43,847 | 143,951 |
| 2010[38] | 33,919 | 16,546 | 57,084 | 19,028 | 1,654 | 57,911 | 189,800 |
| 2011 | 33,919 | 17,374 | 56,256 | 19,028 | 1,655 | 58,738 | 186,970 |
| 2012 | 34,747 | 17,373 | 57,084 | 17,373 | 1,655 | 57,083 | 185,315 |
| 2013 | 33,919 | 16,546 | 67,839 | 18,201 | 2,481 | 64,530 | 203,516 |
| 2014 | ? | 18,600[39] | ? | ? | ? | ? | ? |
| 2015 | ? | 22,058[40] | ? | ? | ? | ? | 235,600[38] |
| 2016[33][34] | 43,440 | 21,174[40] | 130,320 | 52,128 | ? | ? | 342,416 |
| 2017 | ? | 25,797[40] | ? | ? | ? | ? | 581,321[41] |
| 2018 | ? | ? | ? | ? | ? | ? | 634,700[41] |
| 1960–2018 | 356,879+ | 274,298+ | 635,804+ | 249,852+ | 25,645+ | 541,054+ | 4,043,926+ |
Discrete devices
| Year | Discrete transistors | Diode | Total | ||
|---|---|---|---|---|---|
| Power | Small-signal | Total | |||
| 1954–1956[43] | ? | ? | 28 | ? | 28+ |
| 1957[43] | ? | ? | 30 | ? | 30+ |
| 1958–1962 | ? | ? | ? | ? | ? |
| 1963[43] | ? | ? | 303 | ? | 303+ |
| 1964–1965 | ? | ? | ? | ? | ? |
| 1966[44] | ? | ? | 968 | ? | 968+ |
| 1967[44] | ? | ? | 881 | ? | 881+ |
| 1968[44] | ? | ? | 997 | ? | 997+ |
| 1969[43] | ? | ? | 1,249 | ? | 1,249+ |
| 1970[44] | ? | ? | 914 | ? | 914+ |
| 1971[43] | ? | ? | 881 | ? | 881+ |
| 1972–2001 | ? | ? | ? | ? | ? |
| 2002 | ? | ? | ? | ? | 232,472 |
| 2003 | ? | ? | ? | ? | 245,708 |
| 2004 | ? | ? | ? | ? | 287,901 |
| 2005 | ? | ? | ? | ? | 290,382 |
| 2006[31] | ? | ? | ? | ? | 321,820 |
| 2007[32] | ? | ? | ? | ? | 356,566 |
| 2008 | ? | ? | ? | ? | 324,301 |
| 2009 | ? | ? | ? | ? | 289,555 |
| 2010 | 53,000[45] | ? | 53,000+ | ? | 371,458 |
| 2011 | 45,000 | 110,000 | 155,000 | 143,000 | 356,000 |
| 2012 | ? | ? | ? | ? | 345,812 |
| 2013 | 44,000 | 103,000 | 147,000 | 146,000 | 358,000 |
| 2014 | 48,000 | 109,000 | 157,000 | 154,000 | 380,000 |
| 2015[38] | 52,000 | 107,000 | 159,000 | 150,000 | 372,000 |
| 2016[33] | 53,300 | ? | 53,300+ | ? | 382,272 |
| 2017 | 58,100 | ? | 58,100+ | ? | 58,100+ |
| 2018 | 62,800 | ? | 62,800+ | ? | 62,800+ |
| 1954–2018 | 416,200+ | 429,000+ | 851,451+ | 593,000+ | 5,041,398+ |
Regions
Sales
Manufacturers headquartered in the following regions are the sales leaders in the pure-play foundry, IDM (integrated device manufacturing), fabless manufacturing and OSAT (outsourced semiconductor assembly and testing) sectors of the industry.[29]
| Rank | Foundry | IDM | Fabless | OSAT |
|---|---|---|---|---|
| 1 | Taiwan | United States | United States | Taiwan |
| 2 | United States | South Korea | Taiwan | United States |
| 3 | China | Japan | China | China |
| 4 | Israel | European Union | European Union | Singapore |
| 5 | South Korea | Taiwan | Japan | Japan |
Note that manufacturers headquartered in the United States have fabrication plants across the world, including over 50% in the Americas, 39% in the Asia-Pacific region (including 9% in Japan), and 9% in Europe.[29]
Patents
Patent holders from the following countries produced the highest number of annual semiconductor patents worldwide, as of 2005.[46]
| Rank | Country | Patents (est.) |
|---|---|---|
| 1 | Japan | 30,500 |
| 2 | South Korea | 13,500 |
| 3 | United States | 9,500 |
| 4 | Taiwan | 4,000 |
| 5 | China | 3,500 |
| 6 | Germany | 2,500 |
See also
Notes
- Formerly Hyundai Electronics.
- Acquired Elpida Memory and Powerchip.
- Formerly NEC Electronics.
- Acquired Chartered Semiconductor Manufacturing.
References
- "Semiconductors – the Next Wave" (PDF). Deloitte. April 2019. Retrieved 11 October 2019.
- "Annual Semiconductor Sales Increase 21.6 Percent, Top $400 Billion for First Time". Semiconductor Industry Association. 5 February 2018. Retrieved 11 October 2019.
- "Power Electronics: A Strategy for Success" (PDF). Government of the United Kingdom. Department for Business, Innovation and Skills. October 2011. Retrieved 11 October 2019.
- "Global Consumer Electronics Market to Reach US$ 2.9 Trillion by 2020 - Persistence Market Research". PR Newswire. Persistence Market Research. 3 January 2017. Retrieved 11 October 2019.
- "IT Industry Outlook 2019". CompTIA. January 2019. Retrieved 11 October 2019.
- "Global e-Commerce sales surged to $29 trillion". United Nations Conference on Trade and Development. 29 March 2019. Retrieved 13 October 2019.
- Golio, Mike; Golio, Janet (2018). RF and Microwave Passive and Active Technologies. CRC Press. p. 18–2. ISBN 9781420006728.
- "1960 - Metal Oxide Semiconductor (MOS) Transistor Demonstrated". The Silicon Engine. Computer History Museum.
- "Who Invented the Transistor?". Computer History Museum. 4 December 2013. Retrieved 20 July 2019.
- Lamba, V.; Engles, D.; Malik, S. S.; Verma, M. (2009). "Quantum transport in silicon double-gate MOSFET". 2009 2nd International Workshop on Electron Devices and Semiconductor Technology: 1–4. doi:10.1109/EDST.2009.5166116.
- Gilder, George (1990). Microcosm: The Quantum Revolution In Economics And Technology. Simon and Schuster. pp. 88-9. ISBN 9780671705923.
- "13 Sextillion & Counting: The Long & Winding Road to the Most Frequently Manufactured Human Artifact in History". Computer History Museum. April 2, 2018. Retrieved 28 July 2019.
- Baker, R. Jacob (2011). CMOS: Circuit Design, Layout, and Simulation. John Wiley & Sons. p. 7. ISBN 978-1118038239.
- Staff, ReportLinker. “Global Semiconductor Market Outlook 2022.” January 13, 2016. February 19, 2016.
- "Semiconductor sales revenue worldwide from 1987 to 2020 (in billion U.S. dollars)". Statista. July 4, 2019. Retrieved 11 October 2019.
- "Global Chip Sales Hit $255.6 Billion in 2007". Semiconductor Industry Association. 1 February 2008. Retrieved 11 October 2019.
- "Annual Semiconductor Sales Increase 21.6 Percent, Top $400 Billion for First Time". Semiconductor Industry Association. 5 February 2018. Retrieved 29 July 2019.
- "Global Power Semiconductor Market 2017-2018 to 2023: Analysis by Material, Component, Industry and Region". Business Wire. Research and Markets. 2 October 2018. Retrieved 11 October 2019.
- Woodall, Jerry M. (2010). "Non-Silicon MOSFET Technology: A Long Time Coming". Fundamentals of III-V Semiconductor MOSFETs. Springer Science & Business Media. p. 1. ISBN 9781441915474.
- "Power Transistors to Hit Another Sales Record After Growth Bubble Ends". IC Insights. May 14, 2019. Retrieved 11 October 2019.
- Schwierz, Frank; Wong, Hei; Liou, Juin J. (2010). Nanometer CMOS. Pan Stanford Publishing. p. 6. ISBN 9789814241083.
- Asthana, Rajiv; Kumar, Ashok; Dahotre, Narendra B. (2006). Materials Processing and Manufacturing Science. Elsevier. p. 488. ISBN 9780080464886.
- Veendrick, Harry (2000). "Preface to First and Second Edition". Deep-Submicron CMOS ICs: From Basics to ASICs (PDF) (2nd ed.). Kluwer Academic Publishers. ISBN 9044001116.
- Manners, David (14 November 2018). "Top Ten (+5) Semiconductor Companies 2018". Electronics Weekly. Retrieved 15 June 2019.
- "Top 25 2011 Semiconductor Sales Ranking". IC Insights. April 5, 2012. Retrieved 9 July 2019.
- "Tracking the Top 10 Semiconductor Sales Leaders Over 26 Years". Semiconductor Market Research. IC Insights. December 12, 2011.
- "WORLDWIDE IC MANUFACTURERS" (PDF). Smithsonian Institution. 1997. Retrieved 10 July 2019.
- "1980s Trends in the Semiconductor Industry". Semiconductor History Museum of Japan. Retrieved 10 July 2019.
- "BEYOND BORDERS: THE GLOBAL SEMICONDUCTOR VALUE CHAIN" (PDF). Semiconductor Industry Association. May 2016. Retrieved 10 July 2019.
- Bahai, Ahmed (2015). "Innovation in Power Electronics" (PDF). SEMICON West. Texas Instruments. Retrieved 23 October 2019.
- "Semiconductor Unit Shipments To Exceed One Trillion Devices in 2016". IC Insights. February 18, 2014. Retrieved 15 October 2019.
- "Semiconductor Unit Shipments To Exceed One Trillion Devices in 2017". IC Insights. February 17, 2015. Retrieved 15 October 2019.
- Manners, David (10 March 2017). "Semi units to hit a trillion next year". Electronics Weekly. Retrieved 15 October 2019.
- "Research Report on China Integrated Circuit Industry, 2018-2022: In 2017, Sales Value of Local IC Companies Reached Approximately USD 80.15 Billion". GlobeNewswire. 8 May 2018. Retrieved 15 October 2019.
- Port, Otis (9 December 1996). "The Silicon Age? It's Just Dawning". Bloomberg News. Retrieved 15 October 2019.
- "The MOS Memory Market" (PDF). Integrated Circuit Engineering Corporation. Smithsonian Institution. 1997. p. 1-7. Retrieved 16 October 2019.
- "MOS Memory Market Trends" (PDF). Integrated Circuit Engineering Corporation. Smithsonian Institution. 1998. Retrieved 16 October 2019.
- McGrath, Dylan (8 March 2016). "Semiconductor Shipments to Top 1 Trillion Units in 2018". EE Times. Retrieved 15 October 2019.
- Roos, Gina (4 February 2015). "Microcontroller Market Continues to Strengthen". EPS News. Retrieved 26 October 2019.
- "Microcontroller sales set to soar, says IC Insights". Eectronic Specifier. 13 September 2018. Retrieved 29 October 2019.
- "Global and China $578 Bn Integrated Circuit Industries Markets, 2014-2018 & 2019-2023". PR Newswire. Research and Markets. June 5, 2019. Retrieved 24 October 2019.
- "Global discrete semiconductor shipments by type 2011-2020". Statista. Retrieved 15 October 2019.
- Butrica, Andrew J. (2015). "Chapter 3: NASA's Role in the Manufacture of Integrated Circuits". In Dick, Steven J. (ed.). Historical Studies in the Societal Impact of Spaceflight (PDF). NASA. pp. 149–250. ISBN 978-1-62683-027-1.
- Electronic receiving tubes and transistors production and maintenance workers at RCA Corporation plant. United States Tariff Commission. 1971. p. A-15.
- Clarke, Peter (June 24, 2011). "Power transistor market set to grow 9% in 2011". EE Times. Retrieved 29 October 2019.
- "World Intellectual Property Report" (PDF). World Intellectual Property Organization. 2015. p. 78. Retrieved 8 July 2019.