Rose (mathematics)
In mathematics, a rose or rhodonea curve is a sinusoid plotted in polar coordinates.

General overview
Up to similarity, these curves can all be expressed by a polar equation of the form

or, alternatively, as a pair of Cartesian parametric equations of the form


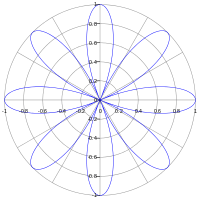
If k is an integer, the curve will be rose-shaped with
- 2k petals if k is even, and
- k petals if k is odd.
When k is even, the entire graph of the rose will be traced out exactly once when the value of theta, θ, changes from 0 to 2. When k is odd, this will happen on the interval between 0 and . (More generally, this will happen on any interval of length 2 for k even, and for k odd.)

If k is a half-integer (e.g. 1/2, 3/2, 5/2), the curve will be rose-shaped with 4k petals. Example: n=7, d=2, k= n/d = 3.5, as θ changes from 0 to 4.
If k can be expressed as n ± 1/6, where n is a nonzero integer, the curve will be rose-shaped with 12k petals.
If k can be expressed as n/3, where n is an integer not divisible by 3, the curve will be rose-shaped with n petals if n is odd and 2n petals if n is even.
If k is rational, then the curve is closed and has finite length. If k is irrational, then it is not closed and has infinite length. Furthermore, the graph of the rose in this case forms a dense set (i.e., it comes arbitrarily close to every point in the unit disk).
Since

for all , the curves given by the polar equations

- and


are identical except for a rotation of /2k radians.
Rhodonea curves were named by the Italian mathematician Guido Grandi between the year 1723 and 1728.[2]
Area
A rose whose polar equation is of the form

where k is a positive integer, has area

if k is even, and

if k is odd.
The same applies to roses with polar equations of the form

since the graphs of these are just rigid rotations of the roses defined using the cosine.
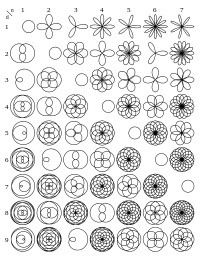
How the parameter k affects shapes
In the form k = n, for integer n, the shape will appear similar to a flower. If n is odd, half of these will overlap, forming a flower with n petals. However, if n is even, the petals will not overlap, forming a flower with 2n petals.
When d is a prime number, then n/d is a least common form and the petals will stretch around to overlap other petals. The number of petals each one overlaps is equal to the how far through the sequence of primes this prime is + 1, i.e. 2 is 2, 3 is 3, 5 is 4, 7 is 5, etc.
In the form k = 1/d when d is even, it will appear as a series of d/2 loops that meet at 2 small loops at the center touching (0, 0) from the vertical and is symmetrical about the x-axis. If d is odd, then it will have d/2 loops that meet at a small loop at the center from either the left (when in the form d = 4n − 1) or the right (d = 4n + 1).
If d is not prime and n is not 1, then it will appear as a series of interlocking loops.
If k is an irrational number (e.g. , , etc.) then the curve will have infinitely many petals, and it will be dense in the unit disc.


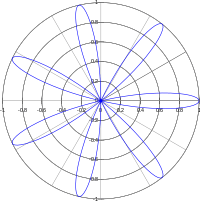
Offset parameter
Adding an offset parameter c, so the polar equation becomes

alters the shape as illustrated at right. In the case where the parameter k is an odd integer, the two overlapping halves of the curve separate as the offset changes from zero.
Programming
k <- 4
t <- seq(0, 4*pi, length.out=500)
x <- cos(k*t)*cos(t)
y <- cos(k*t)*sin(t)
plot(x,y, type="l", col="blue")
MATLAB and OCTAVE
function rose(del_theta, k, amplitude)
% inputs:
%   del_theta = del_theta is the discrete step size for discretizing the continuous range of angles from 0 to 2*pi
%   k = petal coefficient
%      if k is odd then k is the number of petals
%      if k is even then k is half the number of petals
%   amplitude = length of each petal
% outputs:
%   a 2D plot from calling this function illustrates an example of trigonometry and 2D Cartesian plotting
theta = 0:del_theta:2*pi;
x = amplitude*cos(k*theta).*cos(theta);
y = amplitude*cos(k*theta).*sin(theta);
plot(x,y)
See also
- Lissajous curve
- quadrifolium – a rose curve where k = 2.
- Maurer rose
- Rose (topology)
- Spirograph
Notes
- Mathematical Models by H. Martyn Cundy and A.P. Rollett, second edition, 1961 (Oxford University Press), p. 73.
- O'Connor, John J.; Robertson, Edmund F., "Rhodonea", MacTutor History of Mathematics archive, University of St Andrews.
External links
| Wikimedia Commons has media related to Rose curves. |