Results of the 2016 Australian federal election in territories
Australian Capital Territory
| ||||||||||||||||||||||||||||
All 2 Australian Capital Territory seats in the Australian House of Representatives and all 2 seats in the Australian Senate | ||||||||||||||||||||||||||||
|---|---|---|---|---|---|---|---|---|---|---|---|---|---|---|---|---|---|---|---|---|---|---|---|---|---|---|---|---|
| ||||||||||||||||||||||||||||
 | ||||||||||||||||||||||||||||
.jpg)
2016 Australian federal election |
|---|
|
| National results |
| State and territory results |
|
|
This is a list of electoral division results for the 2016 Australian federal election in the Australian Capital Territory.
Overall results
| Party | Votes | % | Swing | Seats | Change | |||
|---|---|---|---|---|---|---|---|---|
| Australian Labor Party | 111,887 | 44.27 | +1.34 | 2 | 0 | |||
| Liberal Party of Australia | 87,346 | 34.56 | –0.06 | 0 | 0 | |||
| Australian Greens | 38,129 | 15.09 | +1.69 | 0 | 0 | |||
| Bullet Train for Australia | 10,673 | 4.22 | +0.14 | 0 | 0 | |||
| Independent | 4,707 | 1.86 | +1.86 | 0 | 0 | |||
| Total | 252,742 | 2 | ||||||
| Two-party-preferred vote | ||||||||
| Australian Labor Party | 154,489 | 61.13 | +1.22 | 2 | 0 | |||
| Liberal Party of Australia | 98,253 | 38.87 | −1.22 | 0 | 0 | |||
Results by division
Canberra
| Party | Candidate | Votes | % | ± | |
|---|---|---|---|---|---|
| Labor | Gai Brodtmann | 55,091 | 42.80 | +1.65 | |
| Liberal | Jessica Adelan-Langford | 48,416 | 37.61 | +0.28 | |
| Greens | Patricia Cahill | 19,200 | 14.92 | +1.86 | |
| Bullet Train | Christopher Bucknell | 6,013 | 4.67 | +0.51 | |
| Total formal votes | 128,720 | 97.29 | +1.14 | ||
| Informal votes | 3,590 | 2.71 | −1.14 | ||
| Turnout | 132,310 | 92.38 | −4.08 | ||
| Two-party-preferred result | |||||
| Labor | Gai Brodtmann | 75,247 | 58.46 | +0.95 | |
| Liberal | Jessica Adelan-Langford | 53,473 | 41.54 | −0.95 | |
| Labor hold | Swing | +0.95 | |||
Fenner
| Party | Candidate | Votes | % | ± | |
|---|---|---|---|---|---|
| Labor | Andrew Leigh | 56,796 | 45.80 | +0.96 | |
| Liberal | Robert Gunning | 38,930 | 31.39 | −0.33 | |
| Greens | Carly Saeedi | 18,929 | 15.26 | +1.50 | |
| Independent | Andrew Woodman | 4,707 | 3.80 | +3.80 | |
| Bullet Train | Tim Bohm | 4,660 | 3.76 | −0.24 | |
| Total formal votes | 124,022 | 97.18 | +0.99 | ||
| Informal votes | 3,595 | 2.82 | −0.99 | ||
| Turnout | 127,617 | 91.93 | −0.88 | ||
| Two-party-preferred result | |||||
| Labor | Andrew Leigh | 79,242 | 63.89 | +1.40 | |
| Liberal | Robert Gunning | 44,780 | 36.11 | −1.40 | |
| Labor hold | Swing | +1.40 | |||
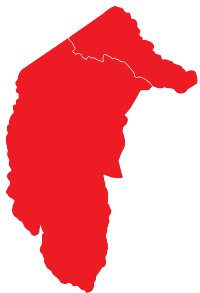
Northern Territory
| ||||||||||||||||||||||||||||
All 2 Northern Territory seats in the Australian House of Representatives and all 2 seats in the Australian Senate | ||||||||||||||||||||||||||||
|---|---|---|---|---|---|---|---|---|---|---|---|---|---|---|---|---|---|---|---|---|---|---|---|---|---|---|---|---|
| ||||||||||||||||||||||||||||
 Electorate Results (%) | ||||||||||||||||||||||||||||
This is a list of electoral division results for the 2016 Australian federal election in the Northern Territory.
Overall results
| Party | Votes | % | Swing | Seats | Change | |||
|---|---|---|---|---|---|---|---|---|
| Australian Labor Party | 39,364 | 40.39 | +2.96 | 2 | +1 | |||
| Country Liberal Party | 32,409 | 33.25 | –8.45 | 0 | −1 | |||
| Australian Greens | 8,858 | 9.09 | +1.20 | 0 | 0 | |||
| Shooters, Fishers and Farmers Party | 4,584 | 4.70 | +4.70 | 0 | 0 | |||
| Rise Up Australia Party | 2,483 | 2.55 | +1.10 | 0 | 0 | |||
| Liberal Democratic Party | 1,275 | 1.31 | +1.31 | 0 | 0 | |||
| Help End Marijuana Prohibition (HEMP) Party | 1,143 | 1.17 | +1.17 | 0 | 0 | |||
| Australia First Party | 798 | 0.82 | +0.82 | 0 | 0 | |||
| Citizens Electoral Council | 444 | 0.46 | −1.41 | 0 | 0 | |||
| Online Direct Democracy | 369 | 0.38 | +0.38 | 0 | 0 | |||
| Independent | 5,733 | 5.88 | +5.13 | 0 | 0 | |||
| Total | 97,460 | 2 | ||||||
| Two-party-preferred vote | ||||||||
| Australian Labor Party | 55,614 | 57.06 | +7.41 | 2 | +1 | |||
| Country Liberal Party | 41,846 | 42.94 | −7.41 | 0 | −1 | |||
Country Liberal to Labor: Solomon
Results by division
Lingiari
| Party | Candidate | Votes | % | ± | |
|---|---|---|---|---|---|
| Labor | Warren Snowdon | 17,056 | 39.78 | +0.03 | |
| Country Liberal | Tina MacFarlane | 13,605 | 31.73 | −6.50 | |
| Greens | Rob Hoad | 3,305 | 7.71 | −0.05 | |
| Shooters, Fishers and Farmers | Chris Righton | 3,061 | 7.14 | +7.14 | |
| Independent | Yingiya Mark Guyula | 1,854 | 4.32 | +4.32 | |
| Independent | Braedon Earley | 1,808 | 4.22 | +4.22 | |
| Rise Up Australia | Regina McCarthy | 1,498 | 3.49 | +1.50 | |
| Independent | Alfred Gould | 427 | 1.00 | −0.63 | |
| CEC | Peter Flynn | 261 | 0.61 | −2.95 | |
| Total formal votes | 42,875 | 92.15 | −0.42 | ||
| Informal votes | 3,650 | 7.85 | +0.42 | ||
| Turnout | 46,525 | 73.70 | −1.72 | ||
| Two-party-preferred result | |||||
| Labor | Warren Snowdon | 25,048 | 58.42 | +7.54 | |
| Country Liberal | Tina MacFarlane | 17,827 | 41.58 | −7.54 | |
| Labor hold | Swing | +7.54 | |||
Solomon
| Party | Candidate | Votes | % | ± | |
|---|---|---|---|---|---|
| Labor | Luke Gosling | 22,308 | 40.87 | +5.44 | |
| Country Liberal | Natasha Griggs | 18,804 | 34.45 | −10.24 | |
| Greens | Todd Williams | 5,553 | 10.17 | +2.18 | |
| Independent | Mark Garner | 1,644 | 3.01 | +3.01 | |
| Shooters, Fishers and Farmers | Marty Reinhold | 1,523 | 2.79 | +2.79 | |
| Liberal Democrats | Robert Dawes | 1,275 | 2.34 | +2.34 | |
| HEMP | Lance Lawrence | 1,143 | 2.09 | +2.09 | |
| Rise Up Australia | Silvija Majetic | 985 | 1.80 | +0.81 | |
| Australia First | John Kearney | 798 | 1.46 | +1.46 | |
| Online Direct Democracy | Nevin Cartwright | 369 | 0.68 | +0.68 | |
| CEC | Brigid McCullough | 183 | 0.34 | −0.07 | |
| Total formal votes | 54,585 | 93.05 | −1.65 | ||
| Informal votes | 4,080 | 6.95 | +1.65 | ||
| Turnout | 58,665 | 83.81 | −5.50 | ||
| Two-party-preferred result | |||||
| Labor | Luke Gosling | 30,566 | 56.00 | +7.40 | |
| Country Liberal | Natasha Griggs | 24,019 | 44.00 | −7.40 | |
| Labor gain from Country Liberal | Swing | +7.40 | |||
References
- Canberra, ACT, Virtual Tally Room 2016, Australian Electoral Commission.
- Fenner, ACT, Virtual Tally Room 2016, Australian Electoral Commission.
- Lingiari, NT, Virtual Tally Room 2016, Australian Electoral Commission.
- Solomon, NT, Virtual Tally Room 2016, Australian Electoral Commission.
| ||
| Campaign |  | |
| Results | ||
This article is issued from Wikipedia. The text is licensed under Creative Commons - Attribution - Sharealike. Additional terms may apply for the media files.