Renewable energy in the European Union
Renewable energy plays an important and growing role in the energy system of the European Union. The share of energy from renewable sources in gross final consumption of energy was 18% in 2018. This is double the share in 2004 with 8.5%.[1] The Europe 2020 strategy includes a target of reaching 20% of gross final energy consumption from renewable sources by 2020, and at least 32% by 2030.[1] These figures are based on energy use in all its forms across all three main sectors, the heating and cooling sector, the electricity sector and the transport sector.
|
n.a.
<5%
5–10% |
10–20%
20–30%
30–40% |
40–50%
50–60%
>60% |
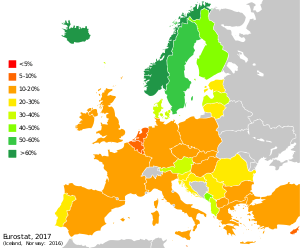
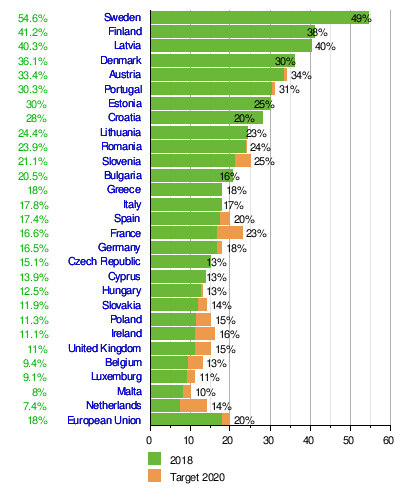
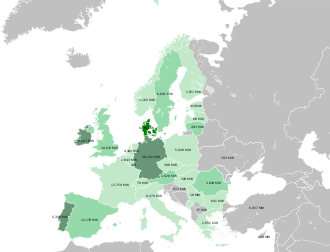
The share of renewable sources in gross final consumption of energy has grown in all member states since 2004. The leading state was Sweden with over half (54.6%) of its energy provided by renewable sources in 2018 in terms of gross final energy consumption, followed by Finland (41.2%), Latvia (40.3%), Denmark (36.1%) and Austria (33.4%).[1] The lowest proportion of renewables in 2018 was recorded in the Netherlands (7.4%), Malta (8.0%), Luxembourg (9.1%) and Belgium (9.4%).[1]
The renewable energy directive enacted in 2009 lays out a framework for individual member states to share the overall EU-wide 20% renewable energy target for 2020.[2] Promoting the use of renewable energy sources is important both to the reduction of the EU's energy dependence and in meeting targets to combat global warming. The directive sets targets for each individual member state taking into account the different starting points and potentials.[2] Targets for renewable energy use by 2020 among different member states varies from 10% to 49%.[2] As of year end 2018, 12 EU member states had already met their national 2020 targets, two years ahead of schedule.[1]
Policy
 |
%2C_GWh%2C_1990-2013.png)
The Maastricht Treaty signed in 1992 set an objective of promoting stable growth while protecting the environment. The Amsterdam Treaty of 1997 added the principle of sustainable development to the objectives of the EU. Since 1997, the EU has been working towards a renewable energy supply equivalent to 12% of the total EU's energy consumption by 2010.
The Johannesburg Summit in 2002 failed to introduce the radical changes targeted for ten years after the Rio Summit. No specific goals were set for the energy sector, which disappointed many countries. While the EU had proposed an annual increase in the use of renewable energy at a rate of 1.5% worldwide until 2010, Johannesburg's action plan did not recommend such a "substantial" increase, with no concrete goals nor dates being set. The EU was unwilling to accept this result and with other nations formed a group of "pioneer countries" that promised to establish ambitious national or even regional goals to achieve global targets. The Johannesburg Renewable Energy Coalition (JREC) has a total of more than 80 member countries; the EU members, Brazil, South Africa and New Zealand amongst them.
In the European Conference for Renewable Energy in Berlin in 2004, the EU defined ambitious goals of its own. The conclusion was that by 2020, the EU would seek to obtain 20% of its total energy consumption requirements with renewable energy sources. Up until that point, the EU had only set targets up to 2010, and this proposal was the first to represent the EU's commitment up to 2020.
Renewable energy directives and targets
In 2009 the Renewables Directive set binding targets for all EU Member States, such that the EU will reach a 20% share of energy from renewable sources by 2020 and a 10% share of renewable energy specifically in the transport sector. By 2014 the EU realized a 16% share of energy from renewable sources with nine member states already achieving their 2020 goals. By 2018 this had risen to 18% with twelve member states meeting their 2020 targets early.
Article 4 of the Renewables Directive required Member States to submit National Renewable Energy Action Plans by 30 June 2010. These plans, to be prepared in accordance with the template published by the Commission, provide detailed roadmaps of how each Member State expects to reach its legally binding 2020 target for the share of renewable energy in their final energy consumption. Member States must set out the sectoral targets, the technology mix they expect to use, the trajectory they will follow and the measures and reforms they will undertake to overcome the barriers to developing renewable energy. The plans are published by the EC upon receipt in the original language, allowing public scrutiny. The Commission will evaluate them, assessing their completeness and credibility. In parallel, the plans will be translated into English. In addition, the Energy Research Centre of the Netherlands was contracted by the European Environment Agency to create an external database and quantitative report of the reports received so far.
In 2014, negotiations about EU energy and climate targets until 2030 were initiated. Whilst seven Central and Eastern European member states had already met their 2020 targets by 2016 (amongst the eleven EU wide), a small number of others are likely to attempt to slow down the transformation process.[4][5] The key parts of the European renewable energy targets agreement set in 2014 are as proposed by a Shell lobbyist in October 2011. Shell is the sixth biggest lobbyist in Brussels, spending between €4.25-4.5m a year lobbying the EU institutions. Agreement has no binding targets for member states on energy efficiency or renewable energy.[6]
On 30 November 2016, the Commission presented a proposal for a revised Renewable Energy Directive to ensure that the target of at least 27% renewables in the final energy consumption in the EU by 2030 is met and to ensure that the EU is a global leader in renewable energy.[7]
Links to climate policy
Underlying many of the EU's energy policy proposals is the goal to limit global temperature changes to no more than 2 °C above pre-industrial levels,[8] of which 0.8 °C has already taken place and another 0.5–0.7 °C (for total warming of 1.3-1.5 °C) is already committed.[9] 2 °C is usually seen as the upper temperature limit to avoid 'dangerous global warming'.[10] However some scientists, such as Kevin Anderson,[11] professor of energy and climate change in the School of Mechanical, Aeronautical and Civil Engineering at the University of Manchester and former director of the Tyndall Centre, the UK's leading academic climate change research organisation, have argued that to be consistent with the science, 1 °C is a more accurate threshold for "dangerous" climate change.[12][13]
Initiatives
Specific EU renewable energy and energy efficiency initiatives includes:
- BUILD UP
- The Covenant of Mayors is a cooperative network of mayors and local authorities working to implement energy initiatives.
- Sustainable Energy Europe Campaign
- CONCERTO
- ManagEnergy
- Intelligent Energy – Europe (IEE)
- U4energy is an initiative funded under the IEE programme to improve energy consumption in schools and their local communities.
- Eco-innovation
Member states
France
In July 2015, the French parliament passed a comprehensive energy and climate law that includes a mandatory renewable energy target requiring 40% of national electricity production to come from renewable sources by 2030.[14][15]
In 2016, renewable electricity accounted for 19.6% of France's total domestic power consumption, of which 12.2% was provided by hydroelectricity, 4.3% by wind power, 1.7% by solar power and 1.4% by bio energy.[16]
Germany
- Nuclear: 80 TWh (14.7%)
- Brown Coal: 134.8 TWh (24.7%)
- Hard Coal: 100 TWh (18.3%)
- Natural Gas: 45.2 TWh (8.3%)
- Wind: 77.8 TWh (14.3%)
- Solar: 37.5 TWh (6.9%)
- Biomass: 49.3 TWh (9.0%)
- Hydro: 20.8 TWh (3.8%)
In 2014, Germany's share of renewable energy in gross final energy consumption increased by 1.4% to 13.8%. In 2004, renewables accounted for only 5.8% or about the same share as for the Netherlands in 2014 (5.5%).[18]
In 2016 net generated electricity from renewable sources accounted for about 33.9%. Compared to the previous year, biomass, solar and wind changed their production by +4.8%, -3.1% and -1.7%, respectively, while weather permitting hydro power decreased by 10.3%. Wind and solar combined generated more energy than nuclear in 2016 (see pie-chart). Nuclear decreased production by 7.7%, while electricity generation from natural gas, brown and hard coal changed by +50.2%, -3.3% and -5.8%, respectively.[17]
Italy
In 2014, 38.2% of Italian electric energy consumption came from renewable sources (in 2005 this value was 15.4%), covering 16.2% of the total energy consumption of the country (5.3% in 2005).[19]
Solar energy production accounted for almost 9% of the total electric consumption in the country in 2014, making Italy the country with the highest contribution from solar energy in the world.[19]
Lithuania
In 2016 Renewable energy in Lithuania constituted 28% of the country's overall electricity generation. The majority of renewable energy in Lithuania is from biofuel. The principal source of electricity from renewable resources is from hydropower.[20]
Lithuania has many yet undeveloped renewable energy sources, such as wind, solar, geothermal energy, municipal waste, and biomass. The amount of biomass per capita in Lithuania is one of the highest in the European Union and it is estimated that in 2020 Lithuania will be the first in the EU according to the quantity of available biomass for biofuel production. The projected production of biofuels by 2020 is 0.25 tons per capita.[21]
Portugal
In 2010, more than 50% of all yearly electricity consumption in Portugal was generated from renewable energy sources.[22] The most important generation sources were hydroelectric (30%) and wind power (18%), with bioenergy (5%) and photovoltaic solar power (0.5%) accounting for the rest. In 2001, the Portuguese government launched a new energy policy instrument – the E4 Programme (Energy Efficiency and Endogenous Energies), consisting of a set of multiple, diversified measures aimed at promoting a consistent, integrated approach to energy supply and demand. By promoting energy efficiency and the use of endogenous (renewable) energy sources, the programme seeks to upgrade the competitiveness of the Portuguese economy and to modernize the country's social fabric, while simultaneously preserving the environment by reducing gas emissions, especially the CO2 responsible for climatic change. As a result, in the five years between 2005 and 2010, energy production from renewable sources increased 28%.[23]
In January 2014, 91% of the monthly needed Portuguese electricity consumption was generated by renewable sources,[24][25] although the real figure stands at 78%, as 14% was exported.
The renewable energy produced in Portugal fell from 55.5% of the total energy produced in 2016 to 41.8% in 2017, due to the drought of 2017, which severely affected the production of hydro electricity.[26] The sources of the renewable energy that was produced in Portugal in 2017 were Wind power with 21.6% of the total (up from 20.7% in 2016), Hydro power with 13.3% (down from 28.1% in 2016), Bioenergy with 5.1% (same as in 2016), Solar power with 1.6% (up from 1.4% in 2016), Geothermal energy with 0.4% (up from 0.3% in 2016) and a small amount of Wave power in the Azores. 24% of the energy produced in the Azores is geothermal.[27][28][29][30][31]
Portugal had the second largest photovoltaic power station in the world,[32] which was completed in December 2008. The complex, called Amareleja photovoltaic power station, covers an area of 250-hectare. The 46-megawatt solar power plant produces enough electricity for 30,000 homes and saves more than 89,400 tons a year in greenhouse gas emissions. Also in production since January 2007, the Serpa solar power plant with an installed capacity 11MW, covers an area of 60-hectare, produces enough energy for 8,000 homes and saves more than 30,000 tons a year in greenhouse gas emissions. These solar parks are approximately 30 km apart.
In 1999, Central de Ondas do Pico, one of the first Wave power centers in the world, started to work in the Pico Island, in the Azores. It has a capacity of 400 KW.[33]
Spain
Spain as a whole has the target of generating 30% of its electricity needs from renewable energy sources by 2010, with half of that amount coming from wind power. In 2006, 20% of the total electricity demand was already produced with renewable energy sources, and in January 2009 the total electricity demand produced with renewable energy sources reached 34.8%.[34]
Some regions of Spain lead Europe in the use of renewable energy technology and plan to reach 100% renewable energy generation in few years. Castilla y León and Galicia, in particular, are near this goal. In 2006 they fulfilled about 70% of their total electricity demand from renewable energy sources.
Through the use of nuclear power, two autonomous communities in Spain managed to fulfill their total 2006 electricity demand free of CO2 emissions: Extremadura and Castilla-La Mancha.[35]
In 2005 Spain became the first country in the world to require the installation of photovoltaic electricity generation in new buildings, and the second in the world (after Israel) to require the installation of solar hot water systems.[36]
Energy Community countries
Also the Contracting Parties of the Energy Community, Albania, Bosnia and Herzegovina, Kosovo*, North Macedonia, Moldova, Montenegro, Serbia and Ukraine implement the Directive 2009/28/EC since September 2012. The shares for the Contracting Parties were calculated based on the EU methodology and reflect an equal level of ambition as the targets fixed for EU Member States. The targets for the share of renewable energy in Contracting Parties in 2020 are the following: Albania 38%, Bosnia and Herzegovina 40%, Kosovo* 25%, North Macedonia 28%, Moldova 17%, Montenegro 33%, Serbia 27% and Ukraine 11%. The deadline for transposing the Directive 2009/28/EC and the adoption of the National Renewable Energy Action Plan (NREAP) was set for 1 January 2014.
With the Decision 2012/03/MC-EnC and the acceptance of binding targets Contracting Parties can participate in all cooperation mechanisms. This means in particular that statistical transfers of renewable energy for the purposes of target achievement will be possible independently from physical flow of electricity. In addition, the decision lays down a number of adaptations to the rules for statistical transfers and joint support schemes between the Contracting Parties and EU Member States to ensure the original objectives of the RES Directive are preserved.
Renewable energy sources
Bioenergy
Biomass
Biomass is material from plants or animals such as wheat stalks, yard waste, corn cobs, manure, wood or sewage. Wood and other solid biofuels supply the largest proportion of renewable energy in the EU at 64% of primary renewable energy.[37] Biomass is burned both for heating and electrical generation, often in the form of pellet fuel.
Biofuel
Biofuels offer an alternative plant-based solution to rising problems regarding geological fuel sources. Chemically, biofuels are alcohols produced by fermenting raw materials from starch and sugars. While complete substitution is not yet common in Europe, countries like Germany have been using E10 fuel consisting of 10% ethanol since 2011. E10 fuels have replaced the previous E5 fuel, containing 5% ethanol.
Although this may seem like a slight increase in ethanol use, this progression reflects a more progressive Europe as improvements are being made based primarily upon environmentally conscious efforts, rather than geopolitical or economic pressures.
Geothermal
The earliest industrial exploitation began in 1827 with the use of geyser steam to extract boric acid from volcanic mud in Larderello, Italy.
European Geothermal Energy Council (EGEC) promotes geothermal energy in the European Union.
Wind power
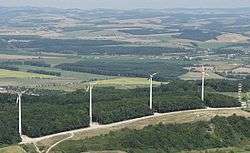
Research from a wide variety of sources in various European countries shows that support for wind power is consistently about 80% among the general public.[38]
Installed Wind power capacity in the European Union totalled 93,957 megawatts (MW) in 2011, enough to supply 6.3% of the EU's electricity. 9,616 MW of wind power was installed in 2011 alone, representing 21.4% of new power capacity. The EU wind industry has had an average annual growth of 15.6% over the last 17 years (1995-2011).[39]
A 2009 European Environment Agency report, entitled Europe's onshore and offshore wind energy potential confirms wind energy could power Europe many times over.[40] The report highlights wind power's potential in 2020 as three times greater than Europe's expected electricity demand, rising to a factor of seven by 2030.[41] An EWEA report overviewing 2009 data estimated that 230 gigawatts (GW) of wind capacity will be installed in Europe by 2020, consisting of 190 GW onshore and 40 GW offshore. This would produce 14-17% of the EU's electricity, avoiding 333 million tonnes of CO2 per year and saving Europe €28 billion a year in avoided fuel costs.[42]
In 2018 wind energy generated enough electricity to meet 14% of the EU's electricity demand. Denmark had the highest share of wind (41%) in Europe, followed by Ireland (28%) and Portugal (24%). Germany, Spain and the UK follow with 21%, 19% and 18% respectively. Out of the EU's total electricity consumption of 2,645 TWh in 2018, onshore wind contributed 309 TWh (12%) and offshore wind contributed 53 TWh (2%), bringing the total contribution of wind energy to 362 TWh (14%). The energy comes from a total onshore wind capacity of 160 GW and a total offshore wind capacity of 18.5 GW, with an average capacity factor of 24%.[43]
Solar energy
Photovoltaic solar power
Description: PV solar power are solar modules that are used to generate electricity.
|
<0.1, n/a
0.1-1
1-10
10-50 |
50-100
100-150
150-200
200-300 |
300-450
450–600 |
2012 17.2 GW of PV capacity were connected to the grid in Europe, compared to 22.4 GW in 2011; Europe still accounted for the predominant share of the global PV market, with 55% of all new capacity in 2012.[44]
2004 79% of all European capacity was in Germany, where 794 MWp had been installed. The European Commission anticipated that Germany may have installed around 4,500 MWp by 2010.[45]
2002, The world production of photovoltaic modules surpassed 550 MW, of which more than the 50% was produced in the EU. Within 15 years even a small country in Europe might expect to exceed this amount in domestic installations.
Concentrated solar power
Description: CSV power can generate either heat or electricity according to the type used. One advantage of concentrated solar power (CSP) is the ability to include thermal energy storage to provide power up to 24 hours a day.[46]
2015 The first commercial application of a new form of CSP called STEM will take place in Sicily .[47] This has generated considerable academic and commercial interest internationally for off-grid applications to produce 24 hour industrial scale power for mining sites and remote communities in Italy, other parts of Europe, Australia, Asia, North Africa and Latin America. STEM uses fluidized silica sand as a thermal storage and heat transfer medium for CSP systems. It has been developed by Salerno-based Magaldi Industries.
2012 By year end in the European Union, 2,114 MWp had been installed, mainly in Spain. Gemasolar, in Spain, was the first to provide 24‑hour power.[48]
Solar heating and cooling
Description: Solar heating is the usage of solar energy to provide space or water heating.
2016 At present the EU is second after China in the installations.
2010 If all EU countries used solar thermal as enthusiastically as the Austrians, the EU's installed capacity would already be 91 GWth (130 million m2 today, far beyond the target of 100 million m2 by 2010, set by the White Paper in 1997).
2008 The research efforts and infrastructure needed to supply 50% of the energy for space and water heating and cooling across Europe using solar thermal energy was set out under the aegis of the European Solar Thermal Technology Platform (ESTTP).[49] Published in late December 2008, more than 100 experts developed the strategic research agenda (SRA),[50] which includes a deployment roadmap showing the non-technological framework conditions that will enable this ambitious goal to be reached by 2050.[51]
2007 ESTIF's minimum target is to produce solar heating equivalent to 5.600.000 tons of oil (by 2020). A more ambitious, but feasible, target is 73 million tons of oil per year (by 2020)[52]
2005 Worldwide usage was 88 GWthermal . Growth potential is enormous. Solar heating in the EU was equivalent to more than 686.000 tons of oil.
Wave power
Description:Wave power is used to generate electricity.

2008 The world's first commercial wave farm is located at the Aguçadora Wave Park near Póvoa de Varzim in Portugal. The farm which uses three Pelamis P-750 machines was officially opened[53] in by the Portuguese minister for the economy.[54]
2007 Funding for a wave farm in Scotland using four Pelamis machines was announced on 20 February by the Scottish Executive. The funding of just over £4 million is part of a £13 million funding package for marine power in Scotland. The farm, is to be located at the European Marine Test Centre (EMEC) off the coast of Orkney and will have an installed capacity of 3MW.[55]
Hydrogen fuel
The Fuel Cells and Hydrogen Joint Undertaking, FCH JU, is a public private partnership supporting research, technological development and demonstration activities in fuel cell and hydrogen energy technologies in Europe. Its aim is to accelerate the market introduction of these technologies. The HyFLEET:CUTE is a project bringing together many partners from industry, government, academic and consulting organisations. It is intended that 47 hydrogen powered buses will operate in regular public transport service in 10 cities on three continents. Many of the HyFLEET:CUTE project partners have been involved in previous hydrogen transport projects, most notably the CUTE, ECTOS and STEP projects.
Economics
Jobs
The renewable energy industry have offered new work opportunities in the EU during 2005–2009.
| Jobs by the renewable energy industry in the EU[56] | |
|---|---|
| Year | Employees |
| 2005 | 230,000 |
| 2006 | 300,000 |
| 2007 | 360,000 |
| 2008 | 400,000 |
| 2009 | 550,000 |
Employment in the renewable energy industry has however fallen every year since 2011, reaching 34,300 jobs in 2016, according to annual data from the International Renewable Energy Agency.[57] IRENA says economic crises and adverse policy conditions led to reduced investments in renewable energy in the EU.[58]
In 2012, the use of intermittent renewable energy caused, according to the German newspaper Der Spiegel, increasing electricity prices and grid instability induced power outages,[59] created by renewable energy usage. It is also claimed by German heavy industry spokesmen that this has forced their industries to close, move overseas, and resulted in the loss of German heavy industry jobs.[60]
Fuel costs
In 2010 renewables avoided €30bn in imported fuel costs. In 2010 EU supported renewable energy with €26bn.[61]
Statistics
Installed wind power capacity
| No | Country | 2017[63] | 2016[64] | 2015[65] | 2014[66] | 2013[67] | 2012[68] | 2011[69] | 2010[70] | 2009 | 2008 | 2007 | 2006 | 2005 | 2004 | 2003 | 2002 | 2001 | 2000 | 1999 | 1998 |
|---|---|---|---|---|---|---|---|---|---|---|---|---|---|---|---|---|---|---|---|---|---|
| - | EU-28 | 168,729 | 153,731 | 141,579 | 128,751 | 117,289 | 105,696 | 93,957 | 84,074 | 74,767 | 64,712 | 56,517 | 48,069 | 40,511 | 34,383 | 28,599 | 23,159 | 17,315 | 12,887 | 9,678 | 6,453 |
| 1 | Germany | 56,132 | 50,019 | 44,946 | 39,165 | 33,730 | 31,332 | 29,060 | 27,214 | 25,777 | 23,897 | 22,247 | 20,622 | 18,415 | 16,629 | 14,609 | 11,994 | 8,754 | 6,113 | 4,442 | 2,875 |
| 2 | Spain | 23,170 | 23,075 | 23,025 | 22,986 | 22,959 | 22,796 | 21,674 | 20,676 | 19,149 | 16,689 | 15,131 | 11,623 | 10,028 | 8,264 | 6,203 | 4,825 | 3,337 | 2,235 | 1,812 | 834 |
| 3 | UK | 18,872 | 14,572 | 13,603 | 12,440 | 10,531 | 8,445 | 6,540 | 5,204 | 4,051 | 2,974 | 2,406 | 1,962 | 1,332 | 904 | 667 | 552 | 474 | 406 | 362 | 333 |
| 4 | France | 13,759 | 12,065 | 10,358 | 9,285 | 8,254 | 7,196 | 6,800 | 5,660 | 4,492 | 3,404 | 2,454 | 1,567 | 757 | 390 | 257 | 148 | 93 | 66 | 25 | 19 |
| 5 | Italy | 9,479 | 9,257 | 8,958 | 8,663 | 8,551 | 8,144 | 6.747 | 5,797 | 4,850 | 3,736 | 2,726 | 2,123 | 1,718 | 1,266 | 905 | 788 | 682 | 427 | 277 | 180 |
| 6 | Sweden | 6,691 | 6,519 | 6,025 | 5,425 | 4,470 | 3,745 | 2,907 | 2,163 | 1,560 | 1,048 | 788 | 571 | 509 | 442 | 399 | 345 | 293 | 231 | 220 | 174 |
| 7 | Poland | 5,848 | 5,782 | 5,100 | 3,834 | 3,390 | 2,497 | 1,616 | 1,107 | 725 | 544 | 276 | 153 | 83 | 63 | 63 | 27 | 0 | 0 | 0 | 0 |
| 9 | Denmark | 5,476 | 5,227 | 5,064 | 4,845 | 4,772 | 4,162 | 3,871 | 3,752 | 3,465 | 3,163 | 3,125 | 3,136 | 3,128 | 3,118 | 3,116 | 2,889 | 2,489 | 2,417 | 1,771 | 1,443 |
| 8 | Portugal | 5,316 | 5,316 | 5,079 | 4,914 | 4,724 | 4,525 | 4,083 | 3,898 | 3,535 | 2,862 | 2,150 | 1,716 | 1,022 | 522 | 296 | 195 | 131 | 100 | 61 | 60 |
| 10 | Netherlands | 4,341 | 4,328 | 3,431 | 2,805 | 2,693 | 2,391 | 2,328 | 2,245 | 2,229 | 2,225 | 1,747 | 1,558 | 1,219 | 1,079 | 910 | 693 | 486 | 446 | 433 | 361 |
| 12 | Ireland | 3,127 | 2,830 | 2,486 | 2,272 | 2,037 | 1,738 | 1,631 | 1,428 | 1,260 | 1,027 | 795 | 746 | 496 | 339 | 190 | 137 | 124 | 118 | 74 | 73 |
| 11 | Romania | 3,029 | 3,028 | 2,976 | 2,954 | 2,599 | 1,905 | 982 | 462 | 14 | 11 | 8 | 3 | 2 | 1 | 1 | 0 | 0 | 0 | 0 | 0 |
| 14 | Belgium | 2,843 | 2,386 | 2,229 | 1,959 | 1,651 | 1,375 | 1,078 | 911 | 563 | 415 | 287 | 194 | 167 | 96 | 68 | 35 | 32 | 13 | 6 | 6 |
| 13 | Austria | 2,828 | 2,632 | 2,412 | 2,095 | 1,684 | 1,378 | 1,084 | 1,011 | 995 | 995 | 982 | 965 | 819 | 606 | 415 | 140 | 94 | 77 | 34 | 30 |
| 15 | Greece | 2,651 | 2,374 | 2,152 | 1,980 | 1,865 | 1,749 | 1,629 | 1,208 | 1,087 | 985 | 871 | 746 | 573 | 473 | 383 | 297 | 272 | 189 | 112 | 39 |
| 16 | Finland | 2,071 | 1,539 | 1,001 | 627 | 448 | 288 | 197 | 197 | 146 | 143 | 110 | 86 | 82 | 82 | 52 | 43 | 39 | 39 | 39 | 17 |
| 17 | Bulgaria | 691 | 691 | 691 | 691 | 681 | 674 | 612 | 375 | 177 | 120 | 57 | 36 | 10 | 10 | 0 | 0 | 0 | 0 | 0 | 0 |
| 18 | Lithuania | 493 | 493 | 424 | 279 | 279 | 225 | 179 | 163 | 91 | 54 | 54 | 51 | 48 | 6 | 6 | 0 | 0 | 0 | 0 | 0 |
| 19 | Croatia | 613 | 422 | 387 | 347 | 339[71] | 180 | 131 | 89 | 28 | 0 | 0 | 0 | 0 | 0 | 0 | 0 | 0 | 0 | 0 | |
| 20 | Hungary | 329 | 329 | 329 | 329 | 329 | 329 | 329 | 295 | 201 | 127 | 65 | 61 | 17 | 3 | 3 | 3 | 0 | 0 | 0 | 0 |
| 21 | Estonia | 310 | 310 | 303 | 302 | 280 | 269 | 184 | 149 | 142 | 78 | 59 | 32 | 32 | 6 | 2 | 2 | 0 | 0 | 0 | 0 |
| 22 | Czech Republic | 308 | 281 | 282 | 282 | 269 | 260 | 217 | 215 | 192 | 150 | 116 | 54 | 28 | 17 | 9 | 3 | 0 | 0 | 0 | 0 |
| 23 | Cyprus | 158 | 158 | 158 | 147 | 147 | 147 | 134 | 82 | 0 | 0 | 0 | 0 | 0 | 0 | 0 | 0 | 0 | 0 | 0 | 0 |
| 24 | Latvia | 66 | 70 | 62 | 62 | 62 | 60 | 31 | 30 | 28 | 27 | 27 | 27 | 27 | 27 | 27 | 24 | 0 | 0 | 0 | 0 |
| 25 | Luxembourg | 120 | 120 | 58 | 58 | 58 | 58 | 44 | 44 | 35 | 35 | 35 | 35 | 35 | 35 | 22 | 17 | 15 | 10 | 10 | 9 |
| 26 | Slovakia | 3 | 3 | 3 | 3 | 3 | 3 | 3 | 3 | 3 | 5 | 5 | 5 | 5 | 3 | 0 | 0 | 0 | 0 | 0 | 0 |
| 27 | Slovenia | 3 | 3 | 3 | 3 | 2 | 0 | 0 | 0 | 0 | 0 | 0 | 0 | 0 | 0 | 0 | 0 | 0 | 0 | 0 | 0 |
| 28 | Malta | 0 | 0 | 0 | 0 | 0 | 0 | 0 | 0 | 0 | 0 | 0 | 0 | 0 | 0 | 0 | 0 | 0 | 0 | 0 | |
| - | EU-28 Offshore | 15,154 | 12,000 | 11,080 | 8,045 | 6,562 | 4,993 | 3,810 | 2,944 | 2,061 | 1,471 | 1,088 | |||||||||
| - | Turkey | 6,912 | 6,081 | 4,694 | 3,763 | 2,956 | 2,312 | 1,691 | 1,329 | 801 | 458 | ||||||||||
| - | Norway | 1,162 | 838 | 838 | 819 | 768 | 703 | 520 | 441 | 431 | 429 | 333 | 314 | 267 | 160 | 101 | |||||
| - | Ukraine | 593 | 526 | 514 | 498 | 371 | 278 | 151 | 87 | 94 | 90 | 89 | 86 | 77 | |||||||
| - | Switzerland | 70 | 70 | 60 | 60 | 60 | 46 | 42 | 18 | 14 | 12 | 12 | 12 | ||||||||
| - | North Macedonia | 37 | 37 | 37 | 0 | 0 | 0 | 0 | 0 | 0 | 0 | 0 | 0 | 0 | 0 | 0 | 0 | 0 | |||
| - | Faroe Islands | 18 | 18 | 18 | 18 | 7 | 0 | 0 | 0 | 0 | 0 | 0 | 0 | 0 | 0 | 0 | 0 | 0 | 0 | ||
| - | Russia | 15 | 15 | 15 | 15 | 15 | 15 | 9 | 9 | 0 | 0 | 0 | 0 | 0 | 0 | 0 | 0 | 0 | 0 | ||
| - | Belarus | 3 | 3 | 3 | 0 | 0 | 0 | 0 | 0 | 0 | 0 | 0 | 0 | 0 | 0 | 0 | 0 | 0 | |||
| - | Iceland | 3 | 3 | 3 | 3 | 1.8 | 0 | 0 | 0 | 0 | 0 | 0 | 0 | 0 | 0 | 0 | 0 | 0 | 0 | 0 | |
| - | Europe (MW) | 177,506 | 161,330 | 147,772 | 133,968 | 121,474 | 109,238 | 96,607 | 86,075 | 76,152 | 65,741 | 57,136 | 48,563 | 40,898 |
Photovoltaics
Total installed capacity
As of the end of 2013, cumulative capacity of solar PV accounted for almost 79 gigawatts and generated more than 80 terawatt-hours in the European Union. Including non-EU countries, a total of 81.5 GW had been installed. Although Europe has lost its leadership in solar deployment, the continent still accounts for about 59 percent of global installed photovoltaics. Solar PV covered 3 percent of the electricity demand and 6 percent of the peak electricity demand in 2013. Grid-connected photovoltaic power systems account for more than 99 percent of the overall capacity, while stand-alone photovoltaic power system have become insignificant.[72]
| 2013 - photovoltaic Barometer Report - PV Capacity in the European Union | |||||||||
|---|---|---|---|---|---|---|---|---|---|
| Country | Added 2014 (MW) | Total 2014 (MW) | Generation 2014 | ||||||
| off- grid |
on- grid |
Capacity | off- grid |
on- grid |
Capacity | Watt per capita |
in GWh |
in % | |
| – | 140.0 | 140.0 | 4.5 | 766.0 | 770.5 | 90.6 | 766.0 | – | |
| – | 65.2 | 65.2 | 0.1 | 3,105.2 | 3,105.3 | 277.2 | 2,768.0 | – | |
| – | 1.3 | 1.3 | 0.7 | 1,019.7 | 1,019.8 | 140.8 | 1,244.5 | – | |
| 0.2 | 14.0 | 14.2 | 0.7 | 33.5 | 34.2 | 8.1 | 35.3 | – | |
| 0.2 | 29.7 | 30.0 | 1.1 | 63.6 | 44.8 | 75.5 | 104.0 | – | |
| – | – | – | 0.4 | 2,060.6 | 2,061.0 | 196.1 | 2,121.7 | – | |
| 0.1 | 29.0 | 29.1 | 1.5 | 600.0 | 601.5 | 106.9 | 557.0 | – | |
| – | – | – | 0.1 | – | 0.2 | 0.1 | 0.6 | – | |
| – | – | – | 10.0 | 0.2 | 10.2 | 1.9 | 5.9 | – | |
| 0.1 | 974.9 | 975.0 | 10.8 | 5,589.2 | 5,600.0 | 87.6 | 5,500.0 | – | |
| – | 1,899.0 | 1,899.0 | 65.0 | 38,236.0 | 38,301.0 | 474.1 | 34,930.0 | – | |
| – | 16.9 | 16.9 | 7.0 | 2,595.8 | 2,602.8 | 236.8 | 3,856.0 | – | |
| 0.1 | 3.2 | 3.3 | 0.7 | 37.5 | 38.2 | 3.9 | 26.8 | – | |
| – | – | 0.1 | 0.9 | 0.2 | 1.1 | 0.2 | 0.7 | – | |
| 1.0 | 384.0 | 385.0 | 13.0 | 18,437.0 | 18,450.0 | 303.5 | 23,299.0 | – | |
| – | – | – | – | 1.5 | 1.5 | 0.8 | n.a. | – | |
| – | – | – | 0.1 | 68.0 | 68.1 | 23.1 | 73.0 | – | |
| – | 15.0 | 15.0 | – | 110.0 | 110.0 | 200.1 | 120.0 | – | |
| – | 26.0 | 26.0 | – | 54.2 | 54.2 | 127.5 | 57.8 | – | |
| – | 361.0 | 361.0 | 5.0 | 1,095.0 | 1,100.0 | 65.4 | 800.0 | – | |
| 0.5 | 19.7 | 20.2 | 2.9 | 21.5 | 24.4 | 0.6 | 19.2 | – | |
| 1.2 | 115.0 | 116.2 | 5.0 | 414.0 | 419.0 | 40.2 | 631.0 | – | |
| – | 270.5 | 270.5 | – | 1,292.6 | 1,292.6 | 64.8 | 1,355.2 | – | |
| – | 2.0 | 2.0 | 0.1 | 590.0 | 590.1 | 109.0 | 590.0 | – | |
| – | 7.7 | 7.7 | 0.1 | 255.9 | 256.0 | 124.2 | 244.6 | – | |
| 0.3 | 21.0 | 21.3 | 25. | 4,761.8 | 4,787.3 | 102.9 | 8,211.0 | – | |
| 1.1 | 35.1 | 36.2 | 9.5 | 69.9 | 79.4 | 8.2 | 71.5 | – | |
| – | 2,448.0 | 2,448.0 | 2.3 | 5,228.0 | 5,230.3 | 81.3 | 3,931.0 | – | |
| 4.9 | 6,878.4 | 6,883.3 | 167.1 | 86,506.8 | 86,673.9 | 171.5 | 91,319.8 | – | |
| Country | off- grid |
on- grid |
Capacity | off- grid |
on- grid |
Capacity | Watt per capita |
in GWh |
in % |
| Added 2014 (MW) | Total 2014 (MW) | Generation 2014 | |||||||
Source: EUROBSER'VER (Observatoire des énergies renouvelables) Photovoltaic Barometer - installations 2014[73]
Solar heating
| 2008 | 2009 | 2010 | 2011 | 2012 | 2013 | |
|---|---|---|---|---|---|---|
| 19.08 | 21.60 | 23.49 | 25.55 | 29.66 | 31.39 | |
| Sources:[74][75][76][77][78][79] | ||||||
Biofuels
| Biofuels[80] | ||||||||
|---|---|---|---|---|---|---|---|---|
| Consumption 2005 (GWh) | Consumption 2006 (GWh) | Consumption 2007 (GWh) | ||||||
| No | Country | Total | Total | Biodiesel | Bioethanol | Total | Biodiesel | Bioethanol |
| 1 | 21,703 | 40,417 | 29,447 | 3,544 | 46,552 | 34,395 | 3,408 | |
| 2 | 4,874 | 8,574 | 6,855 | 1,719 | 16,680 | 13,506 | 3,174 | |
| 3 | 920 | 3,878 | 3,878 | 0 | 4,524 | 4,270 | 254 | |
| 4 | 1,583 | 1,961 | 629 | 1,332 | 4,341 | 3,031 | 1,310 | |
| 5 | 793 | 2,097 | 1,533 | 563 | 4,055 | 3,148 | 907 | |
| 6 | 1,938 | 2,587 | 523 | 1,894 | 3,271 | 1,158 | 2,113 | |
| 7 | 2 | 818 | 818 | 0 | 1,847 | 1,847 | 0 | |
| 8 | 2 059 | 1,732 | 1,732 | 0 | 1,621 | 1 621 | 0 | |
| 9 | 96 | 96 | 0 | 1,308 | 539 | 769 | ||
| 10 | 481 | 1 102 | 491 | 611 | 1,171 | 180 | 991 | |
| 11 | 0 | 10 | 10 | 0 | 1,061 | 1,061 | 0 | |
| 12 | 32 | 540 | 540 | 0 | 940 | 940 | 0 | |
| 13 | 97 | 226 | 162 | 64 | 612 | 477 | 135 | |
| 14 | 7 | 6 | 6 | 0 | 407 | 397 | 10 | |
| 15 | 33 | 226 | 213 | 13 | 382 | 380 | 2 | |
| 16 | 58 | 50 | 48 | 2 | 160 | 151 | 9 | |
| 17 | 110 | 153 | 149 | 4 | 154 | n.a. | 154 | |
| 18 | 28 | 139 | 4 | 136 | 107 | 0 | 107 | |
| 19 | 0 | 371 | 172 | 179 | 101 | n.a. | 101 | |
| 20 | 9 | 36 | 8 | 13 | 97 | 27 | 54 | |
| 21 | 0 | 42 | 0 | 42 | 70 | 0 | 70 | |
| 22 | 34 | 29 | 17 | 12 | 20 | 0 | 20 | |
| 23 | 0 | 0 | 10 | 0 | 10 | n.a. | n.a. | |
| 24 | – | 32 | 32 | 0 | n.a. | n.a. | n.a. | |
| 25 | 8 | 10 | 10 | 0 | n.a. | n.a. | n.a. | |
| 26 | 0 | 7 | 0 | n.a. | n.a. | n.a. | n.a. | |
| 27 | 0 | 0 | 0 | 0 | n.a. | n.a. | n.a. | |
| 27 | EU | 34,796 | 65,148 | 47,380 | 10,138 | 89,482 | 67,154 | 13,563 |
| *Total includes vegetable oils in Germany: 7309 GWh (2006) and 2018 GWh (2005) and biogas in Sweden: 225 GWh (2006) and 160 GWh (2005), n.a. = not available | ||||||||
See also
- List of energy storage projects
- List of renewable energy topics by country
- Climate change in the European Union
- Desertec
- Economy of the European Union
- EKOenergy ecolabel for energy
- Energie-Cités
- Energy Community
- Energy efficiency in Europe (study)
- Environment in the European Union
- Eugene Green Energy Standard
- European Energy Research Alliance
- European Renewable Energy Council
- European Photovoltaic Industry Association (EPIA).
- European Pollutant Emission Register (EPER)
- Fraunhofer Society
- IDAE
- Intelligent Energy Europe
- Renewable energy commercialization
- Renewable energy development
- Renewables Directive
- REN21
- Transport in the European Union
- EurObserv'ER
- European countries by fossil fuel use (% of total energy)
Further reading
- Joanna Krzeminska, Are Support Schemes for Renewable Energies Compatible with Competition Objectives? An Assessment of National and Community Rules, Yearbook of European Environmental Law (Oxford University Press), Volume VII, Nov. 2007, p. 125
In the media
- 11 September 1999, The Guardian: Renewable energy across Europe
- 23 March 2007, The BBC: EU environmental achievements by Commissioner Dimas.
References
- Share of renewables in energy consumption in the EU reached 18% in 2018. Eurostat News Release, 23 January 2020.
- "European Union Renewable Energy Directive, 2009" (PDF).
- Eurostat Share of renewable energy in gross final energy consumption, as of December 2017
- Severin Fischer/Oliver Geden (2013), Updating the EU's Energy and Climate Policy. New Targets for the Post-2020 Period, FES International Policy Analysis
- Oliver Geden/Severin Fischer (2014), Moving Targets. Negotiations on the EU’s Energy and Climate Policy Objectives for the Post-2020 Period and Implications for the German Energy Transition, SWP Research Paper 2014/RP03
- https://www.theguardian.com/environment/2015/apr/27/shell-lobbied-to-undermine-eu-renewables-targets-documents-reveal Shell lobbied to undermine EU renewables targets, documents reveal
- "Renewable energy directive - Energy - European Commission". Energy. 16 July 2014. Retrieved 12 April 2018.
- New EU energy plan – more security, less pollution, press release by European Commission
- Oliver Geden (2013), Modifying the 2°C Target. Climate Policy Objectives in the Contested Terrain of Scientific Policy Advice, Political Preferences, and Rising Emissions, SWP Research Paper 5
- Randalls, Samuel (2010). "History of the 2 °C climate target". Wiley Interdisciplinary Reviews: Climate Change. 1 (4): 598–605. doi:10.1002/wcc.62.
- "Kevin Anderson | Tyndall°Centre for Climate Change Research". Archived from the original on 1 May 2010.
- [Prof Kevin Anderson, past climate danger, in denial YouTube https://www.youtube.com/watch?v=32HfnxIDLLA] 18 November 2012
- [The Truth About Global Warming: Brutal Numbers, Tenuous Hope http://vimeo.com/39555673] Cabot Institute Annual Lecture, 2012
- Tara Patel (22 July 2015). "France to Adopt Law to Cut Nuclear Dependency, Carbon Emissions". Bloomberg News. Retrieved 23 July 2015.
- "France passes sweeping energy bill, to raise CO2 tax to €100/t by 2030". Carbon Pulse. 22 July 2015. Retrieved 23 July 2015.
- "Panorama de l'électricité renouvelable en 2016" (PDF).
-
"Power generation in Germany – assessment of 2016" (PDF). http://www.ise.fraunhofer.de/. Fraunhofer Institute, Germany. 5 January 2015. pp. 2, 3. Retrieved 5 January 2015. External link in
|website=(help) - Share of renewables in energy consumption in the EU rose further to 16% in 2014. Eurostat News Release, 10 February 2016.
- "Il rapporto Comuni Rinnovabili 2015". Comuni Rinnovabili (in Italian). Legambiente. Retrieved 13 March 2016.
- "Sveiki atvykę į avei.lt!". www.avei.lt.
- Lithuanian Renewable Energy Promotion Action Plan 2010-2020 years. 2008. Applied research. Vilnius. 215
- "Nation Bureau for Geology and Energy, Energias Renováveis - Estatísticas Rápidas de fevereiro de 2011 (in Portuguese)" (PDF).
- ROSENTHAL, ELISABETH (9 August 2010). "Portugal Gives Itself a Clean-Energy Makeover". New York Times. Retrieved 11 August 2010.
- "Renewable energy association, Energias Renováveis - February Press release (in Portuguese)" (PDF). Archived from the original (PDF) on 22 February 2014. Retrieved 12 February 2014.
- Garcia, Ricardo. "Mau tempo empurra renováveis para recorde em Janeiro".
- Martins Carvalho, Patrícia (22 November 2017). "Seca está a afetar produção de energia hídrica. Consumo de carvão dispara". Notícias ao Minuto. Retrieved 16 February 2018.
- "Produção de energia eléctrica: total e a partir de fontes renováveis". Pordata. 31 January 2018. Retrieved 16 February 2018.
- "Evolution of the Electricity Generation in Mainland Portugal". APREN. Retrieved 16 February 2018.
- "Produção de Energia Eléctrica (KWh): Produção por Região, Origem da Energia e Ano, Mes (KWh)". Serviço Regional de Estatística dos Açores. 15 February 2018. Retrieved 16 February 2018.
- "Fontes fósseis responsáveis por 63,4% da energia elétrica nos Açores". Diário de Notícias. 15 February 2018. Retrieved 16 February 2018.
- "Electricidade de origem renovável na Madeira correspondeu a 29% da produção". dnoticias.pt. 15 February 2018. Retrieved 16 February 2018.
- http://ww1.rtp.pt/noticias/?article=379834&visual=26&tema=4 Archived 17 February 2012 at the Wayback Machine ww1.rtp.pt
- "O que são: Oceanos". APREN. Retrieved 16 February 2018.
- Las renovables ahorraron en enero 90 millones de euros en importaciones de gas Archived 12 February 2009 at the Wayback Machine, Energías-Renovables.com, (Spanish)
- "Archived copy" (PDF). Archived from the original (PDF) on 30 October 2008. Retrieved 4 October 2007.CS1 maint: archived copy as title (link) Red Eléctrica de España Annual Report 2006
- "Layout 1" (PDF). Ren21.net. Archived from the original (PDF) on 18 July 2011. Retrieved 24 April 2011.
- ec.europa.eu/eurostat/web/environmental-data-centre-on-natural-resources/natural-resources/energy-resources/energy-from-biomass
- "The Social Acceptance of Wind Energy". European Commission. Archived from the original on 28 March 2009.
- EWEA (2012). "Wind in power: 2011 European statistics". Archived from the original on 27 March 2012.
- "Europe's onshore and offshore wind energy potential – EEA". Eea.europa.eu. 8 June 2009. Retrieved 24 April 2011.
- "EEA report confirms wind energy could power Europe many times over". Eolic Energy News. 15 June 2009. Archived from the original on 26 July 2009. Retrieved 24 April 2011.
- "Factsheet" (PDF). www.ewea.org.
- "Wind energy in Europe in 2018" (PDF). Wind Europe. February 2019.
- "Global Market Outlook for Photovoltaics 2013 - 2017". European Photovoltaic Industry Association. Archived from the original on 19 March 2014. Retrieved 19 March 2014.
- "ec.europa.eu". Archived from the original on 4 June 2006. Retrieved 26 May 2006.
- "Wayback Machine" (PDF). 9 January 2012. Archived from the original (PDF) on 9 January 2012.
- CSP Today, April 11, 2014 "Italian project shows strong potential for sand based CSP"
- Goodman, Al. "Spain's round-the-clock solar power plant". CNN.
- "European Solar Thermal Technology Platform". ESTTP. Archived from the original on 20 January 2012. Retrieved 24 April 2011.
- "Single News Item – News". ESTIF. 19 December 2008. Retrieved 24 April 2011.
- "Action Plan for 50%: How Solar Thermal Can Supply Europe's Energy | Renewable Energy News Article". Renewableenergyworld.com. Retrieved 24 April 2011.
- Solar Thermal Action Plan for Europe ESTIF, 1/2007 Archived 28 September 2007 at the Wayback Machine
- "Portal do Governo". Portugal.gov.pt. Archived from the original on 7 December 2008. Retrieved 24 April 2011.
- Lima, Joao (23 September 2008). "Babcock, EDP and Efacec to Collaborate on Wave Energy Projects". Bloomberg. Retrieved 24 April 2011.
- "Orkney to get 'biggest' wave farm". BBC News. 20 February 2007. Retrieved 22 May 2010.
- Jobs provided by RES Industry in the EU (2005–2009) EREC 2010
- "Jobs annual review" (PDF). irena.org. 2018.
- "Jobs annual review" (PDF). www.irena.org. 2016.
- Schröder, Catalina (16 August 2012). "Energy Revolution Hiccups: Grid Instability Has Industry Scrambling for Solutions" – via Spiegel Online.
- Dohmen, Frank; Neubacher, Alexander (24 February 2012). "Merkel's Switch to Renewables: Rising Energy Prices Endanger German Industry" – via Spiegel Online.
- Avoiding fossil fuel costs with wind energy EWEA March 2014
- EWEA Staff (2010). "Cumulative installed capacity per EU Member State 1998 - 2009 (MW)". European Wind Energy Association. Retrieved 22 May 2010.
- "Wind Europe statistics" (PDF). windeurope.org. 2017.
- "Wind Europe statistics" (PDF). windeurope.org. 2016.
- EWEA: "Wind in power: 2015 European statistics", February 2016
- EWEA Staff (February 2015). "EWEA Annual Statistics 2014" (PDF). European Wind Energy Association. Retrieved 11 February 2015.
- EWEA Staff (February 2014). "EWEA Annual Statistics 2013" (PDF). European Wind Energy Association. Retrieved 11 February 2014.
- EWEA: "Wind in power: 2012 European statistics", February 2013
- EWEA Staff (February 2012). "EWEA Annual Statistics 2011" (PDF). European Wind Energy Association. Retrieved 18 February 2011.
- EWEA Staff (February 2011). "EWEA Annual Statistics 2010" (PDF). European Wind Energy Association. Retrieved 31 January 2011.
- "Do kraja godine 280 novih postrojenja na obnovljive izvore energije".
-
"Global Market Outlook for Photovoltaics 2014-2018" (PDF). http://www.epia.org. EPIA - European Photovoltaic Industry Association. Archived from the original (PDF) on 25 June 2014. Retrieved 12 June 2014. External link in
|website=(help) - EUROBSER'VER. "Photovoltaic barometer 2015". http://www.eurobserv-er.org/. p. 8. Archived from the original on 26 May 2015. Retrieved 1 May 2014. External link in
|website=(help) - Solar thermal market grows strongly in Europe Trends and Market Statistics 2008, ESTIF 5/2009
- EurObserv'ER 203 (2011) - Solar thermal and concentrated solar power barometer
- solar_thermal_markets.pdf Solar Thermal Markets in Europe
- Solar Thermal Markets in Europe Trends and Market Statistics 2010, ESTIF June 2011
- Solar Thermal Markets in Europe
-
EUROBSER'VER. "Solar Thermal and CSP Barometer - installations 2012 and 2013" (PDF). http://www.energies-renouvelables.org. Archived from the original (PDF) on 6 November 2014. Retrieved 25 November 2014. External link in
|website=(help) - Biofuels barometer 2007 – EurObserv’ER Systèmes solaires Le journal des énergies renouvelables n° 179, s. 63–75, 5/2007
External links
| Wikimedia Commons has media related to Renewable energy in the European Union. |
- Eurostat - Statistics Explained - Renewable energy statistics
- Europe's Energy Portal European platform for energy efficiency and renewable energy.
- Directive 2009/28/EC of the European Parliament and of the Council of 23 April 2009 on the promotion of the use of energy from renewable sources
- ManagEnergy, for energy efficiency and renewable energies at the local and regional level.
- Reegle: Information Gateway For Renewable Energy And Energy Efficiency
- 34% from renewables in the EU by 2020?
- REPAP2020 Project: Renewable energy policy action paving the way towards 2020
- All EurObserv'ER barometers - The state of renewable energies in Europe
Organizations
- European Renewable Energy Council
- European Forum for Renewable Energy Sources "Members of Parliament for a Sustainable Energy Future"
- European Federation of Regional Energy and Environment Agencies (FEDARENE).
- European Future Energy Forum
- European Commission-Energy
| Africa |
| ||||
|---|---|---|---|---|---|
| Asia | |||||
| Europe |
| ||||
| North America | |||||
| Oceania | |||||
| South America | |||||
| |||||