Renewable energy in Finland
Renewable energy in Finland grew to 38.7% of total final energy consumption by year end 2014 (it was just 29.2% in 2005), achieving joint second position with Latvia in terms of renewable energy consumption by share amongst the EU-28 countries, behind its neighbour Sweden in first position on a 52.6% share.[1] The 2014 share in Finland breaks down as renewable energy providing 52% of the heating and cooling sector, 31.4% of the electricity sector and 21.6% of the transport sector.[2] By 2014 Finland had already exceeded its 2020 target for renewable energy use under the EU renewable energy directive as shown in the table of country targets.
The earlier European objectives for 2010 included the targets of: 22% renewable source electricity and 12% renewable of primary energy in 2010 (directive and white paper). This included the objectives of 40 GWh wind power, 3 GWh PV and 5.75% biofuels (2010). The wind power objective was reached as early as 2005.
In 2005 the renewable energy share of electricity in Finland was as follows: Hydro electric power 60%, forest industry black liquor 22%, other wood residues 16%, wind power 0.2% and other RE 1%.
Renewable energy targets in 2020
According to IEA Finland's 2020 renewable energy targets are: overall 38 %, heating and cooling 47 %, electricity 33 % and transport 20 %.[3] compared to Swedish targets overall 50 %, heating and cooling 62 %, electricity 63 % and transport 14 %.[4] As of 2019, Finland classifies palm oil fatty acid residues as sustainable unlike e.g. Sweden.[5]
Energy in Finland
Finland differs from most industrialized countries in that many of its energy needs stem from the Nordic conditions. Finland is located between 60 and 70 degrees northern latitude and a quarter of its area lies north of the Arctic Circle. In fact, one third of all people living north of the 60th parallel are Finns. The annual mean temperature in the south of the country is around 5 °C and 0 °C in the north. The population-weighted average number of heating degree days for Finland is 5000, considerably more than in Sweden and Norway (4000). Thus, the Finnish climate is the coldest in the EU and, consequently, a large share of the energy (22%) is used for the heating of buildings.[6]
Finland's energy consumption increased 44% in electricity and 30% in total energy use during the period 1990–2006. The increase in electricity consumption of 15,000 GWh (1995–2005) was more than Finland's total hydroelectric power capacity. The consumption increased almost equally in all sectors (industry, residential, and services). The share of renewable electricity in Finland has been stable (1998–2005): 11-12% plus yearly variable hydroelectric power, totaling 24-27%. The forest industries contributed 57% of the RE power generation via black liquor and wood burning in 1990. By 2005 this share had grown to 67%.[7] The rest consisting primarily of hydroelectric power. As with most first world countries, the vast majority of commercially viable hydroelectric sites in Finland have already been developed. The forest industry uses 30% of all electricity in Finland (1990–2005). Its process wastes, wood residues, and black liquor were used to produce 7-8000 GWh of electricity in 2005. However, during that year electricity consumption fell 10% compared to 2004 as a result of a prolonged forest industry labour dispute.[8] Finland's power consumption was (2005) 17.3 MW electricity per capita compared to Germany 7.5 MW per capita. This number includes the power losses of the distribution.
Of primary energy consumed in Finland, around 25% is covered with renewable sources. This is one of the highest figures among all industrialized nations and the third highest in the EU. Finland is among the leading countries in the use of biomass in energy production: the share of bioenergy is 20% of all primary energy consumption and, therefore, the second highest in the EU after Latvia. The objective of RE (2005) of electricity was 35% (1997–2010). However, (2006) the Finnish objective was dropped to 31.5% (1997–2010). According to ‘Renewables Global Status Report’ Finland aims to increase RE only 2% in 13 years. This objective to add the RE use with 2% in 13 years is among the most modest of all the EU countries.[9]
Finnish CO2 emissions grew 14.5% (1990:2004), while the EU average was - 0.6%.[10]
Government policy
The Finnish energy policy is based on the National Climate Strategy of 2001, updated in 2005 and 2008. The strategy provides the basis for policy preparation, decision-making and negotiations on national, EU and international levels. In its most recent adaptation, the strategy focuses on setting guidelines up to 2020 and a vision as far as 2050 to steer long-term planning.
The aim is to fulfil the Kyoto Protocol and its obligations by 2013. By that time, adequate post-Kyoto emission reduction measures should be in place, including the set of measures required of EU countries by 2020 by common agreement. To that end, the EU requires its members to report by 2016 about their ability to meet the obligations set for 2020. With regard to renewables, the EU goals aim to a share of 38% of final energy consumption in Finland by 2020, compared to 28.5% in 2005 and a previous national goal of 31% by 2020.
The national long-term vision aims at halting the growth of final energy consumption on one hand, and increasing the share of renewables on the other hand. To attain these objectives, the energy efficiency of consumption must be enhanced, particularly in housing, construction and transport, and new policy measures must be enacted to promote renewables.
The government expects the growing global demand of fossil fuels to drive their prices further up in the long term. Combined with the cost of emission allowances, this will significantly change the price relationship of fossil and renewable energy in favour of the latter. The government envisions significant growth in the use of wood-based energy, waste fuels, heat pumps, biogas and wind energy. A feed-in tariff system will be introduced as a major new policy measure to drive the introduction of renewables.
Other major points in the strategy include:
- The use of bioenergy in the forest industry will be maximised.
- The use of wood residues from forestry as a fuel and raw material will be tripled by 2020 to 12 million m3.
- The government will support the installation of heat pumps, bioenergy and solar energy systems for space heating.
- The use of fossil oil for heating will end at the latest during the 2020s.
- The use of agricultural biomass and biogas as fuels will be increased.
- New technologies for transportation biofuel production will be explored with the aim of having a share of 10% for biofuels in transport fuel use by 2020.
- Installed wind power capacity will increase to 2000 MW by 2020 from the present 120 MW with the help of various subsidies.
- The government will support the use of off-shore wind power by leasing the sea areas with low tariffs.
- The government will encourage power uprates in old hydropower plants and the construction of some new hydropower plants.
- The use of recycled fuels will increase with 150% by 2020.
Finland already has among the highest shares of renewables, yet Finland for a long time did not use feed-in tariffs, fixed premiums, green certificate systems or tendering procedures. Lately some new policies have been adopted. From the European countries, Finland, Malta and Slovenia are the only ones (2006) that use only tax incentives to promote wind energy and other renewable electricity. Finland has no obligations or binding recommendations for the power companies to promote RE.[11]
Finland was one of the few that opposed the sustainability criteria of biofuels in the EU in 2013.[12]
Private sector
Energy markets in Finland are based on free enterprise and open competition. The electric power industry in Finland has been open for competition since the new electricity market legislation in 1995. At the same occasion Finland joined the joint Nordic electricity market area where spot prices for electricity are determined at the common electricity exchange Nordpool. Power can be bought and sold freely in Finland, Sweden, Norway and most parts of Denmark.
For district heat there is no national market for technological reasons, as heat cannot be transported over long distances. However, district heat is largely produced by the same energy companies in centralised district heating plants or CHP plants. Locally there is usually only one district heat provider available, which means that the competition takes place between alternative heat sources. Biomass fuels and peat are commonly used for district heating. Some district heat is also sold in small scale by local entrepreneurs who produce it with biomass fuels. The government company for promoting energy efficiency, Motiva, has a program for promoting small scale heating entrepreneurship.
In the Nordic electricity market, each country is independently responsible for its transmission grid. In Finland the local distribution grids are owned primarily by local energy companies. The national transmission grid is owned by the Fingrid corporation which for its part is owned jointly by the state, energy companies and financial investors. Major changes in the ownership of Fingrid are expected as new EU legislation will forbid energy producers from owning parts of the transmission grid.
The largest electricity producers in Finland are Fortum, the state energy company, Pohjolan Voima, the energy company owned by major industries, Teollisuuden Voima, the industry-owned nuclear power company, Helsingin Energia, the power company of Helsinki City, and Vattenfall, the largest energy company of Sweden. There are also a large number of small and medium-sized local energy companies. A special feature of the Finnish electricity markets is companies like Pohjolan Voima and Teollisuuden Voima that operate with the Mankala-principle. That is, they do not pay dividends, but rather provide power to their owners without seeking profit.
Moreover, many of the industrial corporations are themselves major energy producers as in a number of factories process wastes are used as fuels. In most cases such fuels originate from wood processing and, therefore, count as renewables. Thus major producers of bioenergy in Finland include all the major wood and paper industry corporations: Stora-Enso, UPM and M-Real. Furthermore, the national oil company, Neste Oil, is a growing producer of biofuels and biodiesel in particular.
Largest hydropower producers are the state-owned companies Fortum and Kemijoki and the industry-owned Pohjolan Voima. The largest producer of wind power in Finland is the Hyötytuuli corporation, owned by the energy companies of various cities. Hyötytuuli produces about one third of wind power in Finland. The rest is produced by a large number of companies in relatively small power plants. Finland is a growing producer of RES related technology. The volume of trade of all energy technology to and from Finland is shown in Figure 4. RES technologies hold a significant share of this trade.
The largest producers of RE technology in Finland include
- ABB, produces among other things components to wind power plants.
- WinWind, producer of wind power plants.
- Foster Wheeler and Metso Power, producers of boilers for biomass and other fuels.
- NAPS Systems, producer of solar panels.
Smaller companies that produce energy-related clean technology include Aidon, Bearing Drive Finland, DGT Direct Granulation Technology, EcoSir, Finnish Electric Vehicle technologies, Greenvironment, Modilis, Primet, Puhdas Energia and The Switch.
Energy efficiency in Finland is advanced by the state-owned company Motiva. Public funding for the development of new technologies is primarily distributed by the Finnish Funding Agency for Technology and Innovation Tekes.
Employment
In total electricity and district heat production employed 14,000 people and oil refining and distribution 13,500 people out of the 2,500,000 people employed in Finland in 2003. Bioenergy sector employed an estimated 6000-7000 people. The total employment in the energy sector numbered 34,000 people in 2004. These numbers include renewable and non-renewable energies as there are no separate statistics.
The major renewable energy sources, namely hydropower and bioenergy are produced in a large scale, where business models and jobs are similar to other large-scale energy production. There is additionally small scale production of renewable energy that tends to generate small enterprise and a proportionally greater number of jobs.
For example, the Ministry of Employment the Economy has conducted a research that found that there are 368 small bioenergy companies that provide 1,667 jobs. The number of companies and jobs has grown steadily in the past years and the growth is expected to continue given the ambitious goals for bioenergy in the national climate and energy strategy.
Given that there is established production of wind power plants and plant components, the increased use of wind power in Finland and elsewhere can be expected to create jobs in the sector. This would generate demand for professionals of all levels in mechanical, material and electrical technology. Similar demand can be expected from the increased use of bioenergy and the production of the necessary power plant components.
Professionals in chemistry and life sciences and related fields will be needed for the envisioned development and production of the next generation of biofuels. They will also have an important role in developing the forest industry towards more versatile biorefineries instead of traditional pulp and paper mills.
Finally the strengths of the Finnish electronics industry and education can give rise to a variety of clean technologies such as solar power, control systems for power production and consumption, electric vehicles, etc.
Energy production
Biomass
Heat and power
Finland is among the leading countries in the use of biomass in energy production: the share of bioenergy is 20% of all primary energy consumption and, therefore, the second highest in the EU after Latvia. The high share of biomass in Finnish energy production is explained by the large forest resources of the country and a highly developed wood and paper industry. Most of the country (68%) is covered by boreal coniferous forests. The wood and paper industry accounts for nearly two thirds of all industrial energy consumption but it is also a major producer of renewable energy. Most liquid and solid industrial wood residues are recycled into energy production, which accounts for 20% of Finnish primary energy use. Thus, the wood and paper industry is for large part energy independent.
Over time, the volume of industrial biomass energy has increased in the industrial use. As the energy consumption has increased, the share of renewables has stayed constant. However, simultaneously the use of non-renewable energy has grown about 20%. In comparison, in Germany the non-RE source of electricity grew only 2% (1990–2005).
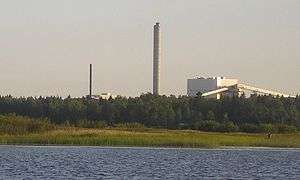
Biomass is widely used as a fuel in electricity production, CHP plants and district heating, often mixed with other fuels, especially peat. In fact, Finland is among the world leaders in the use of CHP. Both renewable and fossil fuels are used. The world's largest bio power plant with a capacity of 265 MW is situated in Pietarsaari in Finland. Wood is also used directly for heating. In total around 6 million m3 or 50 PJ of firewood are used annually for space heating. There are also dedicated boilers that burn wood chips or pellets. Fuel oil fired heating can be converted to use pellets, which has been estimated to have a potential of 25 PJ/a.[6]
Agricultural biomass production takes place on a modest scale. Annually around 6000 tons of straw is used as a fuel, while theoretically a maximum of 1.8 million tons could be used. Furthermore, turnip rape is cultivated on about 860 hectares mainly for lubrication oil and diesel oil production. Finally, there is some interest in the possibility of growing reed canary grass for use as a fuel. Some tests have been carried out in its use in multifuel boilers and as a raw material for pellets.
Finland uses insignificant wood pellet quantities for thermal energy production. In Sweden and Denmark active energy politics with significant taxation of fossil energy has encouraged an early development of the pellet market. This development has taken place much faster than in Finland where economic incentives are missing, and competing sources of energy are cheap.
| Pellets in Finland | ||
|---|---|---|
| Year | GWh | tonnes |
| 2001 | 71 | 15 000 |
| 2002 | 114 | 24 000 |
| 2003 | 183 | 39 000 |
| 2004 | 221 | 47 000 |
| 2005 | 257 | 55 000 |
| 2006 | 411 | 87 000 |
| 2007 | ? | 100 000 |
Pellet production was 192,000 tons (2005). Pellet consumption was 55,000 t (2005), 47,000 t (2004), 39,000 t (2003), 24,000 t (2002) ja 15,000 t (2001). The pellets are mainly exported. Finland has no binding objectives for pellet use promotion.[7]
Automotive fuels
.jpg)
The European Union has the objective of 5.75% of biofuels (2010). The biofuels report do not include the Finnish objective.[15] They are not published yet. The Finnish Ministry of Trade and Industry report (KTM 11/2006) admits that Finland would not be able to fulfill the 5.75% objective. The ministry report does not recommend it, because of its expenses. The production price of biofuels in Finland would be equal to other EU countries, 3 cents per liter.[16]
The Finnish parliament did not consider bioethanol competitive in Finland. The director of Altia resigned as Altia's major bioethanol project failed; increased costs made it unprofitable. However, St1 produces bioethanol from food industry wastes.
Neste Oil produces 0.34 million tons per year renewable diesel (NExBTL) by vegetable oil refining in its Porvoo refinery. Currently the main feedstock is palm oil. The public transportation in the Helsinki metropolitan area uses NExBTL. The pulp and paper company UPM is in the process of starting biodiesel production from tall oil. However, a number of projects for biodiesel production have been cancelled due to poor profitability.[17] Finnish government supports biodiesel use financially.[18]
Biodiesel
Finnish company Neste Oil biodiesel production capacity in Singapore is 2.9 million tons. After 2022, the new capacity is predicted to be 1.3 million tons more. Neste oil predicts that the world biodiesel demand will be 20 million tons in 2030, and its own production will be half of this. Neste believes there will be an increased demand for airplane fuels. A 10 to 15 percent increase in biodiesel demand in Europe and the US would be equal to 8-12 million tons fuel per year. In 2019, annual fossil biodiesel consumption is estimated to be as much as 900 million tons. According to McKinsey, the fossil biodiesel consumption will not reduce by 2030.[19]
Neste biodiesel is mainly based on palm oil process wastes. Finland has classified palm oil fatty acid residues as sustainable. The WWF approves certified palm oil. In Europe at least, Sweden, Norway, Britain and France do not approve palm oil fatty acid residues (PFAD) as waste and sustainable bioenergy. According to Greenpeace, its use accelerates deforestation.[20]
The palm oil biodiesel has higher climate change gas emissions compared to fossil diesel when the rain forest loss is included and palm oil fat should not be classified as sustainable waste. It is a product sold in markets as raw material. According to Neste, spoil advertisement palm oil biodiesel production chain includes crimes, corruption and human right violations. One of the Neste Oil palm oil providers Bilmar is responsible in rain forest deforestation. [21]
Hydro power
The second largest source of renewable energy after bioenergy is hydropower, most of which is large-scale production (90%). The total capacity amounts to 3,000 MW, of which 300 MW is small-scale. There are numerous old dams and abandoned small hydropower stations once operated as power sources for mills and saw mills. Therefore, there is potential for increased small-scale production. In a larger scale there remain some potential unharnessed sites. However, environmental concerns limit the possibility of building new capacity.
Wind power
| Wind power in Finland[22] | ||||
|---|---|---|---|---|
| Year | MW | GWh | ||
| 1990 | 0 | 0 | ||
| 1991 | 1 | 1 | ||
| 1992 | 1 | 2 | ||
| 1993 | 5 | 4 | ||
| 1994 | 5 | 5 | ||
| 1995 | 6 | 11 | ||
| 1996 | 7 | 11 | ||
| 1997 | 12 | 17 | ||
| 1998 | 17 | 24 | ||
| 1999 | 38 | 49 | ||
| 2000 | 38 | 77 | ||
| 2001 | 39 | 70 | ||
| 2002 | 43 | 63 | ||
| 2003 | 52 | 92 | ||
| 2004 | 82 | 120 | ||
| 2005 | 82 | 168 | ||
| 2006 | 86 | 153 | ||
| 2007 | 109 | 188 | ||
| 2008 | 142 | 261 | ||
| 2009 | 147 | 277 | ||
| 2010 | 197 | |||
| 2011 | 199 | 481 | ||
| 2012 | 257 | 492 | ||
| 2013 | 447 | 771 | ||
| 2014 | 627 | 1000 | ||
| 2015 | 1005 | 2400 | ||
| 2016 | 1533 | 3100 | ||
| 2017 | 2044 | 4800 | ||
Wind energy covered 14 % of EU electricity demand in 2018. In Europe Denmark had the highest share 41%, while it was in Sweden 12 % and Finland 6%.[23]
EWEA has predicted that wind power will cover 13-16% of EU electricity consumption with 180 GW capacity (2020).[24] Europe's total installed capacity exceeded 100,000 MW in 2012.
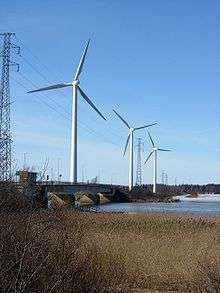
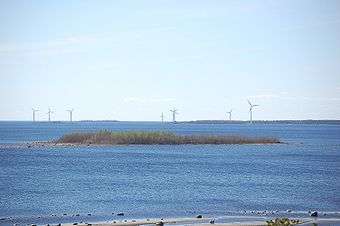
There is relatively little production of wind power in Finland compared to other Nordic countries. Only 1.3% of electricity is produced with wind power in 2014. In 2007 VTT calculated that the national capacity is 107 MW and quickly growing partly due to a 40% government grant on investment costs, preferential taxation and other subsidies. Major wind power potentials have been identified in the fells of Lapland and in coastal areas. Also there is an indigenous industry producing wind power plants and components.
The production capacity of wind power in 2017 is 2044 MW. This is enough to produce about 1.3% of the total electricity consumption. Wind power could produce at least 20–30% of Finland's electricity demand. The capacity 3,500 MW (8 TWh) corresponds 10% of electricity consumption in Finland. Implementation has slowed down by inefficient support systems.[25] The lack of confidence in the stability of electricity and subsidies has prevented the small power companies to build wind power. According to a public opinion survey in the Pori district 97% of the area consumers supported addition of wind power (2000). According to the Finnish Ministry of Trade and Industry the goal of 500 MW of wind power (2010) is not possible in Finland, as it would demand intensive tax reductions that are prohibited by the European Union legislation.[26]
Solar power
Photovoltaics
The PV capacity of Finland was (2006) 4.1 MWp. Solar power in Finland was (1993–1999) 1 GWh, (2000–2004) 2 GWh and (2005) 3 GWh.[27] There has been at least one demonstration project by the YIT Rakennus, NAPS Systems, Lumon and City of Helsinki in 2003. Finland is not a member either in the IEA's Photovoltaic Power Systems Programme or the Scandinavian Photovoltaic Industry Association, SPIA.
Solar heating
The objective in solar heating is 163,000 m2 collector area (1995–2010).[28] In 2006 the collector area in operation was 16,493 m2.[29] Solar heat in Finland was (1997–2004) 4-5 GWh and (2005) 6 GWh.[27] Thus, Finland has installed 10% of its objective in 11 years time (1995–2010). The solar heating has not been competitive due to cheap alternatives (electricity, fuel oil and district heating) and the lack of support systems. Companies and public organizations may receive 40% investment subsidies, but private houses do not receive subsidies yet. The Finnish Solar Industries (FSI) group was established in 2001.[28] 2006/2005 the markets grew 43%. Finland's production capacity is 16,000 m²/a. New installations were: 2,380 m2 (2006), 1,668 m2 (2005) and 1,141 m2 (2004). There are growth opportunities in the solar heating.
Peat
According to European Union and IPCC peat is not biofuel as claimed but have equal CO2 emissions to coal.[30] The EU also promotes the protection of swamps from ecological disasters. The Finnish peat company Vapo Oy is owned by the state (50.1%) and the forest industry company Metsäliitto (49.9%) (including Metsä-Botnia, M-real and Metsä Tissue and previously also Finnforest). They want to use the peat as fuel and dry the swamps as forests.[31] Scandinavian peat was formed 10,000 years ago after the ice age. In 2005 the European common carbon dioxide emission system was agreed, and according to the agreement peat is equal to fossil fuel.[32]
Many peat energy plants can use coal as alternative energy source.[33]
Table: RE of electricity
| Renewable electricity consumption (GWh)[34][35][36] | |||||||||||
|---|---|---|---|---|---|---|---|---|---|---|---|
| Year | Electricity | Non-RE | Non-RE growth % |
RE | RE % | RE without water% |
Water | Wind | Black L | Wood | Other RE |
| 1990 | 62,334 | 45,882 | 0.0 | 16,452 | 26.4 | 9.1 | 10,752 | 0 | |||
| 1991 | 62,288 | 43,371 | -5.5 | 18,917 | 30.4 | 9.4 | 13,066 | 1 | |||
| 1992 | 63,196 | 42,467 | -7.4 | 20,729 | 32.8 | 9.1 | 14,957 | 2 | |||
| 1993 | 65,545 | 45,372 | -1.1 | 20,173 | 30.8 | 10.4 | 13,343 | 4 | |||
| 1994 | 68,257 | 49,238 | 7.3 | 19,019 | 27.9 | 10.8 | 11,663 | 7 | |||
| 1995 | 68,946 | 50,068 | 9.1 | 18,878 | 27.4 | 8.8 | 12,788 | 11 | |||
| 1996 | 70,018 | 51,915 | 13.1 | 18,103 | 25.9 | 9.1 | 11,704 | 11 | |||
| 1997 | 73,603 | 54,334 | 18.4 | 19,269 | 26.2 | 10.2 | 11,795 | 17 | |||
| 1998 | 76,630 | 53,585 | 16.8 | 23,045 | 30.1 | 10.8 | 14,777 | 23 | |||
| 1999 | 77,779 | 56,398 | 22.9 | 21,381 | 27.5 | 11.4 | 12,547 | 49 | |||
| 2000 | 79,158 | 56,482 | 23.1 | 22,676 | 28.6 | 10.4 | 14,453 | 77 | 5,126 | 2,920 | 101 |
| 2001 | 81,188 | 60,301 | 31.4 | 20,887 | 25.7 | 9.7 | 13,018 | 70 | 4,765 | 2,886 | 149 |
| 2002 | 83,542 | 64,377 | 40.3 | 19,165 | 22.9 | 10.2 | 10,623 | 63 | 5,140 | 3,194 | 144 |
| 2003 | 85,229 | 66,871 | 44.7 | 18,358 | 21.5 | 10.4 | 9,455 | 92 | 5,255 | 3,389 | 189 |
| 2004 | 87,041 | 62,239 | 35.7 | 24,802 | 28.5 | 11.4 | 14,865 | 120 | 5,779 | 3,827 | 210 |
| 2005** | 84,672 | 62,086 | 35.3 | 22,586 | 26.7 | 10.8 | 13,430 | 172 | 5,060 | 3,649 | 281 |
| 2006 | 90,024 | 68,355 | 49.0 | 21,670 | 24.1 | 11.5 | 11,313 | 153 | 5,900 | 4,073 | 231 |
| 2007 | 90,374 | 66,779 | 45.5 | 23,595 | 26.1 | 10.6 | 13,991 | 188 | 5,719 | 3,419 | 274 |
| 2008 | 87,247 | 60,277 | 31.4 | 26,970 | 30.9 | 11.5 | 16,909 | 261 | 5,250 | 4,346 | 280 |
| 2009* | 80,795 | 59,895 | 30.5% | 20,900 | 25.9% | 10.3% | 12,564 | 276 | 8,100*** | ||
| * = preliminary information, ** = decline based on the forest industry strike, RE = Renewable energy, Black L=Black liquor ***=no detailed info | |||||||||||
Table: RE of total energy
The renewable energy of primary energy was 24.0% (2005) and 24.1% (2004). Total primary energy supply was 392,022 (2005) and 418,672 GWh (2004). The primary energy includes in addition to the energy consumption also e.g. the heating up of the Baltic Sea by the nuclear power plant waste heat.
| Renewable energy of energy consumption GWh[34][37][38] | ||||||||||
|---|---|---|---|---|---|---|---|---|---|---|
| Year | Energy | Non-RE growth % |
RE | RE % | Wood | Water | Wind | Other* | ||
| 1990 | 317,321 | 0% | 57,895 | 18.2 | 46,450 | 10,752 | 0 | 693 | ||
| 1991 | 312,743 | -1.8% | 57,889 | 18.5 | 44,064 | 13,066 | 1 | 758 | ||
| 1992 | 309,616 | -4.0% | 60,491 | 19.5 | 44,768 | 14,957 | 2 | 764 | ||
| 1993 | 319,025 | -1.8% | 64,275 | 20.1 | 50,132 | 13,339 | 4 | 800 | ||
| 1994 | 340,946 | 5.0% | 68,515 | 20.1 | 56,044 | 11,662 | 7 | 802 | ||
| 1995 | 334,853 | 1.6% | 71,397 | 21.3 | 57,650 | 12,788 | 11 | 948 | ||
| 1996 | 349,424 | 7.0% | 71,847 | 20.6 | 59,107 | 11,704 | 11 | 1,025 | ||
| 1997 | 359,309 | 8.1% | 78,790 | 21.9 | 65,877 | 11,795 | 17 | 1,101 | ||
| 1998 | 364,033 | 7.6% | 84,941 | 23.3 | 68,788 | 14,777 | 23 | 1,353 | ||
| 1999 | 372,798 | 9.0% | 89,947 | 24.1 | 75,781 | 12,547 | 49 | 1,570 | ||
| 2000 | 367,600 | 6.8% | 90,636 | 24.7 | 74,364 | 14,453 | 77 | 1,742 | ||
| 2001 | 380,769 | 12.9% | 87,762 | 23.0 | 72,573 | 13,018 | 70 | 2,101 | ||
| 2002 | 392,116 | 16.0% | 91,209 | 23.3 | 78,275 | 10,623 | 63 | 2,248 | ||
| 2003 | 413,478 | 23.8% | 92,200 | 22.3 | 79,903 | 9,455 | 92 | 2,750 | ||
| 2004 | 412,040 | 19.5% | 102,113 | 24.8 | 83,961 | 14,865 | 120 | 3,167 | ||
| 2005** | 381,568 | 10.3% | 95,434 | 25.0 | 78,036 | 13,428 | 168 | 3,802 | ||
| 2006 | 417,021 | 21.0% | 103,213 | 24.8 | 87,534 | 11,313 | 153 | 4,212 | ||
| 2007 | 410,273 | 18.4% | 103,063 | 25.1 | 83,929 | 13,991 | 188 | 4,936 | ||
| 2008 | 392,776 | 9.4% | 109,015 | 27.8 | 83,929 | 16,909 | 261 | 7,916 | ||
| 2009* | 369,837 | 5.9% | 95,116 | 25.7 | 72,722 | 12,564 | 276 | 9,554 | ||
| RE = Renewable Energy, Non-RE = Non-renewable energy + import, Wood = Black liquor, industry and small scale wood fuels, * = Preliminary information 2009, ** = decline based on long forest industry strike in 2005 Other RE 2006 (GWh): Heat pumps – electricity 2,397, Recycled fuel 1,062, Biogas 424, Other Bioenergy 252, Biofuel 10, Solar power 11 | ||||||||||
In the table is the contribution of RE to electricity production for the EU-25 by 2020.
See also
- Solar energy in Finland
- Wind power in Finland
- List of renewable energy topics by country
- List of countries by carbon dioxide emissions per capita
- Electricity sector in Finland
- Energy in Finland
- Finland National Renewable Energy Action Plan
- Renewable energy in Norway
- Renewable energy in Sweden
- Renewable energy in Denmark
- Renewable energy in the European Union
- Renewable energy by country
References
- "Eurostat, News release, Feb 2016".
- "European Commission, Energy, 2015 Progress Reports, Finland".
- Finland – 2018 update Bioenergy policies and status of implementation IEA
- Sweden – 2018 update Bioenergy policies and status of implementation IEA
- Kasvua, Vanacker! Talouselämä 2/2019 pages 36-41
- VTT Technical Research Centre of Finland, 2002. Renewable Energy Resources in Finland. OPET Report 9.
- Energy statistics 2006, Finnish statistical center, Tilastokeskus, energiatilasto, Vuosikirja 2006.
- Greenhouse gas emissions in Finland 1990-2005 Archived 2010-11-16 at the Wayback Machine National Inventory Report to the UNFCCC 15.4.2007, Finnish statistics
- 2005: Record year for investments in renewable energy REN21 Archived 2009-03-18 at the Wayback Machine"Renewables Global Status Report 2006 Update", REN21. 2006. (Paris: REN21 Secretariat and Washington, D.C.:Worldwatch Institute).
- Highlights from Greenhouse Gas (GHG) Emission Data for 1990-2004 United Nations Convention on Climate Change
- Global Wind 2006 Report Global Wind Energy Council GWEG page 16
- Helsingin Sanomat 25.2.2013 opinion page C6, WWF statement
- Energy statistics 2007, Finnish statistical center, December 2007, T1.1 Total Energy Consumption, T2.8 RE (electricity), T3.1 and T3.3 Electricity Supply, T 2.9 Wood Fuels (Wood pellets)
- Statistics for pellet consumption in 2007 Available on www.pelletatlas.info
- Biofuels Progress Report Archived 2007-03-22 at the Wayback Machine
- Liikenteen biopolttoaineiden tuotannon ja käytön edistäminen Suomessa Työryhmän mietintö KTM 11/2006, 132 s
- http://yle.fi/uutiset/kotimaisen_biodieselin_valmistus_yskii/6276902
- Pääkaupunkiseudun busseissa kokeillaan biopolttoainetta, YLE 27.9.2007
- Kasvua, Vanacker! Talouselämä 2/2019 pages 36-41
- Kasvua, Vanacker! Talouselämä 2/2019 pages 36-41
- Greenpeace Neste Spoil : included in Voima 10/2018
- VTT (2010)
- Wind energy in Europe in 2018 - Trends and statistics
- European Wind Industry calls for swift and effective legislation press release, EWEA 15.2 2007
- Faktaa tuulivoimasta –esite Finnish Wind Power Association, 2/2005
- Lähiajan energia- ja ilmastopolitiikan linjauksia - kansallinen strategia Kioton Valtioneuvoston selonteko eduskunnalle 30.11.2005, Finnish Ministry of Trade and Industry 26/2005. p. 70.
- Energy Statistics Yearbook 2006, Official Statistics of Finland (GWh)
- ESTIF Sun in Action II – A Solar Thermal Strategy for Europe, vol. 2 Archived 2007-09-28 at the Wayback Machine The Solar Thermal Sector Country by Country, 21 National Reports, 348 s., 4/2003
- Solar Thermal Markets in Europe (Trends and market statistics 2006) Archived 2007-09-28 at the Wayback Machine 6/2007
- 2006 IPCC Guidelines for National Greenhouse Gas Inventories Intergovernmental Panel on Climate Change
- Heikkilä, R.; Lindholm, T.; & Simola, H. (2007) Keskustelua: Turvetta suosiva energiapolitiikka perustuu kyseenalaiseen tutkimusraporttiin Tieteessä tapahtuu 3/2007
- Energiläget 2006 Energimyndigheten pages 49-50, (in Swedish)
- Pula turpeesta ajaa kivihiilen käyttöön HS 26.2.2013 B8
- Preliminary Energy Statistics 2009 Finnish statistical center 24.3.2010, (Energiaennakko 2009 - taulukot Excel).
- Sähkön ja lämmön tuotanto tuotantomuodoittain ja polttoaineittain 2000-2007 (Excel) 26.9.2008, (Production of electricity and heat by energy sources and mode of production): Black L, Wood and other RE 2000-2007
- Production of electricity and heat by energy sources and mode of production 2008: Black L, Wood and other RE 2008
- Energiatilasto vuosikirja 2007, Tilastokeskus joulukuu 2007
- Energiatilasto vuosikirja 2008, Tilastokeskus helmikuu 2009
External links
| Wikimedia Commons has media related to Renewable energy in Finland. |
- Ministry of Employment and the Economy, Renewable Energy Sources
- Climate Change and Energy Strategy 2008 summary
- Bioenergy in Finland
- Database of renewable energy in Finland
- European Commission, Energy, 2015 Progress Reports, Finland
- European Commission National Renewable Energy Action Plans
- European Commission National Energy Efficiency Energy Action Plans
| Africa |
| ||||
|---|---|---|---|---|---|
| Asia | |||||
| Europe |
| ||||
| North America | |||||
| Oceania | |||||
| South America | |||||
| |||||