Pourbaix diagram
In electrochemistry, a Pourbaix diagram, also known as a potential/pH diagram, EH-pH diagram or a pE/pH diagram, maps out possible stable (equilibrium) phases of an aqueous electrochemical system. Predominant ion boundaries are represented by lines. As such a Pourbaix diagram can be read much like a standard phase diagram with a different set of axes. Similarly to phase diagrams, they do not allow for reaction rate or kinetic effects. Beside potential and pH, the equilibrium concentrations are also dependent upon, e.g., temperature, pressure, and concentration. Pourbaix diagrams are commonly given at room temperature, atmospheric pressure, and molar concentrations of 10−6 and changing any of these parameters will yield a different diagram.

The diagrams are named after Marcel Pourbaix (1904–1998), the Russian-born Belgian chemist who invented them.
Diagram
Pourbaix diagrams are also known as EH-pH diagrams due to the labeling of the two axes. The vertical axis is labeled EH for the voltage potential with respect to the standard hydrogen electrode (SHE) as calculated by the Nernst equation. The "H" stands for hydrogen, although other standards may be used, and they are for room temperature only.

where volt is the thermal voltage or the "Nernst slope" at standard temperature and λ = ln(10), so that volt. The horizontal axis is labeled pH for the −log function of the H+ ion activity.


The lines in the Pourbaix diagram show the equilibrium conditions, that is, where the activities are equal, for the species on each side of that line. On either side of the line, one form of the species will instead be said to be predominant.[3]
In order to draw the position of the lines with the Nernst equation, the activity of the chemical species at equilibrium must be defined. Usually, the activity of a species is approximated as equal to the concentration (for soluble species) or partial pressure (for gases). The same values should be used for all species present in the system.[3]
For soluble species, the lines are often drawn for concentrations of 1 M or 10−6 M. Sometimes additional lines are drawn for other concentrations.
If the diagram involves the equilibrium between a dissolved species and a gas, the pressure is usually set to P0 = 1 atm = 101325 Pa, the minimum pressure required for gas evolution from an aqueous solution at standard conditions.[3]
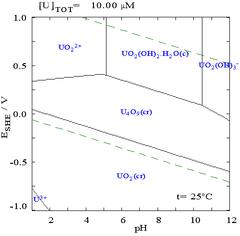
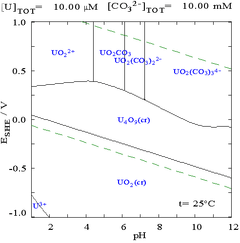
While such diagrams can be drawn for any chemical system, it is important to note that the addition of a metal binding agent (ligand) will often modify the diagram. For instance, carbonate has a great effect upon the diagram for uranium. (See diagrams at right). The presence of trace amounts of certain species such as chloride ions can also greatly affect the stability of certain species by destroying passivating layers.
In addition, changes in temperature and concentration of solvated ions in solution will shift the equilibrium lines in accordance with the Nernst equation.
The diagrams also do not take kinetic effects into account, meaning that species shown as unstable might not react to any significant degree in practice.
A simplified Pourbaix diagram indicates regions of "immunity", "corrosion" and "passivity", instead of the stable species. They thus give a guide to the stability of a particular metal in a specific environment. Immunity means that the metal is not attacked, while corrosion shows that general attack will occur. Passivation occurs when the metal forms a stable coating of an oxide or other salt on its surface, the best example being the relative stability of aluminium because of the alumina layer formed on its surface when exposed to air.
Calculation of a Pourbaix diagram
For the simple case of a thermodynamic system consisting of a metal (M) and water, various reaction equations may be written having the form:

where r1 and r2 are any reactants involving M, hydrogen and oxygen. The equation must be balanced for M, H, O and charge. A standard Gibbs free energy is associated with each equation. A base-balanced equation can be converted to an acid-balanced equation using the equilibrium constant for the self-ionization of water, and only acid-balanced equations are considered below.

In the following, the Nernst slope (or thermal voltage) is used, which has a value of 0.02569... V at STP. When base-10 logarithms are used, VT λ = 0.05916... V at STP where λ=ln[10]. There are three types of line boundaries in a Pourbaix diagram: Vertical, horizontal, and sloped.[4][5]

Vertical boundary line
When no electrons are exchanged (n=0), the equilibrium between r1 and r2 is not affected by electrode potential, and the boundary line will be a vertical line with a particular value of pH. The reaction equation may be written:

and the energy balance is written as where K is the equilibrium constant: . Thus:


or, in base-10 logarithms,

which may be solved for the particular value of pH.
For example[4] consider the iron and water system, and the equilibrium line between the ferric ion Fe3+ ion and hematite Fe2O3. The reaction equation is:

which has .[4] The pH of the vertical line on the Pourbaix diagram is then found to be:


At STP, for [Fe3+] = 10−6, [Fe2O3]= [H2O]=1, this yields pH=1.76.
Horizontal boundary line
When H+ and OH− ions are not involved, the boundary line is horizontal, independent of pH. The reaction equation is written:

The energy balance is

Using the definition of electrode potential ∆G=-F E this may be rewritten as a Nernst equation:

or, using base-10 logarithms:

For the iron and water example, consider the boundary line between Fe2+ and Fe3+ . The reaction equation is:

and since electrons are involved, it has Eo=0.771 V[6] and since H+ ions are not involved, it is independent of pH. As a function of temperature,

For both ionic species at at STP, and the boundary will be a horizontal line at Eh=0.771 volts. This will vary with temperature.


Sloped boundary line
In this case, both electrons and H+ ions are involved and the electrode potential is a function of pH. The reaction equation may be written:

Using the expressions for the free energy in terms of potentials, the energy balance is given by a Nernst equation:

For the iron and water example, consider the boundary line between the ferrous ion Fe2+ and hematite Fe2O3. The reaction equation is found to be:

with .[4] The equation of the boundary line, expressed in base-10 logarithms will be:


For [Fe2O3]=[H2O]=1 and [Fe2+]=10−6, this yields Eh=1.0826 - 0.1775 pH.
The stability region of water

In many cases, the possible conditions in a system are limited by the stability region of water. In the Pourbaix diagram for uranium, the limits of stability of water are marked by the two dashed green lines, and the stability region for water falls between these lines.
Under highly reducing conditions (low EH/pE) water will be reduced to hydrogen according to[3]

or

Using the Nernst equation, setting E0 = 0 V and the hydrogen gas fugacity (corresponding to activity) at 1, the equation for the lower stability line of water in the Pourbaix diagram will be:

at standard temperature and pressure. Below this line, water will be reduced to hydrogen, and it will usually not be possible to pass beyond this line as long as there is still water present to be reduced.
Correspondingly, under highly oxidizing conditions (high EH/pE) water will be oxidized to oxygen gas according to[3]

Using the Nernst equation as above, but with an E0 =-ΔG0H2O/2F = 1.229 V, gives an upper stability limit of water at

at standard temperature and pressure. Above this line, water will be oxidized to form oxygen gas, and it will usually not be possible to pass beyond this line as long as there is still water present to be oxidized.
Uses
Pourbaix diagrams have several uses, for example, in corrosion studies, geoscience and in environmental studies. Using the Pourbaix diagram correctly will help shed light not only on the nature of the species present in the solution (or sample) but may also help to understand the reaction mechanism.[7]
In environmental chemistry
Pourbaix diagrams are widely used to describe the chemical behaviour of chemical species in the hydrosphere. In these cases, reduction potential pE is used instead of EH.[3] pE is a dimensionless number and can easily be related to EH by the equation

pE values in environmental chemistry ranges from −12 to +25, since at low or high potentials water will be respectively reduced or oxidized. In environmental applications, the concentration of dissolved species is usually set to a value between 10−2 M and 10−5 M for the creation of the equilibrium lines.
References
- "Western Oregon University".
- . Ignasi Puigdomenech, Hydra/Medusa Chemical Equilibrium Database and Plotting Software (2004) KTH Royal Institute of Technology, freely downloadable software at "Archived copy". Archived from the original on 2007-09-29. Retrieved 2007-09-29.CS1 maint: archived copy as title (link)
- van Loon, Gary; Duffy, Stephen (2011). Environmental Chemistry – a global perspective (3rd ed.). Oxford University Press. pp. 235–248. ISBN 978-0-19-922886-7.
- Verink, E.D. Jr. "Simplified Procedure for Constructing Pourbaix Diagrams" (PDF). Retrieved 2017-03-29.
- Kopeliovich, Dimitri. "Pourbaix Diagrams". SubsTech. Retrieved 2017-03-29.
- "Chemistry of Iron in Natural Water" (PDF). Geological Survey Water-Supply Paper 1459. 1962. Retrieved 2017-03-29.
- Noyhouzer T., Bellemare-Alford D., Payne N. A., Martineau E. and Mauzeroll J., Unfolding the Hidden Reactions in Galvanic Cells, Electrocatalysis, 2018, doi:10.1007/s12678-018-0459-1.
- Brookins, D. G., Eh-pH Diagrams for Geochemistry. 1988, Springer-Verlag, ISBN 0-387-18485-6
- Denny A. Jones, Principles and Prevention of Corrosion, 2nd edition, 1996, Prentice Hall, Upper Saddle River, NJ. ISBN 0-13-359993-0 Page 50-52
- Pourbaix, M., Atlas of electrochemical equilibria in aqueous solutions. 2d English ed. 1974, Houston, Tex.: National Association of Corrosion Engineers.
- Takeno, Naoto (May 2005). Atlas of Eh-pH diagrams (Intercomparison of thermodynamic databases) (PDF) (Report). Tsukuba, Ibaraki, Japan: National Institute of Advanced Industrial Science and Technology - Research Center for Deep Geological Environments. Retrieved 2017-05-16.
External links
| Wikimedia Commons has media related to Pourbaix diagrams. |
- Marcel Pourbaix — Corrosion Doctors
- DoITPoMS Teaching and Learning Package- "The Nernst Equation and Pourbaix Diagrams"
Software
- ChemEQL Free software for calculation of chemical equilibria from Eawag.
- FactSage Commercial thermodynamic databank software, also available in a free web application.
- The Geochemist's Workbench Commercial geochemical modeling software from Aqueous Solutions LLC.
- GWB Student Edition Free student edition of the popular geochemical modeling software package.
- HYDRA/MEDUSA Free software for creating chemical equilibrium diagrams from the KTH Department of Chemistry.
- HSC Chemistry Commercial thermochemical calculation software from Outotec Oy.
- PhreePlot Free program for making geochemical plots using the USGS code PHREEQC.
- Thermo-Calc Windows Commercial software for thermodynamic calculations from Thermo-Calc Software.
- Materials Project Public website that can generate Pourbaix diagrams from a large database of computed material properties, hosted at NERSC.