Oil spill
An oil spill is the release of a liquid petroleum hydrocarbon into the environment, especially the marine ecosystem, due to human activity, and is a form of pollution. The term is usually given to marine oil spills, where oil is released into the ocean or coastal waters, but spills may also occur on land. Oil spills may be due to releases of crude oil from tankers, offshore platforms, drilling rigs and wells, as well as spills of refined petroleum products (such as gasoline, diesel) and their by-products, heavier fuels used by large ships such as bunker fuel, or the spill of any oily refuse or waste oil.

Oil spills penetrate into the structure of the plumage of birds and the fur of mammals, reducing its insulating ability, and making them more vulnerable to temperature fluctuations and much less buoyant in the water. Cleanup and recovery from an oil spill is difficult and depends upon many factors, including the type of oil spilled, the temperature of the water (affecting evaporation and biodegradation), and the types of shorelines and beaches involved.[1] Spills may take weeks, months or even years to clean up.[2]
Oil spills can have disastrous consequences for society; economically, environmentally, and socially. As a result, oil spill accidents have initiated intense media attention and political uproar, bringing many together in a political struggle concerning government response to oil spills and what actions can best prevent them from happening.[3]
Largest oil spills
Crude oil and refined fuel spills from tanker ship accidents have damaged vulnerable ecosystems in Alaska, the Gulf of Mexico, the Galapagos Islands, France, the Sundarbans, Ogoniland, and many other places. The quantity of oil spilled during accidents has ranged from a few hundred tons to several hundred thousand tons (e.g., Deepwater Horizon Oil Spill, Atlantic Empress, Amoco Cadiz),[4] but volume is a limited measure of damage or impact. Smaller spills have already proven to have a great impact on ecosystems, such as the Exxon Valdez oil spill because of the remoteness of the site or the difficulty of an emergency environmental response.
Since 2004, between 300 and 700 barrels of oil per day have been leaking from the site of an oil-production platform 12 miles off the Louisiana coast which sank in the aftermath of Hurricane Ivan. The oil spill, which officials estimate could continue throughout the 21st century, will eventually overtake the 2010 BP Deepwater Horizion disaster as the largest ever, but there are currently no efforts to cap the many leaking well heads.[5]
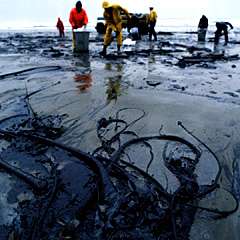
Oil spills at sea are generally much more damaging than those on land, since they can spread for hundreds of nautical miles in a thin oil slick which can cover beaches with a thin coating of oil. These can kill seabirds, mammals, shellfish and other organisms they coat. Oil spills on land are more readily containable if a makeshift earth dam can be rapidly bulldozed around the spill site before most of the oil escapes, and land animals can avoid the oil more easily.
| Spill / Tanker | Location | Date | Tonnes of crude oil (thousands)[lower-alpha 1] | Barrels (thousands) | US Gallons (thousands) | References |
|---|---|---|---|---|---|---|
| Kuwaiti Oil Fires[lower-alpha 2] | Kuwait | January 16, 1991 – November 6, 1991 | 136,000 | 1,000,000 | 42,000,000 | [6][7] |
| Kuwaiti Oil Lakes [lower-alpha 3] | Kuwait | January 1991 – November 1991 | 3,409–6,818 | 25,000–50,000 | 1,050,000–2,100,000 | [8][9][10] |
| Lakeview Gusher | Kern County, California, USA | March 14, 1910 – September 1911 | 1,200 | 9,000 | 378,000 | [11] |
| Gulf War oil spill [lower-alpha 4] | Kuwait, Iraq, and the Persian Gulf | January 19, 1991 – January 28, 1991 | 818–1,091 | 6,000–8,000 | 252,000–336,000 | [9][13][14] |
| Deepwater Horizon | United States, Gulf of Mexico | April 20, 2010 – July 15, 2010 | 560–585 | 4,100–4,900 | 189,000–231,000 | [15][16][17][18][19] |
| Ixtoc I | Mexico, Gulf of Mexico | June 3, 1979 – March 23, 1980 | 454–480 | 3,329–3,520 | 139,818–147,840 | [20][21][22] |
| Atlantic Empress / Aegean Captain | Trinidad and Tobago | July 19, 1979 | 287 | 2,105 | 88,396 | [23][24][25] |
| Fergana Valley | Uzbekistan | March 2, 1992 | 285 | 2,090 | 87,780 | [26] |
| Nowruz Field Platform | Iran, Persian Gulf | February 4, 1983 | 260 | 1,900 | 80,000 | [27] |
| ABT Summer | Angola, 700 nmi (1,300 km; 810 mi) offshore | May 28, 1991 | 260 | 1,907 | 80,080 | [23] |
| Castillo de Bellver | South Africa, Saldanha Bay | August 6, 1983 | 252 | 1,848 | 77,616 | [23] |
| Amoco Cadiz | France, Brittany | March 16, 1978 | 223 | 1,635 | 68,684 | [23][26][26][28][29] |
| Taylor Energy | United States, Gulf of Mexico | September 23, 2004 – Present | 210–490 | 1,500–3,500 | 63,000–147,000 | [30] |
| Torrey Canyon | England, Cornwall | March 18, 1967 | 119 | 872 | 36,635 | [31] |
- One metric ton (tonne) of crude oil is roughly equal to 308 US gallons or 7.33 barrels approx.; 1 oil barrel (bbl) is equal to 35 imperial or 42 US gallons. Approximate conversion factors. Archived 2014-06-21 at the Wayback Machine
- Estimates for the amount of oil burned in the Kuwaiti Oil Fires range from 500,000,000 barrels (79,000,000 m3) to nearly 2,000,000,000 barrels (320,000,000 m3). Between 605 and 732 wells were set ablaze, while many others were severely damaged and gushed uncontrolled for several months. It took over ten months to bring all of the wells under control. The fires alone were estimated to consume approximately 6,000,000 barrels (950,000 m3) of oil per day at their peak.
- Oil spilled from sabotaged fields in Kuwait during the 1991 Persian Gulf War pooled in approximately 300 oil lakes, estimated by the Kuwaiti Oil Minister to contain approximately 25,000,000 to 50,000,000 barrels (7,900,000 m3) of oil. According to the U.S. Geological Survey, this figure does not include the amount of oil absorbed by the ground, forming a layer of "tarcrete" over approximately five percent of the surface of Kuwait, fifty times the area occupied by the oil lakes.[8]
- Estimates for the Gulf War oil spill range from 4,000,000 to 11,000,000 barrels (1,700,000 m3). The figure of 6,000,000 to 8,000,000 barrels (1,300,000 m3) is the range adopted by the U.S. Environmental Protection Agency and the United Nations in the immediate aftermath of the war, 1991–1993, and is still current, as cited by NOAA and The New York Times in 2010.[12] This amount only includes oil discharged directly into the Persian Gulf by the retreating Iraqi forces from January 19 to 28, 1991. However, according to the U.N. report, oil from other sources not included in the official estimates continued to pour into the Persian Gulf through June, 1991. The amount of this oil was estimated to be at least several hundred thousand barrels, and may have factored into the estimates above 8,000,000 barrels (1,300,000 m3).
Human impact
An oil spill represents an immediate fire hazard. The Kuwaiti oil fires produced air pollution that caused respiratory distress. The Deepwater Horizon explosion killed eleven oil rig workers.[32] The fire resulting from the Lac-Mégantic derailment killed 47 and destroyed half of the town's centre.
Spilled oil can also contaminate drinking water supplies. For example, in 2013 two different oil spills contaminated water supplies for 300,000 in Miri, Malaysia;[33] 80,000 people in Coca, Ecuador.[34] In 2000, springs were contaminated by an oil spill in Clark County, Kentucky.[35]
Contamination can have an economic impact on tourism and marine resource extraction industries. For example, the Deepwater Horizon oil spill impacted beach tourism and fishing along the Gulf Coast, and the responsible parties were required to compensate economic victims.
Environmental effects
The threat posed to birds, fish, shellfish and crustaceans from spilled oil was known in England in the 1920s, largely through observations made in Yorkeshire.[36]
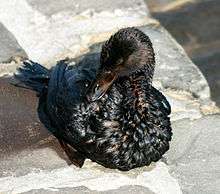
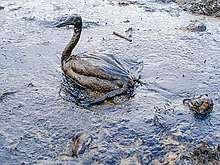
In general, spilled oil can affect animals and plants in two ways: dirесt from the oil and from the response or cleanup process.[37][38] There is no clear relationship between the amount of oil in the aquatic environment and the likely impact on biodiversity. A smaller spill at the wrong time/wrong season and in a sensitive environment may prove much more harmful than a larger spill at another time of the year in another or even the same environment.[39] Oil penetrates into the structure of the plumage of birds and the fur of mammals, reducing their insulating ability, and making them more vulnerable to temperature fluctuations and much less buoyant in the water.
Animals who rely on scent to find their babies or mothers cannot due to the strong scent of the oil. This causes a baby to be rejected and abandoned, leaving the babies to starve and eventually die. Oil can impair a bird's ability to fly, preventing it from foraging or escaping from predators. As they preen, birds may ingest the oil coating their feathers, irritating the digestive tract, altering liver function, and causing kidney damage. Together with their diminished foraging capacity, this can rapidly result in dehydration and metabolic imbalance. Some birds exposed to petroleum also experience changes in their hormonal balance, including changes in their luteinizing protein.[40] The majority of birds affected by oil spills die from complications without human intervention.[41][42] Some studies have suggested that less than one percent of oil-soaked birds survive, even after cleaning,[43] although the survival rate can also exceed ninety percent, as in the case of the Treasure oil spill.[44] Oil spills and oil dumping events have been impacting sea birds since at least the 1920s[45][46] and was understood to be a global problem in the 1930s.[47]
Heavily furred marine mammals exposed to oil spills are affected in similar ways. Oil coats the fur of sea otters and seals, reducing its insulating effect, and leading to fluctuations in body temperature and hypothermia. Oil can also blind an animal, leaving it defenseless. The ingestion of oil causes dehydration and impairs the digestive process. Animals can be poisoned, and may die from oil entering the lungs or liver.
There are three kinds of oil-consuming bacteria. Sulfate-reducing bacteria (SRB) and acid-producing bacteria are anaerobic, while general aerobic bacteria (GAB) are aerobic. These bacteria occur naturally and will act to remove oil from an ecosystem, and their biomass will tend to replace other populations in the food chain. The chemicals from the oil which dissolve in water, and hence are available to bacteria, are those in the water associated fraction of the oil.
In addition, oil spills can also harm air quality.[48] The chemicals in crude oil are mostly hydrocarbons that contains toxic chemicals such as benzenes, toluene, poly-aromatic hydrocarbon and oxygenated polycyclic aromatic hydrocarbons. These chemicals can introduce adverse health effects when being inhaled into human body. In addition, these chemicals can be oxidized by oxidants in the atmosphere to form fine particulate matter after they evaporate into the atmosphere.[49] These particulates can penetrate lungs and carry toxic chemicals into the human body. Burning surface oil can also be a source for pollution such as soot particles. During the cleanup and recovery process, it will also generate air pollutants such as nitric oxides and ozone from ships. Lastly, bubble bursting can also be a generation pathway for particulate matter during an oil spill.[50] During the Deepwater Horizon oil spill, significant air quality issues were found on the Gulf Coast, which is the downwind of DWH oil spill. Air quality monitoring data showed that criteria pollutants had exceeded the health-based standard in the coastal regions.[51]
Sources and rate of occurrence
A VLCC tanker can carry 2 million barrels (320,000 m3) of crude oil. This is about eight times the amount spilled in the widely known Exxon Valdez oil spill. In this spill, the ship ran aground and dumped 260,000 barrels (41,000 m3) of oil into the ocean in March 1989. Despite efforts of scientists, managers, and volunteers over 400,000 seabirds, about 1,000 sea otters, and immense numbers of fish were killed.[52] Considering the volume of oil carried by sea, however, tanker owners' organisations often argue that the industry's safety record is excellent, with only a tiny fraction of a percentage of oil cargoes carried ever being spilled. The International Association of Independent Tanker Owners has observed that "accidental oil spills this decade have been at record low levels—one third of the previous decade and one tenth of the 1970s—at a time when oil transported has more than doubled since the mid 1980s."
Oil tankers are just one of the many sources of oil spills. According to the United States Coast Guard, 35.7% of the volume of oil spilled in the United States from 1991 to 2004 came from tank vessels (ships/barges), 27.6% from facilities and other non-vessels, 19.9% from non-tank vessels, and 9.3% from pipelines; 7.4% from mystery spills.[53] On the other hand, only 5% of the actual spills came from oil tankers, while 51.8% came from other kinds of vessels.[53]
The International Tanker Owners Pollution Federation has tracked 9,351 accidental spills that have occurred since 1974.[54] According to this study, most spills result from routine operations such as loading cargo, discharging cargo, and taking on fuel oil.[23] 91% of the operational oil spills are small, resulting in less than 7 metric tons per spill.[23] On the other hand, spills resulting from accidents like collisions, groundings, hull failures, and explosions are much larger, with 84% of these involving losses of over 700 metric tons.[23]
Cleanup and recovery
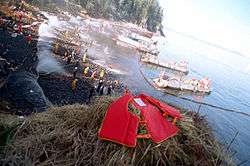
Cleanup and recovery from an oil spill is difficult and depends upon many factors, including the type of oil spilled, the temperature of the water (affecting evaporation and biodegradation), and the types of shorelines and beaches involved.[1] Physical cleanups of oil spills are also very expensive. However, microorganisms such as Fusobacteria species demonstrate potential for future oil spill cleanup because of their ability to colonize and degrade oil slicks on the sea surface.[55]
Methods for cleaning up include:[56]
- Bioremediation: use of microorganisms[57] or biological agents[58] to break down or remove oil; such as Alcanivorax bacteria[59] or Methylocella silvestris.[60]
- Bioremediation Accelerator: a binder molecule that moves hydrocarbons out of water and into gels, when combined with nutrients, encourages natural bioremediation. Oleophilic, hydrophobic chemical, containing no bacteria, which chemically and physically bonds to both soluble and insoluble hydrocarbons. The accelerator acts as a herding agent in water and on the surface, floating molecules such as phenol and BTEX to the surface of the wate, forming gel-like agglomerations. Undetectable levels of hydrocarbons can be obtained in produced water and manageable water columns. By overspraying sheen with bioremediation accelerator, sheen is eliminated within minutes. Whether applied on land or on water, the nutrient-rich emulsion creates a bloom of local, indigenous, pre-existing, hydrocarbon-consuming bacteria. Those specific bacteria break down the hydrocarbons into water and carbon dioxide, with EPA tests showing 98% of alkanes biodegraded in 28 days; and aromatics being biodegraded 200 times faster than in nature they also sometimes use the hydrofireboom to clean the oil up by taking it away from most of the oil and burning it.[61]
- Controlled burning can effectively reduce the amount of oil in water, if done properly.[62] But it can only be done in low wind,[63] and can cause air pollution.[64]
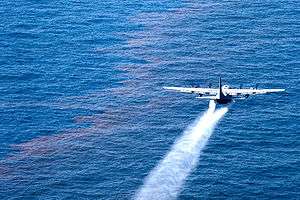
- Dispersants can be used to dissipate oil slicks.[65] A dispersant is either a non-surface active polymer or a surface-active substance added to a suspension, usually a colloid, to improve the separation of particles and to prevent settling or clumping. They may rapidly disperse large amounts of certain oil types from the sea surface by transferring it into the water column. They will cause the oil slick to break up and form water-soluble micelles that are rapidly diluted. The oil is then effectively spread throughout a larger volume of water than the surface from where the oil was dispersed. They can also delay the formation of persistent oil-in-water emulsions. However, laboratory experiments showed that dispersants increased toxic hydrocarbon levels in fish by a factor of up to 100 and may kill fish eggs.[66] Dispersed oil droplets infiltrate into deeper water and can lethally contaminate coral. Research indicates that some dispersants are toxic to corals.[67] A 2012 study found that Corexit dispersant had increased the toxicity of oil by up to 52 times.[68] In 2019, the U.S. National Academies released a report analyzing the advantages and disadvantages of several response methods and tools.[69]
- Watch and wait: in some cases, natural attenuation of oil may be most appropriate, due to the invasive nature of facilitated methods of remediation, particularly in ecologically sensitive areas such as wetlands.[70]
- Dredging: for oils dispersed with detergents and other oils denser than water.
- Skimming: Requires calm waters at all times during the process.
- Solidifying: Solidifiers are composed of tiny, floating, dry ice pellets,[71][72][73] and hydrophobic polymers that both adsorb and absorb. They clean up oil spills by changing the physical state of spilled oil from liquid to a solid, semi-solid or a rubber-like material that floats on water.[38] Solidifiers are insoluble in water, therefore the removal of the solidified oil is easy and the oil will not leach out. Solidifiers have been proven to be relatively non-toxic to aquatic and wildlife and have been proven to suppress harmful vapors commonly associated with hydrocarbons such as benzene, xylene and naphtha. The reaction time for solidification of oil is controlled by the surface area or size of the polymer or dry pellets as well as the viscosity and thickness of the oil layer. Some solidifier product manufacturers claim the solidified oil can be thawed and used if frozen with dry ice or disposed of in landfills, recycled as an additive in asphalt or rubber products, or burned as a low ash fuel. A solidifier called C.I.Agent (manufactured by C.I.Agent Solutions of Louisville, Kentucky) is being used by BP in granular form, as well as in Marine and Sheen Booms at Dauphin Island and Fort Morgan, Alabama, to aid in the Deepwater Horizon oil spill cleanup.
- Vacuum and centrifuge: oil can be sucked up along with the water, and then a centrifuge can be used to separate the oil from the water – allowing a tanker to be filled with near pure oil. Usually, the water is returned to the sea, making the process more efficient, but allowing small amounts of oil to go back as well. This issue has hampered the use of centrifuges due to a United States regulation limiting the amount of oil in water returned to the sea.[74]
- Beach Raking: coagulated oil that is left on the beach can be picked up by machinery.
Equipment used includes:[62]
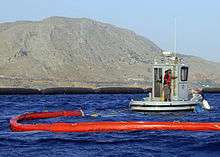
- Booms: large floating barriers that round up oil and lift the oil off the water
- Skimmers: skim the oil
- Sorbents: large absorbents that absorb oil and adsorb small droplets [75]
- Chemical and biological agents: helps to break down the oil
- Vacuums: remove oil from beaches and water surface
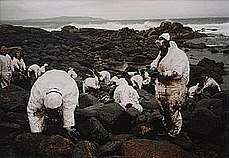
- Shovels and other road equipment: typically used to clean up oil on beaches
Prevention
- Secondary containment – methods to prevent releases of oil or hydrocarbons into environment.
- Oil Spill Prevention Control and Countermeasures (SPCC) program by the United States Environmental Protection Agency.
- Double-hulling – build double hulls into vessels, which reduces the risk and severity of a spill in case of a collision or grounding. Existing single-hull vessels can also be rebuilt to have a double hull.
- Thick-hulled railroad transport tanks.[76]
Spill response procedures should include elements such as;
- A listing of appropriate protective clothing, safety equipment, and cleanup materials required for spill cleanup (gloves, respirators, etc.) and an explanation of their proper use;
- Appropriate evacuation zones and procedures;
- Availability of fire suppression equipment;
- Disposal containers for spill cleanup materials; and
- The first aid procedures that might be required.[77]
Environmental Sensitivity Index (ESI) mapping
Environmental Sensitivity Index (ESI) maps are used to identify sensitive shoreline resources prior to an oil spill event in order to set priorities for protection and plan cleanup strategies.[78][79] By planning spill response ahead of time, the impact on the environment can be minimized or prevented. Environmental sensitivity index maps are basically made up of information within the following three categories: shoreline type, and biological and human-use resources.[80]
Shoreline type
Shoreline type is classified by rank depending on how easy the target site would be to clean up, how long the oil would persist, and how sensitive the shoreline is.[81] The floating oil slicks put the shoreline at particular risk when they eventually come ashore, covering the substrate with oil. The differing substrates between shoreline types vary in their response to oiling, and influence the type of cleanup that will be required to effectively decontaminate the shoreline. In 1995, the US National Oceanic and Atmospheric Administration extended ESI maps to lakes, rivers, and estuary shoreline types.[80] The exposure the shoreline has to wave energy and tides, substrate type, and slope of the shoreline are also taken into account—in addition to biological productivity and sensitivity. The productivity of the shoreline habitat is also taken into account when determining ESI ranking.[82] Mangroves and marshes tend to have higher ESI rankings due to the potentially long-lasting and damaging effects of both the oil contamination and cleanup actions. Impermeable and exposed surfaces with high wave action are ranked lower due to the reflecting waves keeping oil from coming onshore, and the speed at which natural processes will remove the oil.
Biological resources
Habitats of plants and animals that may be at risk from oil spills are referred to as "elements" and are divided by functional group. Further classification divides each element into species groups with similar life histories and behaviors relative to their vulnerability to oil spills. There are eight element groups: Birds, Reptiles, Amphibians, Fish, Invertebrates, Habitats and Plants, Wetlands, and Marine Mammals and Terrestrial Mammals. Element groups are further divided into sub-groups, for example, the ‘marine mammals’ element group is divided into dolphins, manatees, pinnipeds (seals, sea lions & walruses), polar bears, sea otters and whales.[80][82] Problems taken into consideration when ranking biological resources include the observance of a large number of individuals in a small area, whether special life stages occur ashore (nesting or molting), and whether there are species present that are threatened, endangered or rare.[83]
Human-use resources
Human use resources are divided into four major classifications; archaeological importance or cultural resource site, high-use recreational areas or shoreline access points, important protected management areas, or resource origins.[80][83] Some examples include airports, diving sites, popular beach sites, marinas, natural reserves or marine sanctuaries.
Estimating the volume of a spill
By observing the thickness of the film of oil and its appearance on the surface of the water, it is possible to estimate the quantity of oil spilled. If the surface area of the spill is also known, the total volume of the oil can be calculated.[84]
| Film thickness | Quantity spread | ||||
|---|---|---|---|---|---|
| Appearance | inches | mm | nm | gal/sq mi | L/ha |
| Barely visible | 0.0000015 | 0.0000380 | 38 | 25 | 0.370 |
| Silvery sheen | 0.0000030 | 0.0000760 | 76 | 50 | 0.730 |
| First trace of color | 0.0000060 | 0.0001500 | 150 | 100 | 1.500 |
| Bright bands of color | 0.0000120 | 0.0003000 | 300 | 200 | 2.900 |
| Colors begin to dull | 0.0000400 | 0.0010000 | 1000 | 666 | 9.700 |
| Colors are much darker | 0.0000800 | 0.0020000 | 2000 | 1332 | 19.500 |
Oil spill model systems are used by industry and government to assist in planning and emergency decision making. Of critical importance for the skill of the oil spill model prediction is the adequate description of the wind and current fields. There is a worldwide oil spill modelling (WOSM) program.[85] Tracking the scope of an oil spill may also involve verifying that hydrocarbons collected during an ongoing spill are derived from the active spill or some other source. This can involve sophisticated analytical chemistry focused on finger printing an oil source based on the complex mixture of substances present. Largely, these will be various hydrocarbons, among the most useful being polyaromatic hydrocarbons. In addition, both oxygen and nitrogen heterocyclic hydrocarbons, such as parent and alkyl homologues of carbazole, quinoline, and pyridine, are present in many crude oils. As a result, these compounds have great potential to supplement the existing suite of hydrocarbons targets to fine-tune source tracking of petroleum spills. Such analysis can also be used to follow weathering and degradation of crude spills.[86]
See also
| Wikimedia Commons has media related to Oil spill. |
- Automated Data Inquiry for Oil Spills
- Environmental issues with petroleum
- Environmental issues with shipping
- LNG spill
- Storm oil
- Low-temperature thermal desorption
- National Oil and Hazardous Substances Pollution Contingency Plan
- Ohmsett (Oil and Hazardous Materials Simulated Environmental Test Tank)
- Oil Pollution Act of 1990 (in the US)
- Oil well
- Penguin sweater
- Project Deep Spill, the first intentional deepwater oil and gas spill
- Pseudomonas putida (used for degrading oil)
- S-200 (fertilizer)
- ShoreZone
- Spill containment
- Tarball
References
- "Lingering Lessons of the Exxon Valdez Oil Spill". Commondreams.org. 2004-03-22. Archived from the original on June 13, 2010. Retrieved 2012-08-27.
- NOAA Ocean Media Center (2010-03-16). "Hindsight and Foresight, 20 Years After the Exxon Valdez Spill". NOAA. Retrieved 2010-04-30.
- Wout Broekema (April 2015). "Crisis-induced learning and issue politicization in the EU". Public Administration. 94 (2): 381–398. doi:10.1111/padm.12170.
- www.scientificamerican.com 20150-04-20 How BP's Blowout Ranks among Top 5 Oil Spills in 1 Graphic
- Washington Post, October 21, 2018
- United States Department of Defense Environmental Exposure Report: Oil Well Fires (updated August 2, 2000)
- CNN.com, Kuwait still recovering from Gulf War fires Archived 2012-10-10 at the Wayback Machine, 3 Jan. 2003.
- United States Geological Survey, Campbell, Robert Wellman, ed. 1999. Iraq and Kuwait: 1972, 1990, 1991, 1997. Earthshots: Satellite Images of Environmental Change. U.S. Geological Survey. http://earthshots.usgs.gov, revised 14 Feb. 1999. Archived February 19, 2013, at the Wayback Machine
- United Nations, Updated Scientific Report on the Environmental Effects of the Conflict between Iraq and Kuwait, 8 Mar. 1993.
- National Aeronautics and Space Administration, Goddard Space Flight Center News, 1991 Kuwait Oil Fires, 21 Mar. 2003.
- Harvey, Steve (2010-06-13). "California's legendary oil spill". Los Angeles Times. Retrieved 2010-07-14.
- Gulf Oil Spill Is Bad, but How Bad?, last updated 20 May 2010.
- United States Environmental Protection Agency, Report To Congress United States Gulf Environmental Technical Assistance From January 27 – July 31 1991
- National Oceanic and Atmospheric Administration, Office of Response and Restoration, Emergency Response Division, Incident News: Arabian Gulf Spills Archived 2010-08-04 at the Wayback Machine, updated 18 May 2010.
- Campbell Robertson /Clifford Krauss (2 August 2010). "Gulf Spill Is the Largest of Its Kind, Scientists Say". The New York Times. New York Times. Retrieved 2 August 2010.
- CNN (1 July 2010). "Oil disaster by the numbers". CNN. Retrieved 1 July 2010.
- Consumer Energy Report (20 June 2010). "Internal Documents: BP Estimates Oil Spill Rate up to 100,000 Barrels Per Day". Consumer Energy Report. Archived from the original on 14 October 2012. Retrieved 20 June 2010.
- "Big Oil Plans Rapid Response to Future Spills". Abcnews.go.com. Retrieved 2012-08-27.
- Khatchadourian, Raffi (March 14, 2011). "The Gulf War". The New Yorker.
- "IXTOC I". National Oceanic and Atmospheric Administration. Archived from the original on 2012-05-03. Retrieved 2008-11-03.
- Fiest, David L.; Boehm, Paul D.; Rigler, Mark W.; Patton, John S. (March 1981). "Ixtoc 1 oil spill: flaking of surface mousse in the Gulf of Mexico". Nature. 290 (5803): 235–238. Bibcode:1981Natur.290..235P. doi:10.1038/290235a0.
- Patton, John S.; Rigler, Mark W.; Boehm, Paul D.; Fiest, David L. (1981). "Ixtoc 1 oil spill: flaking of surface mousse in the Gulf of Mexico". Nature. 290 (5803): 235–238. Bibcode:1981Natur.290..235P. doi:10.1038/290235a0.
- "Major Oil Spills". International Tanker Owners Pollution Federation. Archived from the original on September 28, 2007. Retrieved 2008-11-02.
- "Atlantic Empress". Centre de Documentation de Recherche et d'Expérimentations. Archived from the original on October 19, 2007. Retrieved 2008-11-10.
- "Tanker Incidents". Archived from the original on June 23, 2009. Retrieved 2009-07-19.
- "Oil Spill History". The Mariner Group. Archived from the original on 2012-08-05. Retrieved 2008-11-02.
- "Oil Spills and Disasters". Retrieved 2008-11-16.
- "Amoco Cadiz". National Oceanic and Atmospheric Administration. Archived from the original on 2008-10-27. Retrieved 2008-11-16.
- Archived May 25, 2009, at the Wayback Machine
- "A 14-year-long oil spill in the Gulf of Mexico verges on becoming one of the worst in U.S. history". Washington Post. Retrieved 2018-10-22.
- Bell, Bethan; Cacciottolo, Mario (2017-03-17). "Black tide: When the British bombed an oil spill". Retrieved 2020-01-09.
- Welch, William M.; Joyner, Chris (May 25, 2010). "Memorial service honors 11 dead oil rig workers". USA Today.
- "Oil spill disrupts water supply – Nation – The Star Online". Archived from the original on 4 October 2013. Retrieved 20 April 2015.
- "Ecuador oil spill threatens Brazilian water supply". 2013-06-12. Retrieved 20 April 2015.
- "Kentucky Crude Oil Spill may reach river, contaminate drinking water". Retrieved 20 April 2015.
- "OIL FOR FUEL". Cairns Post (Qld. : 1909 - 1954). 1923-03-23. p. 5. Retrieved 2020-04-22.
- Bautista, H.; Rahman, K. M. M. (2016). "Review On the Sundarbans Delta Oil Spill: Effects On Wildlife and Habitats". International Research Journal. 1 (43): 93–96. doi:10.18454/IRJ.2016.43.143.
- Sarbatly R.; Kamin, Z. & Krishnaiah D. (2016). "A review of polymer nanofibres by electrospinning and their application in oil-water separation for cleaning up marine oil spills". Marine Pollution Bulletin. 106 (1–2): 8–16. doi:10.1016/j.marpolbul.2016.03.037. PMID 27016959.
- Bautista, H.; Rahman, K. M. M. (2016). "Effects of Crude Oil Pollution in the Tropical Rainforest Biodiversity of Ecuadorian Amazon Region" (PDF). Journal of Biodiversity and Environmental Sciences. 8 (2): 249–254.
- C. Michael Hogan (2008)., Magellanic Penguin, It can take over 1 year to solve the problem of an oil spill. GlobalTwitcher.com, ed. N. Stromberg.
- Dunnet, G.; Crisp, D.; Conan, G.; Bourne, W. (1982). "Oil Pollution and Seabird Populations [and Discussion]". Philosophical Transactions of the Royal Society of London B. 297 (1087): 413–427. Bibcode:1982RSPTB.297..413D. doi:10.1098/rstb.1982.0051.
- Untold Seabird Mortality due to Marine Oil Pollution, Elements Online Environmental Magazine.
- "Expert Recommends Killing Oil-Soaked Birds". Spiegel Online. May 6, 2010. Retrieved August 1, 2011.
- Wolfaardt, AC; Williams, AJ; Underhill, LG; Crawford, RJM; Whittington, PA (2009). "Review of the rescue, rehabilitation and restoration of oiled seabirds in South Africa, especially African penguins Spheniscus demersus and Cape gannets Morus capegnsis, 1983–2005". African Journal of Marine Science. 31 (1): 31–54. doi:10.2989/ajms.2009.31.1.3.774.
- "A Naturalist's Jottings". Frankston and Somerville Standard (Vic. : 1921 - 1939). 1925-08-14. p. 7. Retrieved 2020-04-22.
- "Penguin guard stands watch". Herald (Melbourne, Vic. : 1861 - 1954). 1954-07-03. p. 1. Retrieved 2020-04-22.
- "Oil Menace to Sea Birds". Telegraph (Brisbane, Qld. : 1872 - 1947). 1934-08-23. p. 33. Retrieved 2020-04-22.
- Middlebrook, A. M.; Murphy, D. M.; Ahmadov, R.; Atlas, E. L.; Bahreini, R.; Blake, D. R.; Brioude, J.; de Gouw, J. A.; Fehsenfeld, F. C.; Frost, G. J.; Holloway, J. S.; Lack, D. A.; Langridge, J. M.; Lueb, R. A.; McKeen, S. A.; Meagher, J. F.; Meinardi, S.; Neuman, J. A.; Nowak, J. B.; Parrish, D. D.; Peischl, J.; Perring, A. E.; Pollack, I. B.; Roberts, J. M.; Ryerson, T. B.; Schwarz, J. P.; Spackman, J. R.; Warneke, C.; Ravishankara, A. R. (28 December 2011). "Air quality implications of the Deepwater Horizon oil spill". Proceedings of the National Academy of Sciences. 109 (50): 20280–20285. doi:10.1073/pnas.1110052108. PMC 3528553. PMID 22205764.
- Li, R.; Palm, B. B.; Borbon, A.; Graus, M.; Warneke, C.; Ortega, A. M.; Day, D. A.; Brune, W. H.; Jimenez, J. L.; de Gouw, J. A. (5 November 2013). "Laboratory Studies on Secondary Organic Aerosol Formation from Crude Oil Vapors". Environmental Science & Technology. 47 (21): 12566–12574. Bibcode:2013EnST...4712566L. doi:10.1021/es402265y. PMID 24088179.
- Ehrenhauser, Franz S.; Avij, Paria; Shu, Xin; Dugas, Victoria; Woodson, Isaiah; Liyana-Arachchi, Thilanga; Zhang, Zenghui; Hung, Francisco R.; Valsaraj, Kalliat T. (2014). "Bubble bursting as an aerosol generation mechanism during an oil spill in the deep-sea environment: laboratory experimental demonstration of the transport pathway". Environ. Sci.: Process. Impacts. 16 (1): 65–73. doi:10.1039/C3EM00390F. PMID 24296745.
- Nance, Earthea; King, Denae; Wright, Beverly; Bullard, Robert D. (13 November 2015). "Ambient air concentrations exceeded health-based standards for fine particulate matter and benzene during the Deepwater Horizon oil spill". Journal of the Air & Waste Management Association. 66 (2): 224–236. doi:10.1080/10962247.2015.1114044. PMID 26565439.
- Panetta, L. E. (Chair) (2003). America's living oceans: charting a course for sea change [Electronic Version, CD] Pew Oceans Commission.
- United States Coast Guard (2007). "Cumulative Spill Data and Graphics". United States Coast Guard. Archived from the original on 2007-06-11. Retrieved 2008-04-10. Alt URL
- International Tanker Owners Pollution Federation (2008). "Oil Tanker Spill Information Pack". London: International Tanker Owners Pollution Federation. Retrieved 2008-10-08.
- Gutierrez T, Berry D, Teske A, Aitken MD (2016). "Enrichment of Fusobacteria in Sea Surface Oil Slicks from the Deepwater Horizon Oil Spill". Microorganisms. 4 (3): 24. doi:10.3390/microorganisms4030024. PMC 5039584. PMID 27681918.
- Oil spill cleanup technology Patents and patent applications Archived November 10, 2011, at the Wayback Machine
- "The Environmental Literacy Council – Oil Spills". Enviroliteracy.org. 2008-06-25. Retrieved 2010-06-16.
- "Biological Agents – Emergency Management – US EPA".
- Kasai, Y; et al. (2002). "Predominant Growth of Alcanivorax Strains in Oil-contaminated and Nutrient-supplemented Sea Water". Environmental Microbiology. 4 (3): 141–47. doi:10.1046/j.1462-2920.2002.00275.x.
- "Oil and natural gas eating bacteria to clear-up spills". www.oilandgastechnology.net. April 30, 2014.
- "S-200 | NCP Product Schedule | Emergency Management | US EPA". Epa.gov. Retrieved 2010-06-16.
- "Emergency Response: Responding to Oil Spills". Office of Response and Restoration. National Oceanic and Atmospheric Administration. 2007-06-20.
- Mullin, Joseph V; Champ, Michael A (2003-08-01). "Introduction/Overview to in Situ Burning of Oil Spills". Spill Science & Technology Bulletin. In-Situ Burning of Spilled Oil. 8 (4): 323–330. doi:10.1016/S1353-2561(03)00076-8.
- "Oil Spills". Library.thinkquest.org. Retrieved 2012-08-27.
- "Spill Response – Dispersants". International Tanker Operators Pollution Federation Limited. Retrieved 2010-05-03.
- "Spill Response – Dispersants Kill Fish Eggs". journal Environmental Toxicology and Chemistry. Retrieved 2010-05-21.
- Barry Carolyn (2007). "Slick Death: Oil-spill treatment kills coral". Science News. 172 (5): 67. doi:10.1002/scin.2007.5591720502.
- "Dispersant makes oil 52 times more toxic – Technology & science – Science – LiveScience – NBC News". NBC News. Retrieved 20 April 2015.
- National Academies of Sciences, Engineering, and Medicine (2019). The Use of Dispersants in Marine Oil Spill Response. doi:10.17226/25161. ISBN 978-0-309-47818-2.CS1 maint: multiple names: authors list (link)
- Pezeshki, S. R.; Hester, M. W.; Lin, Q.; Nyman, J. A. (2000). "The effects of oil spill clean-up on dominant US Gulf coast marsh macrophytes: a review". Environmental Pollution. 108 (2): 129–139. doi:10.1016/s0269-7491(99)00244-4.
- "A slick idea" by Cara Murphy Beach Reporter Manhattan Beach section ll/14/1992
- "Zapping Oil Spills with Dry Ice and Ingenuity" by Gordon Dillow Los Angeles Times South Bay section page 1 2/24/1994
- If only they'd tried the chilled-soup solution in Alaska" by John Bogert Daily Breeze (Torrance CA) local section page B1 2/17/1994
- Fountain, Henry (2010-06-24). "Advances in Oil Spill Cleanup Lag Since Valdez". New York Times. Retrieved 2010-07-05.
- Cherukupally, P.; Sun, W.; Wong, A. P. Y.; Williams, D. R.; Ozin, G. A.; Bilton, A. M.; Park, C. B. (2019). "Surface-engineered sponges for recovery of crude oil microdroplets from wastewater". Nature Sustainability. doi:10.1038/s41893-019-0446-4.
- "Quebec tragedy unlikely to slow oil shipments via rail". BostonGlobe.com. Retrieved 20 April 2015.
- "Oil Spill Response Procedure" (PDF). Chemstore UK. Retrieved 2014-02-25.
- "Environmental Sensitivity Index (ESI) Maps". Retrieved 2010-05-27.
- "NOAA's Ocean Service Office of Response and Restoration". Response.restoration.noaa.gov. Retrieved 2010-06-16.
- NOAA (2002). Environmental Sensitivity Index Guidelines, version 3.0. NOAA Technical Memorandum NOS OR&R 11. Seattle: Hazardous Response and Assessment Division, National Oceanic and Atmospheric Administration, 129p.
- Gundlach, E.R. and M.O. Hayes (1978). Vulnerability of Coastal Environments to Oil Spill Impacts. Marine Technology Society. 12 (4): 18–27.
- NOAA (2008). Introduction to Environmental Sensitivity Index maps. NOAA Technical Manual. Seattle: Hazardous Response and Assessment Division, National Oceanic and Atmospheric Administration, 56p.
- IMO/IPIECA (1994). Sensitivity Mapping for Oil Spill Response. International Maritime Organization/ International Petroleum Industry Environmental Conservation Association Report Series, Volume 1. 22p.
- Metcalf & Eddy. Wastewater Engineering, Treatment and Reuse. 4th ed. New York: McGraw-Hill, 2003. 98.
- Anderson, E.L., E. Howlett, K. Jayko, V. Kolluru, M. Reed, and M. Spaulding. 1993. The worldwide oil spill model (WOSM): an overview. Pp. 627–646 in Proceedings of the 16th Arctic and Marine Oil Spill Program, Technical Seminar. Ottawa, Ontario: Environment Canada.
- Wang, Z.; Fingas, M.; Page, D.S. (1999). "Oil spill identification". Journal of Chromatography A. 843 (1–2): 369–411. doi:10.1016/S0021-9673(99)00120-X.
Further reading
- Nelson-Smith, Oil Pollution and Marine Ecology, Elek Scientific, London, 1972; Plenum, New York, 1973
- Oil Spill Case Histories 1967–1991, NOAA/Hazardous Materials and Response Division, Seattle, WA, 1992
- Oilspill Data set
- Ramseur, Jonathan L. Oil Spills: Background and Governance, Congressional Research Service, Washington, DC, September 15, 2017
| Authority control |
|
|---|