Ocean color
The "color" of the ocean is determined by the interactions of incident light with substances or particles present in the water. White light from the sun is made up of a combination of colors that are broken apart by water droplets in a "rainbow" spectrum. Large quantities of water, even in a swimming pool, would appear blue as well. When light hits the water surface, the different colors are absorbed, transmitted, scattered, or reflected in differing intensities by water molecules and other so-called optically-active constituents in suspension in the upper layer of the ocean. The reason that open ocean waters often appear blue is due to the absorption and scattering of light. The blue wavelengths of light are scattered, similar to the scattering of blue light in the sky but absorption is a much larger factor than scattering for the clear ocean water. In water, absorption is strong in the red and weak in the blue and so red light is absorbed quickly in the ocean leaving blue. Almost all sunlight that enters the ocean is absorbed, except very close to the coast. The red, yellow, and green wavelengths of sunlight are absorbed by water molecules in the ocean. When sunlight hits the ocean, some of the light is reflected back directly, but most of it penetrates the ocean surface and interacts with the water molecules that it encounters. The red, orange, yellow, and green wavelengths of light are absorbed and so the remaining light we see is composed of the shorter wavelength blues and violets.
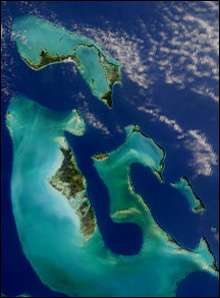
If there are any particles suspended in the water, they will increase the scattering of light. In coastal areas, runoff from rivers, resuspension of sand and silt from the bottom by tides, waves, and storms and a number of other substances can change the color of the near-shore waters. Some types of particles can also contain substances that absorb certain wavelengths of light, which alters its characteristics. For example, microscopic marine algae, called phytoplankton, have the capacity to absorb light in the blue and red region of the spectrum owing to specific pigments like chlorophyll. Accordingly, as the concentration of phytoplankton increases in the water, the color of the water shifts toward the green part of the spectrum. Fine mineral particles like sediment absorb light in the blue part of the spectrum, causing the water to turn brownish if there is a massive sediment load.
The most important light-absorbing substance in the oceans is chlorophyll, which phytoplankton use to produce carbon by photosynthesis. Chlorophyll, a green pigment, makes phytoplankton preferentially absorb the red and blue portions of the light spectrum and reflect green light. Ocean regions with high concentrations of phytoplankton have shades of blue-green depending upon the type and density of the phytoplankton population there. The basic principle behind the remote sensing of ocean color from space is that the more phytoplankton is in the water, the greener it is.
There are other substances that may be found dissolved in the water that can also absorb light. Since the substances are usually composed of organic carbon, researchers generally refer to them as colored dissolved organic matter.
Ocean color radiometry
Ocean color radiometry is a technology, and a discipline of research, concerning the study of the interaction between the visible electromagnetic radiation coming from the sun and aquatic environments. In general, the term is used in the context of remote-sensing observations, often made from Earth-orbiting satellites. Using sensitive radiometers, such as those on-board satellite platforms, one can measure carefully the wide array of colors emerging out of the ocean. These measurements can be used to infer important information such as phytoplankton biomass or concentrations of other living and non-living material that modify the characteristics of the incoming radiation. Monitoring the spatial and temporal variability of algal blooms from satellite, over large marine regions up to the scale of the global ocean, has been instrumental in characterizing variability of marine ecosystems and is a key tool for research into how marine ecosystems respond to climate change and anthropogenic perturbations.
History
Remote sensing of ocean colour from space began in 1978 with the successful launch of NASA's Coastal Zone Color Scanner (CZCS). Despite the fact that CrZCS was an experimental mission intended to last only one year, the sensor continued to generate a valuable time-series of data over selected test sites until early 1986. Ten years passed before other sources of ocean-colour data became available with the launch of other sensors, and in particular the Sea-viewing Wide Field-of-view sensor (SeaWiFS) in 1997 on board the NASA SeaStar satellite. Subsequent sensors have included NASA's Moderate-resolution Imaging Spectroradiometer (MODIS) on board the Aqua and Tearra satellites, ESA's MEdium Resolution Imaging Spectrometer (MERIS) onboard its environmental satellite Envisat. Several new ocean-colour sensors have recently been launched, including the Indian Ocean Colour Monitor (OCM-2) on-board ISRO's Oceansat-2 satellite and the Korean Geostationary Ocean Color Imager (GOCI), which is the first ocean colour sensor to be launched on a geostationary satellite, and Visible Infrared Imager Radiometer Suite (VIIRS) aboard NASA's Suomi NPP . More ocean colour sensors are planned over the next decade by various space agencies.
Ocean Colour Radiometry and its derived products are also seen as fundamental Essential Climate Variables as defined by the Global Climate Observing System. Ocean colour datasets provide the only global synoptic perspective of primary production in the oceans, giving insight into the role of the world's oceans in the global carbon cycle.
Applications
Ocean colour data is a vital resource for a wide variety of operational forecasting and oceanographic research, earth sciences, and related applications, as well as in many of the Societal Benefit Areas identified by the Group on Earth Observations. A few examples of some of the ways that ocean colour data and related data types have been used include.
- Harmful Algal Bloom Forecasting System: The National Oceanic and Atmospheric Administration (NOAA) Harmful Algal Bloom Forecasting System utilizes ocean colour data in conjunction with meteorological data and field sampling to forecast the development and movement of harmful algal blooms (commonly referred to as "red tides") in the Gulf of Mexico.
- Linking Agricultural Practices to Phytoplankton Blooms: Ocean colour data indicate that when Mexican farmers add fertilizer to the fields, the fertilizer flows to the ocean and triggers phytoplankton growth in the Gulf of California.
See also
- Coastal Zone Color Scanner (CZCS)
- Sea-viewing Wide Field-of-view Sensor (SeaWiFS)
- Moderate-resolution Imaging Spectroradiometer (MODIS)
- MEdium Resolution Imaging Spectrometer (MERIS)
- POLarization and Directionality of the Earth's Reflectances (POLDER)
- Geostationary Ocean Color Imager (GOCI)
- Oceansat-2
- National Polar-orbiting Operational Environmental Satellite System (NPOESS)
- NPOESS Preparatory Project (NPP)
- Sentinel 3
- Marine Optical Buoy (MOBY)
External links
- International Ocean Colour Coordinating Group
- NASA's Ocean Color Home Page
- ESA MERIS Ocean Colour
- Global Climate Observing System
- Group on Earth Observations
- GlobColour
- Joint Research Centre Ocean Colour Portal
- NOAA Coastwatch
- NOAA Coastal Remote Sensing program
- Malaysian Ocean Color Portal
- ChloroGIN
- Indian Space Research Organisation OCM
- Korean Aerospace Research Institute
- Korea Ocean Satellite Center
- China National Space Administration
- Japan Aerospace Exploration Agency