Nok Kundi
Nok Kundi ("the blunt point"), is a township and region in western Pakistan in the province of Balochistan. This region of western Pakistan, was historically known to these people as Dzaranga ("water producing land"). It was recorded by the Greeks and Hellenized to Drangiana in Greek literature. The original word for this region is Zaranka which means "watermill" or a "spring". This word occurs in old Balochi and Persian as "Waterland".
Nok Kundi نوکنڈی, نوک کنڈی Naukundi | |
|---|---|
 Nok Kundi 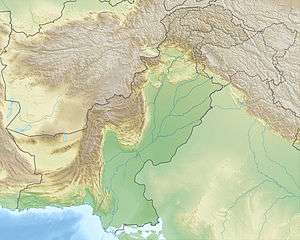 Nok Kundi | |
| Coordinates: 28.825887°N 62.750025°E | |
| Country | |
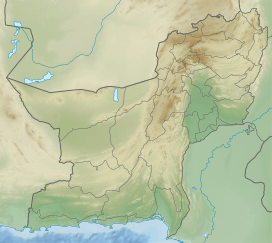
| Province | Balochistan |
| District | Chagai District |
| Government | |
| Elevation | 679 m (2,228 ft) |
| Time zone | UTC+5 (PST) |
| • Summer (DST) | UTC+6 (PDT) |
Climate
Nok Kundi has a hot desert climate (Köppen climate classification BWh) with extremely hot summers and mild winters. There is virtually no rainfall whole the year. The climate is very dry with just 35 millimetres (1.4 in) of rainfall each year.
| Climate data for Nok Kundi | |||||||||||||
|---|---|---|---|---|---|---|---|---|---|---|---|---|---|
| Month | Jan | Feb | Mar | Apr | May | Jun | Jul | Aug | Sep | Oct | Nov | Dec | Year |
| Record high °C (°F) | 31.1 (88.0) |
33.0 (91.4) |
37.8 (100.0) |
43.1 (109.6) |
47.5 (117.5) |
49.6 (121.3) |
48.3 (118.9) |
47.8 (118.0) |
46.0 (114.8) |
43.0 (109.4) |
36.0 (96.8) |
29.0 (84.2) |
49.6 (121.3) |
| Average high °C (°F) | 18.7 (65.7) |
21.5 (70.7) |
27.7 (81.9) |
33.8 (92.8) |
39.0 (102.2) |
42.7 (108.9) |
42.9 (109.2) |
41.5 (106.7) |
38.1 (100.6) |
33.3 (91.9) |
26.9 (80.4) |
21.0 (69.8) |
32.3 (90.1) |
| Daily mean °C (°F) | 11.3 (52.3) |
14.1 (57.4) |
20.1 (68.2) |
26.2 (79.2) |
31.2 (88.2) |
35.1 (95.2) |
35.8 (96.4) |
34.1 (93.4) |
30.0 (86.0) |
24.6 (76.3) |
18.4 (65.1) |
13.2 (55.8) |
24.5 (76.1) |
| Average low °C (°F) | 4.0 (39.2) |
6.8 (44.2) |
12.6 (54.7) |
18.6 (65.5) |
23.5 (74.3) |
27.4 (81.3) |
28.6 (83.5) |
26.6 (79.9) |
21.9 (71.4) |
15.9 (60.6) |
10.0 (50.0) |
5.5 (41.9) |
16.8 (62.2) |
| Record low °C (°F) | −8 (18) |
−10.0 (14.0) |
−1.1 (30.0) |
7.0 (44.6) |
8.1 (46.6) |
16.1 (61.0) |
18.9 (66.0) |
17.8 (64.0) |
10.0 (50.0) |
2.0 (35.6) |
−4.4 (24.1) |
−8.3 (17.1) |
−10.0 (14.0) |
| Average precipitation mm (inches) | 10.8 (0.43) |
8.0 (0.31) |
7.6 (0.30) |
3.5 (0.14) |
0.4 (0.02) |
0.0 (0.0) |
1.3 (0.05) |
1.2 (0.05) |
0.0 (0.0) |
0.4 (0.02) |
0.2 (0.01) |
1.9 (0.07) |
35.3 (1.4) |
| Mean monthly sunshine hours | 219.2 | 205.1 | 250.4 | 280.5 | 313.5 | 299.1 | 286.9 | 319.9 | 274.0 | 290.3 | 254.6 | 224.9 | 3,218.4 |
| Source: NOAA (1961-1990) [1] | |||||||||||||
References
- "Nokkundi Climate Normals 1961-1990". National Oceanic and Atmospheric Administration. Retrieved January 17, 2013.
This article is issued from Wikipedia. The text is licensed under Creative Commons - Attribution - Sharealike. Additional terms may apply for the media files.