Nanoscale secondary ion mass spectrometry
Nanoscale secondary ion mass spectrometry (nanoSIMS) is an analytic technique used to gather nanoscale resolution measurements of the elemental and isotopic composition of a material using a sector mass spectrometer. This instrument is based on secondary ion mass spectrometry.[1] NanoSIMS is able to create nanoscale maps of elemental composition, parallel acquisition of seven masses, isotopic identification, combining the high mass resolution, subparts-per-million sensitivity of conventional SIMS with spatial resolution down to 50 nm and fast acquisition.[2]
NanoSIMS not only refers to the technique used, but also the mass spectrometer specialized for this method. Original design of the instrument was conceived by Georges Slodzian at the University of Paris Sud in France.[3]There are currently more than 40 NanoSIMS instruments in the world.[4]
How it works
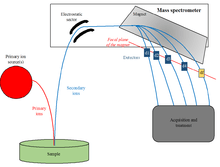
Generally, NanoSIMS uses an ion gun to produce a primary beam of ions. These primary ions erode the sample surface and produce atomic collisions, some of the collisions resulting in the release of secondary ion particles. These ions are transmitted through a mass spectrometer, where the masses are measured and identified.[5] The primary ion beam can raster across the sample and create a ‘map’ of the element and isotope distribution by counting the number of ions that originated from each point at up to a 50 nanometer (nm) resolution, 10-50 times greater than conventional SIMS.[6][7] This is achieved by positioning the primary probe in close proximity to the sample.[8] The primary ion beam impacts the sample surface at 90°, with the secondary ions extracted back through the same lens assembly.This allows for the isotopic composition of individual cells to be distinguished at parts per million (ppm) or parts per billion (ppb) range.
NanoSIMS can detect minute mass differences between ions at the resolution of M/dM > 5000, where M is the nominal mass of the isotope and dM is the mass difference between the isotopes of interest.[9] The high mass resolution capabilities of NanoSIMS allows for different elements and their isotopes to be identified and spatially mapped in the sample, even if very close in mass. The mass spectrometer is capable of multicollection, meaning up to 5 (NanoSIMS 50) or 7 (NanoSIMS 50 L) masses can be simultaneously detected, from hydrogen to uranium, though with limitations.[5][7] The relatively large number of masses helps eliminate measurement errors as possible changes in instrumental or sample conditions that may occur in between runs are avoided.[9]
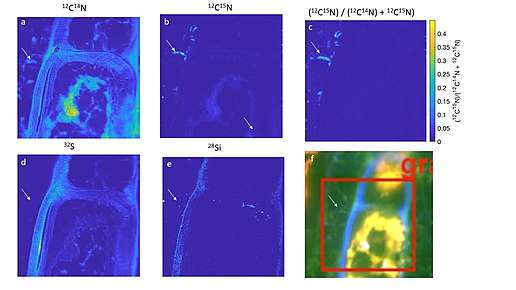
The ion beam must either be set to detect negative or positive ions, commonly completed by using a Cesium+ or Oxygen- beam, respectively.[10] This high mass resolution is particularly relevant to biological applications. For example, nitrogen is one of the most common elements in organisms. However, due to the low electron affinity of the nitrogen atom, the production of secondary ions is rare. Instead, molecules such as CN can be generated and measured. However, due to isotope combinations (such as the isobars 13C14N-, and 12C15N-), nearly identical molecular weights of 27.000 and 27.006 daltons, respectively, will be generated. Unlike other imaging techniques, where 13C14N and 12C15N cannot be independently measured due to nearly identical masses,, NanoSIMS can safely distinguish the differences between these molecules.[10]
The physics of NanoSIMS
The magnetic sector mass spectrometer causes a physical separation of ions of a different mass-to-charge ratio. The physical separation of the secondary ions is caused by the Lorentz force when the ions pass through a magnetic field that is perpendicular to the velocity vector of the secondary ions. The Lorentz force states that a particle will experience a force

when it maintains a charge q and travels through an electric field E and magnetic field B with a velocity v. The secondary ions that leave the surface of the sample typically have a kinetic energy of a few electron volts (eV), although a rather small portion have been found to have energy of a few keV. An electrostatic field captures the secondary ions that leave the sample surface; these extracted ions are then transferred to a mass spectrometer. In order to achieve precise isotope measurements, there is a need for high transmission and high mass resolution. High transmission refers to the low loss of secondary ions between the sample surface and the detector, and high mass resolution refers to the ability to efficiently separate the secondary ions (or molecules of interest) from other ions and/or ions of similar mass. Primary ions will collide with the surface at a specific frequency per unit of surface area. The collision that occurs causes atoms to sputter from the sample surface, and of these atoms only a small amount will undergo ionization. These become secondary ions, which are then detected after transfer through the mass spectrometer. Each primary ion generates a number of secondary ions of an isotope that will reach the detector to be counted. The count rate is determined by

where I(iM)is the count rate of the isotope iM of element M. The counting rate of the isotope is dependent on the concentration, XM and the element's isotopic abundance, denoted Ai. Because the primary ion beam determines the secondary ions, Y, that are sputtered, the density of the primary ion beam, db, which is defined as the amount of ions per second per unit of surface area, will affect a portion of the surface area of the sample, S, with an even distribution of the primary ions. Of the sputtered secondary ions, there is only a fraction that will be ionized, Yi. The probability that any ion will be successfully transferred from mass spectrometer to detector is T. The product of Yi and T determines the amount of isotopes that will be ionized, as well as detected, so it is considered the useful yield. [11]
Sample Preparation
One of the most critical steps in NanoSIMS use is sample preparation.[12] Specific protocols should be developed for individual experiments in order to best preserve the true spatial distribution and abundance of molecules based on the sample. In general, due to the design of the NanoSIMS machine, the sample must be vacuum compatible (ie, volatile free), flat, which reduces varying ionization trajectories, and conductive, which can be accomplished sputter coating with Au, Ir, or C. Biological samples, such as cells or tissue, can be fixed and embedded in a resin before sectioning in 100 nm slices, and placed on silicon chips or slides before viewing.[12]
Applications
NanoSIMS can capture the spatial variability of isotopic and elemental measurements of sub-micron areas, grains or inclusions fromgeological and biological samples.[13] This instrument can characterize the nanostructured materials with complex composition that are increasingly important candidates for energy generation and storage.
Geological Applications
NanoSIMS was first used in THIS STUDY.
NanoSIMS has also proved useful in studying cosmochemical issues, where samples of single, micro- or sub-micrometer-sized grains from meteorites as well as microtome sections prepared by the focused ion beam (FIB) technique can be analyzed. NanoSIMS can be combined with transmission electron microscopy (TEM) when using microtome or FIB sections. This combination allows for correlated mineralogical and isotopic studies in situ at a sub-micrometer scale.
It is particularly useful in materials research because of its high sensitivity at high mass resolution, which allow for trace element imaging and quantification.[14]
Biological Applications
Initially developed for geochemical and related research, NanoSIMS is now utilized by a wide variety of fields, including biology and microbiology. In biomedical research, NanoSIMS is also referred to as Multi-isotope imaging mass spectrometry (MIMS).[15] The 50 nm resolution allows unprecedented resolution of cellular and sub-cellular features (as reference, the model organism E. coli is typically 1,000 to 2,000 nm in diameter). The high resolution that it offers allows intracellular measurement of accumulations and fluxes of molecules containing various stable isotopes.[16] NanoSIMS can be used for pure cultures, co-cultures, and mixed community samples.[9]
The first use of NanoSIMS in biology was by Peteranderl and Lechene in 2004, who used a prototype of NanoSIMS to examine and measure carbon and nitrogen isotopes of eukaryotic cells. This study was the first time that carbon and nitrogen isotope ratios were directly measured at a sub-cellular scale in a biological sample.[17]
Methods commonly coupled with NanoSIMS
Microscopy
Other microscopy techniques are commonly used in tandem with NanoSIMS that allow for multiple types of information (such as taxonomic information through fluorescence in situ hybridization (FISH)[18] or identification of additional physiological features via transmission electron microscopy (TEM)) to be provided.
Immunogold labeling
Traditional methods that are used to label and identify subcellular features of cells, such as immunogold labeling, can also be used with NanoSIMS analysis. Immunogold labeling uses antibodies to target specific proteins, and subsequently labels the antibodies with gold nano particles. The NanoSIMS instrument can detect the gold particles, providing the location of the labelled proteins at a high scale resolution. Gold-containing or platinum-containing compounds used as anticancer drugs were imaged using NanoSIMS to examine the subcellular distribution in breast cancer and colon cancer cells, respectively.[19] In a separate study, antibody-antigen binding was studied without the need for a fluorescent label to be added to the antibody, allowing for label-free localization and quantitative analysis at a high resolution.[20]
Stable isotope labeling
Another common technique typically used in NanoSIMS analysis is stable isotope probing. This method involves the introduction of stable isotopically labelled biologically-relevant compounds to organisms for consumption and integration into organic matter. When analyzed via NanoSIMS, the technique is referred to as nanoSIP.[21] NanoSIMS can be used to detect which organisms incorporated which molecules, how much of the labeled molecules was incorporated in a semi-quantitative manner, and where in the cell the incorporation occurred. Previous quantitative analysis techniques at a lower resolution than NanoSIMS of stable isotopically labeled molecules was limited to analyzed bulk material, which did not allow for insights about the contributions of individual cells or subcellular compartments to be made.[22] Additionally, the removal of large foreign molecules (such as antibodies or gold particles) from the experimental setup alleviates concerns that tagged molecules required for other microscopy techniques may have different biochemical responses or properties than normal.
This technique can be used to study nutrient exchange. The mouse gut microbiome was investigated to determine which microbes fed on host-derived compounds. For this, mice were given food enriched in the stable isotopically labelled amino acids and the microbial biomass examined.[23] NanoSIMS allows for the metabolic contributions of individual microbes to be examined. NanoSIMS was used to study and prove for the first time the nitrogen fixing abilities of bacteria and archaea from the deep ocean by supplying 15N nitrogen contain compounds to sediment samples.[24] NanoSIMS can also be used to estimate growth rate of organisms, as the amount of carbon or other substrate accumulated inside the cell allows for estimation of how much biomass is being generated.[25]
Measuring natural isotope abundances in organisms
Organic material naturally contains stable isotopes at different ratios in the environment, which can provide information on the origin of the food source for the organisms. Different types of organic material of food sources has different amounts of stable isotopes, which is reflected in the composition of the organism that eats these food sources.[26] This type of analysis was first used in 2001 in conjunction with FISH to examine syntrophic relationships between anaerobic methane-oxidizing archaea and sulfate reducing bacteria.[27] Isotopes with naturally low abundances may not be able to be detected with this method.
Paleobiology
NanoSIMS can also be used to examine the elemental and isotopic composition of microparticles preserved in the rock record.[6] The types of elements and isotopic ratios can help determine if the material is of biological origin.[9] NanoSIMS was first used in this field of paleobiology in 2005 by Robert et al.[28] In this study, microfossils were found to contain carbon, nitrogen, and sulfur elements arranged as ‘globules’ that were reminiscent of cell walls. The ratio of carbon to nitrogen measured also served as an indicator of biological origin, as the rock surrounding the fossils had very different C to N ratios.[6]
References
- Herrmann, Anke M.; Ritz, Karl; Nunan, Naoise; Clode, Peta L.; Pett-Ridge, Jennifer; Kilburn, Matt R.; Murphy, Daniel V.; O’Donnell, Anthony G.; Stockdale, Elizabeth A. (2007). "Nano-scale secondary ion mass spectrometry — A new analytical tool in biogeochemistry and soil ecology: A review article". Soil Biology and Biochemistry. 39 (8): 1835–1850. doi:10.1016/j.soilbio.2007.03.011. ISSN 0038-0717.
- Cameca NanoSIMS 50L
- "CAMECA NanoSIMS: High Resolution Ion Microprobe for Ultra Fine Feature Analysis". www.cameca.com. Retrieved April 20, 2016.
- Nuñez, J., Renslow, R., Cliff, J. B., & Anderton, C. R. (2018). NanoSIMS for biological applications: Current practices and analyses. Biointerphases, 13(3), 03B301. https://doi.org/10.1116/1.4993628
- "nanosims:introduction_to_nanosims [nanosims-wiki]". nanosims.geo.uu.nl. Retrieved 2020-05-22.
- Oehler, Dorothy Z.; Cady, Sherry L. (December 2014). "Biogenicity and Syngeneity of Organic Matter in Ancient Sedimentary Rocks: Recent Advances in the Search for Evidence of Past Life". Challenges. 5 (2): 260–283. Bibcode:2014Chall...5..260O. doi:10.3390/challe5020260.
- Kilburn, Matt R.; Wacey, David (2014). CHAPTER 1 Nanoscale Secondary Ion Mass Spectrometry (NanoSIMS) as an Analytical Tool in the Geosciences. Detection Science. pp. 1–34. doi:10.1039/9781782625025-00001. ISBN 978-1-84973-649-7.
- Kilburn, Matt R.; Wacey, David (2014). "CHAPTER 1 Nanoscale Secondary Ion Mass Spectrometry (NanoSIMS) as an Analytical Tool in the Geosciences": 1–34. doi:10.1039/9781782625025-00001. Cite journal requires
|journal=(help) - Nuñez, Jamie; Renslow, Ryan; Cliff, John B.; Anderton, Christopher R. (2017-09-27). "NanoSIMS for biological applications: Current practices and analyses". Biointerphases. 13 (3): 03B301. doi:10.1116/1.4993628. ISSN 1934-8630. PMID 28954518.
- Gyngard, Frank; L. Steinhauser, Matthew (2019). "Biological explorations with nanoscale secondary ion mass spectrometry". Journal of Analytical Atomic Spectrometry. 34 (8): 1534–1545. doi:10.1039/C9JA00171A.
- Hoppe, Peter; Cohen, Stephanie; Meibom, Anders (2013). "NanoSIMS: Technical Aspects and Applications in Cosmochemistry and Biological Geochemistry". Geostandards and Geoanalytical Research. 37 (2): 111–154. doi:10.1111/j.1751-908X.2013.00239.x.
- Grovenor, C. R. M.; Smart, K. E.; Kilburn, M. R.; Shore, B.; Dilworth, J. R.; Martin, B.; Hawes, C.; Rickaby, R. E. M. (2006-07-30). "Specimen preparation for NanoSIMS analysis of biological materials". Applied Surface Science. Proceedings of the Fifteenth International Conference on Secondary Ion Mass Spectrometry. 252 (19): 6917–6924. Bibcode:2006ApSS..252.6917G. doi:10.1016/j.apsusc.2006.02.180. ISSN 0169-4332.
- J. Moreau et al., SCIENCE.
- "CAMECA NanoSIMS Application to Materials Research: Segregation & Diffusion in Polycrystalline". www.cameca.com.
- Steinhauser, Matthew L.; Lechene, Claude P. (2013). "Quantitative imaging of subcellular metabolism with stable isotopes and multi-isotope imaging mass spectrometry". Seminars in Cell & Developmental Biology. 24 (8–9): 661–667. doi:10.1016/j.semcdb.2013.05.001. ISSN 1084-9521. PMC 3985169. PMID 23660233.
- "Application of the CAMECA NanoSIMS : Cell Biology". www.cameca.com.
- Peteranderl, R.; Lechene, C. (2004-04-01). "Measure of carbon and nitrogen stable isotope ratios in cultured cells". Journal of the American Society for Mass Spectrometry. 15 (4): 478–485. doi:10.1016/j.jasms.2003.11.019. ISSN 1044-0305. PMID 15047053.
- Musat, N.; Halm, H.; Winterholler, B.; Hoppe, P.; Peduzzi, S.; Hillion, F.; Horreard, F.; Amann, R.; Jorgensen, B. B.; Kuypers, M. M. M. (2008). "A single-cell view on the ecophysiology of anaerobic phototrophic bacteria". Proceedings of the National Academy of Sciences. 105 (46): 17861–17866. Bibcode:2008PNAS..10517861M. doi:10.1073/pnas.0809329105. ISSN 0027-8424. PMC 2582579. PMID 19004766.
- Wedlock, Louise E.; Kilburn, Matt R.; Cliff, John B.; Filgueira, Luis; Saunders, Martin; Berners-Price, Susan J. (2011-08-30). "Visualising gold inside tumour cells following treatment with an antitumour gold(I) complex". Metallomics. 3 (9): 917–925. doi:10.1039/C1MT00053E. ISSN 1756-591X. PMID 21796317.
- Dauphas, Stéphanie; Delhaye, Thomas; Lavastre, Olivier; Corlu, Anne; Guguen-Guillouzo, Christiane; Ababou-Girard, Soraya; Geneste, Florence (2008). "Localization and Quantitative Analysis of Antigen−Antibody Binding on 2D Substrate Using Imaging NanoSIMS". Analytical Chemistry. 80 (15): 5958–5962. doi:10.1021/ac800602q. ISSN 0003-2700. PMID 18578503.
- Pett-Ridge, Jennifer; Weber, Peter K. (2012). "NanoSIP: NanoSIMS applications for microbial biology". Microbial Systems Biology. Methods in Molecular Biology (Clifton, N.J.). 881. pp. 375–408. doi:10.1007/978-1-61779-827-6_13. ISBN 978-1-61779-826-9. ISSN 1940-6029. PMID 22639220.
- Jiang, H.; Favaro, E.; Goulbourne, C. N.; Rakowska, P. D.; Hughes, G. M.; Ryadnov, M. G.; Fong, L.G.; Young, S. G.; Ferguson, D. J. P.; Harris, A. L.; Grovenor, C. R. M. (2014-07-01). "Stable isotope imaging of biological samples with high resolution secondary ion mass spectrometry and complementary techniques". Methods (San Diego, Calif.). 68 (2): 317–324. doi:10.1016/j.ymeth.2014.02.012. ISSN 1046-2023. PMC 4222523. PMID 24556558.
- Berry, David; Stecher, Bärbel; Schintlmeister, Arno; Reichert, Jochen; Brugiroux, Sandrine; Wild, Birgit; Wanek, Wolfgang; Richter, Andreas; Rauch, Isabella; Decker, Thomas; Loy, Alexander (2013-03-19). "Host-compound foraging by intestinal microbiota revealed by single-cell stable isotope probing". Proceedings of the National Academy of Sciences. 110 (12): 4720–4725. Bibcode:2013PNAS..110.4720B. doi:10.1073/pnas.1219247110. ISSN 0027-8424. PMC 3607026. PMID 23487774.
- Dekas, Anne E.; Poretsky, Rachel S.; Orphan, Victoria J. (2009-10-16). "Deep-Sea Archaea Fix and Share Nitrogen in Methane-Consuming Microbial Consortia". Science. 326 (5951): 422–426. Bibcode:2009Sci...326..422D. doi:10.1126/science.1178223. ISSN 0036-8075. PMID 19833965.
- Stryhanyuk, Hryhoriy; Calabrese, Federica; Kümmel, Steffen; Musat, Florin; Richnow, Hans H.; Musat, Niculina (2018). "Calculation of Single Cell Assimilation Rates From SIP-NanoSIMS-Derived Isotope Ratios: A Comprehensive Approach". Frontiers in Microbiology. 9: 2342. doi:10.3389/fmicb.2018.02342. ISSN 1664-302X. PMC 6178922. PMID 30337916.
- Phillips, Donald L. (2012-04-30). "Converting isotope values to diet composition: the use of mixing models". Journal of Mammalogy. 93 (2): 342–352. doi:10.1644/11-MAMM-S-158.1. ISSN 0022-2372.
- Orphan, Victoria J.; House, Christopher H.; Hinrichs, Kai-Uwe; McKeegan, Kevin D.; DeLong, Edward F. (2001-07-20). "Methane-Consuming Archaea Revealed by Directly Coupled Isotopic and Phylogenetic Analysis". Science. 293 (5529): 484–487. doi:10.1126/science.1061338. ISSN 0036-8075. PMID 11463914.
- Oehler, D. Z.; Mostefaoui, S.; Meibom, A.; Selo, M.; McKay, D. S.; Robert, F. (March 2006). ""Nano" Morphology and Element Signatures of Early Life on Earth: A New Tool for Assessing Biogenicity". LPI: 1067. Bibcode:2006LPI....37.1067O.