Lithopolis, Ohio
Lithopolis is a village in Fairfield and Franklin counties in the U.S. state of Ohio. The population was 1,106 at the 2010 census.
Lithopolis, Ohio | |
|---|---|
 Columbus Street downtown | |
 Location of Lithopolis, Ohio | |
 Location of Lithopolis in Fairfield County | |
| Coordinates: 39°48′10″N 82°48′29″W | |
| Country | United States |
| State | Ohio |
| Counties | Fairfield, Franklin |
| Area | |
| • Total | 2.02 sq mi (5.23 km2) |
| • Land | 2.02 sq mi (5.23 km2) |
| • Water | 0 sq mi (0 km2) |
| Elevation | 945 ft (288 m) |
| Population | |
| • Total | 1,106 |
| • Estimate (2019[4]) | 1,796 |
| • Density | 547.5/sq mi (211.4/km2) |
| Time zone | UTC-5 (Eastern (EST)) |
| • Summer (DST) | UTC-4 (EDT) |
| ZIP code | 43136 |
| Area code(s) | 614 |
| FIPS code | 39-44086[5] |
| GNIS feature ID | 1065008[2] |
History

Lithopolis was originally called Centerville, and under the latter name was laid out in 1815.[6] The city presently is named for valuable deposits of stone near the original town site, the name Lithopolis translating to "stone city" in Greek.[7] A post office called Lithopolis has been in operation since 1827.[8]
Geography
Lithopolis is located at 39°48′10″N 82°48′29″W (39.802655, -82.808023).[9]
According to the United States Census Bureau, the village has a total area of 2.02 square miles (5.23 km2), all land.[1]
Demographics
| Historical population | |||
|---|---|---|---|
| Census | Pop. | %± | |
| 1870 | 394 | — | |
| 1880 | 404 | 2.5% | |
| 1890 | 369 | −8.7% | |
| 1900 | 358 | −3.0% | |
| 1910 | 331 | −7.5% | |
| 1920 | 283 | −14.5% | |
| 1930 | 298 | 5.3% | |
| 1940 | 288 | −3.4% | |
| 1950 | 350 | 21.5% | |
| 1960 | 411 | 17.4% | |
| 1970 | 705 | 71.5% | |
| 1980 | 652 | −7.5% | |
| 1990 | 563 | −13.7% | |
| 2000 | 600 | 6.6% | |
| 2010 | 1,106 | 84.3% | |
| Est. 2019 | 1,796 | [4] | 62.4% |
| U.S. Decennial Census[10] | |||
2010 census
As of the census[3] of 2010, there were 1,106 people, 443 households, and 302 families living in the village. The population density was 547.5 inhabitants per square mile (211.4/km2). There were 502 housing units at an average density of 248.5 per square mile (95.9/km2). The racial makeup of the village was 94.3% White, 3.4% African American, 0.7% Asian, and 1.5% from two or more races. Hispanic or Latino of any race were 2.3% of the population.
There were 443 households of which 35.2% had children under the age of 18 living with them, 53.0% were married couples living together, 10.6% had a female householder with no husband present, 4.5% had a male householder with no wife present, and 31.8% were non-families. 26.2% of all households were made up of individuals and 7.7% had someone living alone who was 65 years of age or older. The average household size was 2.50 and the average family size was 3.03.
The median age in the village was 38.2 years. 25.6% of residents were under the age of 18; 7% were between the ages of 18 and 24; 26% were from 25 to 44; 28.9% were from 45 to 64; and 12.6% were 65 years of age or older. The gender makeup of the village was 48.3% male and 51.7% female.
2000 census
As of the census[5] of 2000, there were 600 people, 248 households, and 166 families living in the village. The population density was 579.2/km²; (1,494.9/sq mi;). There were 260 housing units at an average density of 251.0/km²; (647.8/sq mi;). The racial makeup of the village was 98.83% White, 0.17% African American, 0.33% from other races, and 0.67% from two or more races. Hispanic or Latino of any race were 0.33% of the population.
There were 248 households out of which 31.0% had children under the age of 18 living with them, 56.0% were married couples living together, 7.7% had a female householder with no husband present, and 32.7% were non-families. 27.0% of all households were made up of individuals and 9.3% had someone living alone who was 65 years of age or older. The average household size was 2.42 and the average family size was 2.96.
In the village, the population was spread out with 24.5% under the age of 18, 7.8% from 18 to 24, 27.7% from 25 to 44, 24.0% from 45 to 64, and 16.0% who were 65 years of age or older. The median age was 38 years. For every 100 females there were 96.7 males. For every 100 females age 18 and over, there were 95.3 males.
The median income for a household in the village was $40,208, and the median income for a family was $49,500. Males had a median income of $35,714 versus $27,250 for females. The per capita income for the village was $19,442. About 3.1% of families and 5.6% of the population were below the poverty line, including 4.5% of those under the age of 18 and 6.1% of those 65 and older.
Notable person

- Adam Willis Wagnalls, co-founder of Funk & Wagnalls Company
References
- "US Gazetteer files 2010". United States Census Bureau. Archived from the original on 2012-07-02. Retrieved 2013-01-06.
- "US Board on Geographic Names". United States Geological Survey. 2007-10-25. Retrieved 2008-01-31.
- "U.S. Census website". United States Census Bureau. Retrieved 2013-01-06.
- "Population and Housing Unit Estimates". Retrieved May 21, 2020.
- "U.S. Census website". United States Census Bureau. Retrieved 2008-01-31.
- Miller, Charles Christian (1912). History of Fairfield County, Ohio, and representative citizens. Chicago, Richmond-Arnold Pub. Co. p. 133.
- Overman, William Daniel (1958). Ohio Town Names. Akron, OH: Atlantic Press. p. 76.
- "Fairfield County". Jim Forte Postal History. Retrieved 17 December 2015.
- "US Gazetteer files: 2010, 2000, and 1990". United States Census Bureau. 2011-02-12. Retrieved 2011-04-23.
- "Census of Population and Housing". Census.gov. Retrieved June 4, 2015.
External links
Municipalities and communities of Fairfield County, Ohio, United States | ||
|---|---|---|
| Cities |  Map of Ohio highlighting Fairfield County | |
| Villages | ||
| Townships | ||
| CDPs | ||
| Unincorporated communities | ||
| Footnotes | ‡This populated place also has portions in an adjacent county or counties | |
Municipalities and communities of Franklin County, Ohio, United States | ||
|---|---|---|
| Cities | 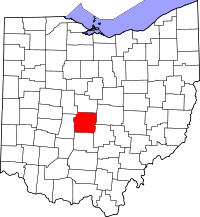 Map of Ohio highlighting Franklin County | |
| Villages | ||
| Townships | ||
| CDPs | ||
| Unincorporated communities | ||
| Footnotes | ‡This populated place also has portions in an adjacent county or counties | |