List of motor vehicle deaths in Australia by year
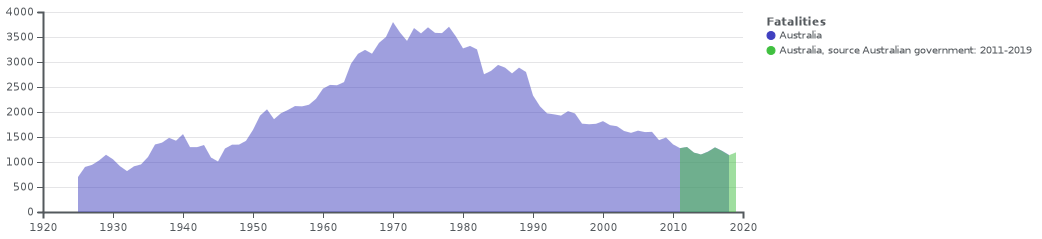
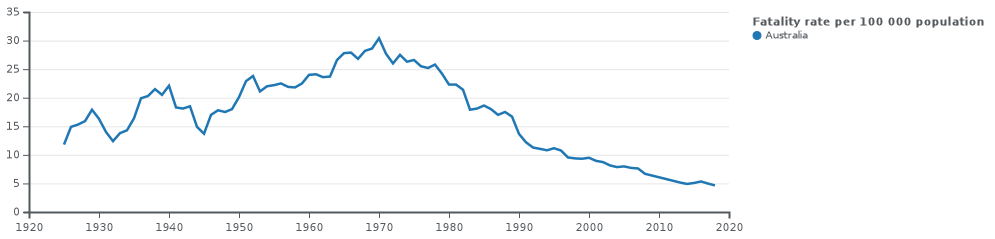
This is a list of motor vehicle deaths in Australia by year. It shows the annual number of road fatalities (road deaths or Road toll) per capita per year, per vehicle and per vehicle-km in the year the data was collected. The list includes all road users such as drivers, passengers, pedestrians, motorcyclists and cyclists.
| Year | Total road fatalities | Road fatalities per 100,000 population per year |
Road fatalities per 100,000 motor vehicles |
Road fatalities per 1 billion vehicle-km |
Source |
|---|---|---|---|---|---|
| 1925 | 700 | 11.8 | 229 | [1] | |
| 1926 | 901 | 14.9 | 231 | ||
| 1927 | 943 | 15.3 | 190 | ||
| 1928 | 1,003 | 15.9 | 177 | ||
| 1929 | 1,145 | 17.9 | 181 | ||
| 1930 | 1,054 | 16.3 | 161 | ||
| 1931 | 916 | 14.0 | 152 | ||
| 1932 | 818 | 12.4 | 139 | ||
| 1933 | 914 | 13.8 | 148 | ||
| 1934 | 952 | 14.3 | 148 | ||
| 1935 | 1,100 | 16.4 | 160 | ||
| 1936 | 1,350 | 19.9 | 182 | ||
| 1937 | 1,387 | 20.3 | 175 | ||
| 1938 | 1,483 | 21.5 | 173 | ||
| 1939 | 1,426 | 20.5 | 159 | ||
| 1940 | 1,558 | 22.1 | 174 | ||
| 1941 | 1,298 | 18.3 | 149 | ||
| 1942 | 1,297 | 18.1 | 173 | ||
| 1943 | 1,340 | 18.5 | 173 | ||
| 1944 | 1,089 | 14.9 | 133 | ||
| 1945 | 1,011 | 13.7 | 118 | ||
| 1946 | 1,270 | 17.0 | 137 | ||
| 1947 | 1,346 | 17.8 | 133 | ||
| 1948 | 1,348 | 17.5 | 122 | ||
| 1949 | 1,424 | 18.0 | 116 | ||
| 1950 | 1,643 | 20.1 | 118 | ||
| 1951 | 1,926 | 22.9 | 122 | ||
| 1952 | 2,054 | 23.8 | 116 | ||
| 1953 | 1,856 | 21.1 | 101 | ||
| 1954 | 1,976 | 22.0 | 101 | ||
| 1955 | 2,042 | 22.2 | 96 | ||
| 1956 | 2,119 | 22.5 | 94 | ||
| 1957 | 2,113 | 21.9 | 89 | ||
| 1958 | 2,146 | 21.8 | 86 | ||
| 1959 | 2,264 | 22.5 | 85 | ||
| 1960 | 2,468 | 24.0 | 87 | ||
| 1961 | 2,542 | 24.1 | 86 | ||
| 1962 | 2,535 | 23.6 | 82 | ||
| 1963 | 2,598 | 23.7 | 79 | ||
| 1964 | 2,966 | 26.6 | 84 | ||
| 1965 | 3,164 | 27.8 | 85 | ||
| 1966 | 3,242 | 27.9 | 83 | ||
| 1967 | 3,166 | 26.8 | 77 | ||
| 1968 | 3,382 | 28.2 | 79 | ||
| 1969 | 3,502 | 28.6 | 78 | ||
| 1970 | 3,798 | 30.4 | 80 | [2] | |
| 1971 | 3,590 | 27.7 | 71 | 44 | |
| 1972 | 3,422 | 26.0 | 64 | ||
| 1973 | 3,679 | 27.5 | 66 | ||
| 1974 | 3,572 | 26.3 | 60 | ||
| 1975 | 3,694 | 26.6 | 59 | ||
| 1976 | 3,583 | 25.5 | 54 | 35.5 | |
| 1977 | 3,578 | 25.2 | 52 | ||
| 1978 | 3,705 | 25.8 | 52 | ||
| 1979 | 3,508 | 24.2 | 48 | 31.5 | |
| 1980 | 3,272 | 22.3 | 43 | ||
| 1981 | 3,321 | 22.3 | 42 | ||
| 1982 | 3,252 | 21.4[3] | 39 | 25.6 | |
| 1983 | 2,755 | 17.9 | 32 | [3] | |
| 1984 | 2,822 | 18.1 | 32 | [3] | |
| 1985 | 2,941 | 18.63 | 32.3 | 20.9 | |
| 1986 | 2,888 | 18.0 | 31 | [3] | |
| 1987 | 2,772 | 17.0 | 30 | [3] | |
| 1988 | 2,887 | 17.5 | 30 | 18.8 | [3] |
| 1989 | 2,801 | 16.7 | 29 | [3] | |
| 1990 | 2,331 | 13.66 | 23.1 | ||
| 1991 | 2,113 | 12.2 | 21 | 14.1 | [3] |
| 1992 | 1,974 | 11.28 | 19 | ||
| 1993 | 1,953 | 11.05 | 19 | ||
| 1994 | 1,928 | 10.80 | 18.0 | ||
| 1995 | 2,017 | 11.16 | 18.4 | 12.1 | |
| 1996 | 1,970 | 10.76 | 17.3 | ||
| 1997 | 1,767 | 9.54 | 15.1 | ||
| 1998 | 1,755 | 9.38 | 14.5 | 10.5 | |
| 1999 | 1,764 | 9.32 | 14.4 | ||
| 2000 | 1,817 | 9.49 | 14.6 | 9.8 | |
| 2001 | 1,737 | 8.95 | 13.9 | 9.1 | |
| 2002 | 1,715 | 8.73 | 13.4 | 8.9 | |
| 2003 | 1,621 | 8.15 | 12.3 | 8.0 | |
| 2004 | 1,583 | 7.86 | 11.7 | 8.0 | |
| 2005 | 1,627 | 7.98 | 11.7 | 7.9 | |
| 2006 | 1,598 | 7.72 | 11.2 | 7.7 | |
| 2007 | 1,603 | 7.62 | 10.8 | 7.4 | |
| 2008 | 1,437 | 6.68 | 9 | 6.5 | [3][4] |
| 2009 | 1,491 | 6.78, or 6.86[5] | 10 | 6.7 | [3] |
| 2010 | 1,353 | 6.06, or 6.14[5] | 8.4 | 6.1 | [2][3][6] |
| 2011 | 1,277 | 5.71, or 5.72[5] | 5.5 | 5.5 | [3][7] |
| 2012 | 1,300 | 5.78, or 5.73[5] | 5.4 | 5.5 | [7][8] |
| 2013 | 1,187 | 5.16 | 4.6 | 5.0 | [5][7] |
| 2014 | 1,150 | 4.91 | 4.5 | 4.8 | [7][9] |
| 2015 | 1,209 | 5.08 | 5.0 | [10] | |
| 2016 | 1,293 | 5.34 | 5.0 | [10] | |
| 2017 | 1,225 | 4.98 | 5.0 | [10] | |
| 2018 | 1,135 | 4.60 | 4.0 | [10] | |
| 2019 | 1,194 | [11] |
Graph
See also
References
- "Road crash casualties and rates, Australia, 1925 to latest year" (PDF). The Department of Infrastructure, Regional Development and Cities. Australian Transport Safety Bureau. Retrieved 24 December 2018.
- "Road Safety". Department of Infrastructure, Transport, Regional Development and Local Government. Retrieved 7 July 2011.
- "Road Deaths Australia 2011 Statistical Summary" (PDF). Bureau of Infrastructure, Transport and Regional Economics. Department of Infrastructure and Transport. May 2012. Archived from the original (PDF) on 14 November 2012. Retrieved 5 June 2012.
- "Road Deaths Australia, 2008 Statistical Summary". Department of Infrastructure, Transport, Regional Development and Local Government. 14 May 2009. Retrieved 7 July 2011.
- Road Deaths Australia : December 2013 Monthly Bulletin; Bureau of Infrastructure, Transport and Regional Economics (BITRE)
- "International road safety comparisons 2010" (PDF). Bureau of Infrastructure, Transport and Regional Economics. Department of Infrastructure and Transport. April 2012. Archived from the original (PDF) on 11 April 2013. Retrieved 5 June 2012.
- "Road Deaths Australia 2014 Statistical Summary" (PDF). Bureau of Infrastructure, Transport and Regional Economics. Department of Infrastructure and Transport. July 2015. Retrieved 22 April 2016.
- "Road Deaths Australia 2012 Statistical Summary" (PDF). Bureau of Infrastructure, Transport and Regional Economics. Department of Infrastructure and Regional Development. Retrieved 7 January 2014.
- Road Deaths Australia : December 2015 Monthly Bulletin; Bureau of Infrastructure, Transport and Regional Economics (BITRE)
- "Road Trauma Australia—Annual Summaries | Bureau of Infrastructure, Transport and Regional Economics". www.bitre.gov.au. Retrieved 17 December 2019.
- https://app.powerbi.com/
This article is issued from Wikipedia. The text is licensed under Creative Commons - Attribution - Sharealike. Additional terms may apply for the media files.