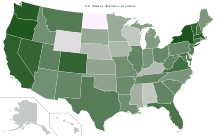
List of U.S. states ranked per five-factor model personality trait
This article contains a table of the 50 U.S. states and the U.S. District of Columbia listed by each personality trait as defined by the five-factor model of personality.
| Part of a series on |
| Psychology |
|---|
 |
|
Five-factor model
The five-factory model is a taxonomy that attempts to classify personality types via a basis of five key personality dimensions. These dimensions were chosen based on commonly used verbal descriptions of personalities in such a way that tries to describe personalities without using commonly correlated descriptors.[1] The dimensions used in this model are extraversion, agreeableness, conscientiousness, neuroticism, and openness to experience.
Several studies have identified multiple confounding traits to geographic variance which correlate to each of the above personality traits, such as a negative correlation between criminality and agreeableness.[2]
Methodology
The data in this article are sourced from a 2008 APS study which utilized data collected from 1999 to 2005 during a separate personality study involving online participants, as well as multiple secondary data sources to capture population, crime, and occupation statistics.[2] The 2008 study compiled and normalized the data to correct for duplicate responses and underrepresented populations.[2]
Personality dimensions by State
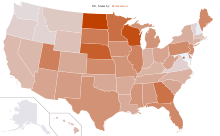
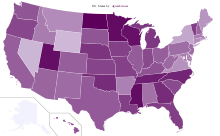
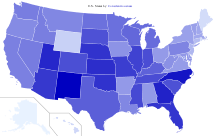
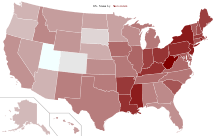
| Extraversion | Agreeableness | Conscientiousness | Neuroticism | Openness | |||||||
|---|---|---|---|---|---|---|---|---|---|---|---|
| State | Rank | Score | Rank | Score | Rank | Score | Rank | Score | Rank | Score | Sample size |
| 20 | 0.22 | 36 | −0.27 | 36 | −0.53 | 30 | −0.26 | 48 | −1.32 | 11,985 | |
| 49 | −1.63 | 51 | −4.33 | 51 | −3.00 | 47 | −1.20 | 49 | −1.37 | 4,317 | |
| 24 | −0.03 | 31 | −0.06 | 9 | 1.06 | 45 | −1.09 | 31 | −0.02 | 12,570 | |
| 31 | −0.21 | 41 | −0.53 | 37 | −0.54 | 10 | 1.01 | 27 | 0.06 | 4,424 | |
| 38 | −0.57 | 28 | 0.04 | 27 | −0.13 | 37 | −0.53 | 6 | 1.05 | 71,873 | |
| 28 | −0.19 | 29 | 0.03 | 15 | 0.69 | 50 | −1.97 | 8 | 0.97 | 11,446 | |
| 33 | −0.36 | 43 | −0.72 | 46 | −1.11 | 15 | 0.54 | 12 | 0.65 | 6,836 | |
| 21 | 0.15 | 37 | −0.29 | 34 | −0.48 | 19 | 0.21 | 42 | −0.93 | 1,881 | |
| 3 | 1.73 | 50 | −2.13 | 40 | −0.61 | 31 | −0.35 | 1 | 3.26 | 2,155 | |
| 10 | 0.65 | 14 | 0.55 | 8 | 1.11 | 36 | −0.50 | 13 | 0.59 | 27,424 | |
| 6 | 1.22 | 8 | 0.87 | 3 | 1.43 | 33 | −0.39 | 20 | 0.19 | 18,807 | |
| 39 | −0.58 | 24 | 0.17 | 49 | −1.57 | 40 | −0.74 | 46 | −1.28 | 2,940 | |
| 46 | −1.22 | 39 | −0.45 | 26 | −0.09 | 32 | −0.36 | 30 | −0.02 | 3,178 | |
| 9 | 0.80 | 26 | 0.07 | 11 | 0.90 | 20 | 0.21 | 21 | 0.17 | 27,739 | |
| 34 | −0.36 | 19 | 0.38 | 14 | 0.71 | 13 | 0.88 | 34 | −0.18 | 13,515 | |
| 15 | 0.45 | 15 | 0.54 | 33 | −0.44 | 22 | 0.15 | 43 | −0.97 | 6,514 | |
| 13 | 0.56 | 17 | 0.47 | 5 | 1.24 | 34 | −0.44 | 38 | −0.52 | 6,976 | |
| 36 | −0.41 | 21 | 0.22 | 19 | 0.37 | 7 | 1.17 | 45 | −1.10 | 7,827 | |
| 30 | −0.20 | 13 | 0.55 | 30 | −0.24 | 8 | 1.14 | 29 | −0.01 | 6,519 | |
| 11 | 0.64 | 46 | −0.86 | 50 | −1.64 | 12 | 0.90 | 35 | −0.22 | 3,540 | |
| 51 | −1.99 | 38 | −0.42 | 35 | −0.51 | 17 | 0.45 | 10 | 0.74 | 12,286 | |
| 42 | −0.81 | 40 | −0.51 | 43 | −0.75 | 11 | 0.98 | 4 | 1.20 | 16,154 | |
| 17 | 0.37 | 11 | 0.69 | 21 | 0.21 | 26 | −0.09 | 36 | −0.30 | 21,938 | |
| 5 | 1.29 | 2 | 1.41 | 22 | 0.14 | 41 | −0.80 | 40 | −0.67 | 14,532 | |
| 19 | 0.34 | 3 | 1.39 | 12 | 0.79 | 4 | 1.50 | 41 | −0.80 | 3,609 | |
| 18 | 0.35 | 16 | 0.51 | 10 | 0.97 | 25 | −0.09 | 32 | −0.04 | 12,565 | |
| 43 | −0.94 | 42 | −0.71 | 29 | −0.24 | 39 | −0.71 | 16 | 0.43 | 1,945 | |
| 4 | 1.71 | 10 | 0.74 | 7 | 1.15 | 44 | −1.00 | 44 | −1.07 | 4,410 | |
| 37 | −0.55 | 48 | −1.41 | 24 | −0.06 | 42 | −0.83 | 9 | 0.94 | 3,531 | |
| 50 | −1.87 | 30 | −0.05 | 44 | −0.82 | 14 | 0.70 | 14 | 0.58 | 3,255 | |
| 14 | 0.54 | 34 | −0.17 | 45 | −1.03 | 5 | 1.47 | 15 | 0.49 | 16,580 | |
| 22 | 0.15 | 33 | −0.17 | 1 | 2.40 | 29 | −0.20 | 23 | 0.14 | 4,077 | |
| 32 | −0.31 | 47 | −1.17 | 42 | −0.67 | 3 | 1.55 | 2 | 1.32 | 32,602 | |
| 35 | −0.39 | 7 | 0.98 | 2 | 1.65 | 24 | −0.06 | 33 | −0.18 | 16,432 | |
| 1 | 3.08 | 1 | 1.60 | 23 | 0.13 | 43 | −0.84 | 51 | −3.12 | 2,372 | |
| 25 | −0.05 | 27 | 0.04 | 38 | −0.56 | 9 | 1.10 | 24 | 0.12 | 24,018 | |
| 27 | −0.14 | 9 | 0.86 | 6 | 1.16 | 27 | −0.15 | 37 | −0.46 | 8,095 | |
| 44 | −1.10 | 18 | 0.42 | 31 | −0.31 | 48 | −1.27 | 3 | 1.26 | 10,211 | |
| 12 | 0.60 | 35 | −0.21 | 28 | −0.19 | 6 | 1.22 | 25 | 0.09 | 25,915 | |
| 40 | −0.61 | 45 | −0.84 | 48 | −1.55 | 2 | 1.61 | 28 | 0.04 | 2,021 | |
| 26 | −0.07 | 20 | 0.36 | 16 | 0.66 | 16 | 0.53 | 26 | 0.09 | 5,918 | |
| 7 | 0.97 | 23 | 0.19 | 17 | 0.65 | 49 | −1.68 | 39 | −0.61 | 1,572 | |
| 29 | −0.19 | 6 | 1.08 | 13 | 0.72 | 23 | 0.11 | 19 | 0.19 | 10,662 | |
| 16 | 0.42 | 25 | 0.12 | 18 | 0.42 | 28 | −0.17 | 17 | 0.40 | 45,432 | |
| 8 | 0.89 | 4 | 1.36 | 4 | 1.36 | 51 | −2.52 | 18 | 0.28 | 8,368 | |
| 47 | −1.22 | 12 | 0.55 | 41 | −0.66 | 18 | 0.43 | 7 | 0.99 | 1,637 | |
| 45 | −1.16 | 44 | −0.80 | 39 | −0.58 | 21 | 0.18 | 11 | 0.71 | 18,093 | |
| 48 | −1.37 | 22 | 0.19 | 25 | −0.07 | 46 | −1.10 | 5 | 1.20 | 17,890 | |
| 23 | 0.06 | 32 | −0.15 | 32 | −0.41 | 1 | 2.36 | 22 | 0.15 | 3,412 | |
| 2 | 2.14 | 5 | 1.32 | 20 | 0.29 | 35 | −0.45 | 47 | −1.31 | 15,863 | |
| 41 | −0.78 | 49 | −1.44 | 47 | −1.46 | 38 | −0.59 | 50 | −1.80 | 1,536 | |
See also
- Big Five personality traits
- Iowa nice
- List of U.S. states and territories by median wage and mean wage
- List of U.S. states and territories by GDP
- List of U.S. states by homicide rate
- Minnesota nice
- Seattle Freeze
- Southern hospitality
References
- Goldberg LR (January 1993). "The structure of phenotypic personality traits". American Psychologist. 48 (1): 26–34. doi:10.1037/0003-066x.48.1.26. PMID 8427480.
- Rentfrow, Peter J.; Gosling, Samuel D.; Potter, Jeff (September 2008). "A Theory of the Emergence, Persistence, and Expression of Geographic Variation in Psychological Characteristics". Perspectives on Psychological Science. 3 (5): 339–369. doi:10.1111/j.1745-6924.2008.00084.x. PMID 26158954.