List of South American countries by GDP (PPP) per capita
This is a list of South American nations by gross domestic product per capita based on purchasing power parity.
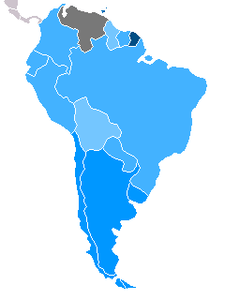
South American countries by GDP PPP per capita according to the International Monetary Fund for 2018
|
>$60,000
$40,000 - $50,000
$30,000 - $40,000
$20,000 - $30,000
$10,000 - $20,000
$5,000 - $10,000
$2,000 - $5,000
<$2,000 |
IMF list
List according to the International Monetary Fund in current international dollars for 2018.[1]
| Rank | Country/Territory | GDP (PPP) per capita (Int$) | Year |
|---|---|---|---|
| 1 | 32,254 | 2018 est. | |
| 2 | 25,978 | 2018 est. | |
| 3 | 23,274 | 2018 est. | |
| 4 | 20,537 | 2018 est. | |
| 5 | 16,154 | 2018 est. | |
| 6 | 15,105 | 2018 est. | |
| 7 | 14,943 | 2018 est. | |
| 8 | 14,224 | 2018 est. | |
| 9 | 13,395 | 2018 est. | |
| 10 | 11,718 | 2018 est. | |
| 11 | 8,519 | 2018 est. | |
| 12 | 7,477 | 2018 est. | |
| — | n/a | 2018 est. |
CIA list
All figures are in current international dollars according to The World Factbook by the Central Intelligence Agency, rounded to the nearest hundred.[2]
| South American Rank | World Rank | Nation | GDP (PPP) per capita (Int$) | Year |
|---|---|---|---|---|
| 1 | 59 | 24,600 | 2017 est. | |
| 2 | 63 | 22,400 | 2017 est. | |
| 3 | 66 | 20,700 | 2017 est. | |
| 4 | 84 | 15,500 | 2017 est. | |
| 5 | 89 | 14,500 | 2017 est. | |
| 6 | 90 | 13,900 | 2017 est. | |
| 7 | 93 | 13,300 | 2017 est. | |
| 8 | 100 | 12,400 | 2017 est. | |
| 9 | 109 | 11,200 | 2017 est. | |
| 10 | 113 | 9,800 | 2017 est. | |
| 11 | 121 | 8,300 | 2017 est. | |
| 12 | 125 | 7,500 | 2017 est. |
References
- "World Economic Outlook Database, April 2019". IMF.org. International Monetary Fund. Retrieved 30 August 2019.
- "COUNTRY COMPARISON :: GDP - PER CAPITA (PPP)". Central Intelligence Agency. Central Intelligence Agency. Retrieved 10 April 2018.
This article is issued from Wikipedia. The text is licensed under Creative Commons - Attribution - Sharealike. Additional terms may apply for the media files.