Lidar
Lidar (/ˈlaɪdɑːr/, also LIDAR, LiDAR, and LADAR) is a method for measuring distances (ranging) by illuminating the target with laser light and measuring the reflection with a sensor. Differences in laser return times and wavelengths can then be used to make digital 3-D representations of the target. It has terrestrial, airborne, and mobile applications.
The term lidar was originally a portmanteau of light and radar.[1][2] It is now also used as an acronym of "light detection and ranging"[3] and "laser imaging, detection, and ranging".[4][5] Lidar sometimes is called 3-D laser scanning, a special combination of a 3-D scanning and laser scanning.
Lidar is commonly used to make high-resolution maps, with applications in surveying, geodesy, geomatics, archaeology, geography, geology, geomorphology, seismology, forestry, atmospheric physics,[6] laser guidance, airborne laser swath mapping (ALSM), and laser altimetry. The technology is also used in control and navigation for some autonomous cars.[7][8]
History and etymology
Under the direction of Malcolm Stitch, the Hughes Aircraft Company introduced the first lidar-like system in 1961,[9][10] shortly after the invention of the laser. Intended for satellite tracking, this system combining laser-focused imaging with the ability to calculate distances by measuring the time for a signal to return using appropriate sensors and data acquisition electronics. It was originally called "Colidar" an acronym for "COherent Light Detecting And Ranging,"[11] derived from the term "radar", itself an acronym for "Radio Detection And Ranging". From the early colidar systems all laser rangefinders, laser altimeters and lidar units are derived. The first practical terrestrial application of a colidar system was the "Colidar Mark II", a large rifle-like laser rangefinder produced in 1963 which had a range of 7 miles and an accuracy of 15 feet, to be used for military targeting.[12][10] The first mention of lidar as a stand-alone word in 1963 suggests it originated as a portmanteau of "light" and "radar": "Eventually the laser may provide an extremely sensitive detector of particular wavelengths from distant objects. Meanwhile, it is being used to study the moon by 'lidar' (light radar) ..."[2] The Oxford English Dictionary supports this etymology.[1]
Lidar's first applications came in meteorology, where the National Center for Atmospheric Research used it to measure clouds and pollution.[13] The general public became aware of the accuracy and usefulness of lidar systems in 1971 during the Apollo 15 mission, when astronauts used a laser altimeter to map the surface of the moon. Although the English language no longer treats "radar" as an acronym, and printed texts universally present the word uncapitalized, the word "lidar" became capitalized as "LIDAR" or "LiDAR" in some publications beginning in the 1980s. Currently, no consensus exists on capitalization, reflecting uncertainty about whether or not "lidar" is an acronym, and if it is an acronym, whether it should appear in lower case, like "radar" and "sonar". Various publications refer to lidar as "LIDAR", "LiDAR", "LIDaR", or "Lidar". The USGS uses both "LIDAR" and "lidar", sometimes in the same document;[14] the New York Times predominantly uses "lidar" for staff-written articles,[15] although contributing news feeds such as Reuters may use Lidar.[16]
General description
Lidar uses ultraviolet, visible, or near infrared light to image objects. It can target a wide range of materials, including non-metallic objects, rocks, rain, chemical compounds, aerosols, clouds and even single molecules.[6] A narrow laser beam can map physical features with very high resolutions; for example, an aircraft can map terrain at 30-centimetre (12 in) resolution or better.[17]
The essential concept of lidar was originated by EH Synge in 1930, who envisaged the use of powerful searchlights to probe the atmosphere.[18][19] Indeed, lidar has since been used extensively for atmospheric research and meteorology. Lidar instruments fitted to aircraft and satellites carry out surveying and mapping – a recent example being the U.S. Geological Survey Experimental Advanced Airborne Research Lidar.[20] NASA has identified lidar as a key technology for enabling autonomous precision safe landing of future robotic and crewed lunar-landing vehicles.[21]
Wavelengths vary to suit the target: from about 10 micrometers (infrared) to approximately 250 nm (UV). Typically, light is reflected via backscattering, as opposed to pure reflection one might find with a mirror. Different types of scattering are used for different lidar applications: most commonly Rayleigh scattering, Mie scattering, Raman scattering, and fluorescence.[6] Suitable combinations of wavelengths can allow for remote mapping of atmospheric contents by identifying wavelength-dependent changes in the intensity of the returned signal.[22]
Design
The two kinds of lidar detection schemes are "incoherent" or direct energy detection (which principally measures amplitude changes of the reflected light) and coherent detection (best for measuring Doppler shifts, or changes in phase of the reflected light). Coherent systems generally use optical heterodyne detection.[23] This is more sensitive than direct detection and allows them to operate at much lower power, but requires more complex transceivers.
Both types employ pulse models: either micropulse or high energy. Micropulse systems utilize intermittent bursts of energy. They developed as a result of ever-increasing computer power, combined with advances in laser technology. They use considerably less energy in the laser, typically on the order of one microjoule, and are often "eye-safe", meaning they can be used without safety precautions. High-power systems are common in atmospheric research, where they are widely used for measuring atmospheric parameters: the height, layering and densities of clouds, cloud particle properties (extinction coefficient, backscatter coefficient, depolarization), temperature, pressure, wind, humidity, and trace gas concentration (ozone, methane, nitrous oxide, etc.).[6]
Components
Lidar systems consist of several major components.
Laser
600–1000 nm lasers are most common for non-scientific applications. The maximum power of the laser is limited, or an automatic shut off system which turns the laser off at specific altitudes is used in order to make it eye safe for the people on the ground.
One common alternative, 1550 nm lasers, are eye-safe at relatively high power levels since this wavelength is not strongly absorbed by the eye, but the detector technology is less advanced and so these wavelengths are generally used at longer ranges with lower accuracies. They are also used for military applications because 1550 nm is not visible in night vision goggles, unlike the shorter 1000 nm infrared laser.
Airborne topographic mapping lidars generally use 1064 nm diode pumped YAG lasers, while bathymetric (underwater depth research) systems generally use 532 nm frequency doubled diode pumped YAG lasers because 532 nm penetrates water with much less attenuation than does 1064 nm. Laser settings include the laser repetition rate (which controls the data collection speed). Pulse length is generally an attribute of the laser cavity length, the number of passes required through the gain material (YAG, YLF, etc.), and Q-switch (pulsing) speed. Better target resolution is achieved with shorter pulses, provided the lidar receiver detectors and electronics have sufficient bandwidth.[6]
Flash lidar
In flash lidar, the entire field of view is illuminated with a wide diverging laser beam in a single pulse. This is in contrast to conventional scanning lidar, which uses a collimated laser beam that illuminates a single point at a time, and the beam is raster scanned to illuminate the field of view point-by-point. This illumniation method requires a different detection scheme as well. In both scanning and flash lidar, a time-of-flight camera is used to collect information about both the 3-D location and intensity of the light incident on it in every frame. However, in scanning lidar, this camera contains only a point sensor, while in flash lidar, the camera contains either a 1-D or a 2-D sensor array, each pixel of which collects 3-D location and intensity information. In both cases, the depth information is collected using the time of flight of the laser pulse (i.e., the time it takes each laser pulse to hit the target and return to the sensor), which requires the pulsing of the laser and acquisition by the camera to be synchronized.[24] The result is a camera that takes pictures of distance, instead of colors.[25]
As with all forms of lidar, the onboard source of illumination makes flash lidar an active sensor.[26] The signal that is returned is processed by embedded algorithms to produce a nearly instantaneous 3-D rendering of objects and terrain features within the field of view of the sensor.[27] The laser pulse repetition frequency is sufficient for generating 3-D videos with high resolution and accuracy.[24][28] The high frame rate of the sensor makes it a useful tool for a variety of applications that benefit from real-time visualization, such as highly precise remote landing operations.[29] By immediately returning a 3D elevation mesh of target landscapes, a flash sensor can be used to identify optimal landing zones in autonomous spacecraft landing scenarios.[30]
Seeing at a distance requires a powerful burst of light. The power is limited to levels that do not damage human retinas. Wavelengths must not affect human eyes. However, low-cost silicon imagers do not read light in the eye-safe spectrum. Instead, gallium-arsenide imagers are required, which can boost costs to $200,000.[25] Gallium-arsenide is the same compound used to produce high-cost, high-efficiency solar panels usually used in space applications.
Phased arrays
A phased array can illuminate any direction by using a microscopic array of individual antennas. Controlling the timing (phase) of each antenna steers a cohesive signal in a specific direction.
Phased arrays have been used in radar since the 1950s. The same technique can be used with light. On the order of a million optical antennas are used to see a radiation pattern of a certain size in a certain direction. The system is controlled by timing the precise flash. A single chip (or a few) replace a $75,000 electromechanical system, drastically reducing costs.[25]
Several companies are working on developing commercial solid-state lidar units, including the company Quanergy which is designing a 905 nm solid state device, although they appear to be having some issues in development.[31]
The control system can change the shape of the lens to enable zoom in/zoom out functions. Specific sub-zones can be targeted at sub-second intervals.[25]
Electromechanical lidar lasts for between 1,000 and 2,000 hours. By contrast, solid-state lidar can run for 100,000 hours.[25]
Microelectromechanical machines
Microelectromechanical mirrors (MEMS) are not entirely solid-state. However, their tiny form factor provides many of the same cost benefits. A single laser is directed to a single mirror that can be reoriented to view any part of the target field. The mirror spins at a rapid rate. However, MEMS systems generally operate in a single plane (left to right). To add a second dimension generally requires a second mirror that moves up and down. Alternatively, another laser can hit the same mirror from another angle. MEMS systems can be disrupted by shock/vibration and may require repeated calibration. The goal is to create a small microchip to enhance innovation and further technological advances.[25]
Scanner and optics
Image development speed is affected by the speed at which they are scanned. Options to scan the azimuth and elevation include dual oscillating plane mirrors, a combination with a polygon mirror and a dual axis scanner. Optic choices affect the angular resolution and range that can be detected. A hole mirror or a beam splitter are options to collect a return signal.
Photodetector and receiver electronics
Two main photodetector technologies are used in lidar: solid state photodetectors, such as silicon avalanche photodiodes, or photomultipliers. The sensitivity of the receiver is another parameter that has to be balanced in a lidar design.
Position and navigation systems
Lidar sensors mounted on mobile platforms such as airplanes or satellites require instrumentation to determine the absolute position and orientation of the sensor. Such devices generally include a Global Positioning System receiver and an inertial measurement unit (IMU).
Sensor
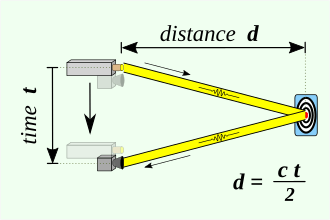
Lidar uses active sensors that supply their own illumination source. The energy source hits objects and the reflected energy is detected and measured by sensors. Distance to the object is determined by recording the time between transmitted and backscattered pulses and by using the speed of light to calculate the distance traveled.[32] Flash LIDAR allows for 3-D imaging because of the camera's ability to emit a larger flash and sense the spatial relationships and dimensions of area of interest with the returned energy. This allows for more accurate imaging because the captured frames do not need to be stitched together, and the system is not sensitive to platform motion resulting in less distortion.[33]
3-D imaging can be achieved using both scanning and non-scanning systems. "3-D gated viewing laser radar" is a non-scanning laser ranging system that applies a pulsed laser and a fast gated camera. Research has begun for virtual beam steering using Digital Light Processing (DLP) technology.
Imaging lidar can also be performed using arrays of high speed detectors and modulation sensitive detector arrays typically built on single chips using complementary metal–oxide–semiconductor (CMOS) and hybrid CMOS/Charge-coupled device (CCD) fabrication techniques. In these devices each pixel performs some local processing such as demodulation or gating at high speed, downconverting the signals to video rate so that the array can be read like a camera. Using this technique many thousands of pixels / channels may be acquired simultaneously.[34] High resolution 3-D lidar cameras use homodyne detection with an electronic CCD or CMOS shutter.[35]
A coherent imaging lidar uses synthetic array heterodyne detection to enable a staring single element receiver to act as though it were an imaging array.[36]
In 2014, Lincoln Laboratory announced a new imaging chip with more than 16,384 pixels, each able to image a single photon, enabling them to capture a wide area in a single image. An earlier generation of the technology with one fourth that number of pixels was dispatched by the U.S. military after the January 2010 Haiti earthquake; a single pass by a business jet at 3,000 meters (10,000 ft.) over Port-au-Prince was able to capture instantaneous snapshots of 600-meter squares of the city at a resolution of 30 centimetres (12 in), displaying the precise height of rubble strewn in city streets.[37] The Lincoln system is 10x faster. The chip uses indium gallium arsenide (InGaAs), which operates in the infrared spectrum at a relatively long wavelength that allows for higher power and longer ranges. In many applications, such as self-driving cars, the new system will lower costs by not requiring a mechanical component to aim the chip. InGaAs uses less hazardous wavelengths than conventional silicon detectors, which operate at visual wavelengths.[38]
Types
Based on orientation
Lidar can be oriented to nadir, zenith, or laterally. For example, lidar altimeters look down, an atmospheric lidar looks up, and lidar-based collision avoidance systems are side-looking.
Based on platform
Lidar applications can be divided into airborne and terrestrial types.[39] The two types require scanners with varying specifications based on the data's purpose, the size of the area to be captured, the range of measurement desired, the cost of equipment, and more. Spaceborne platforms are also possible, see satellite laser altimetry.
Airborne
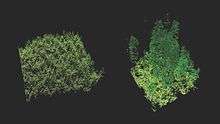
Airborne lidar (also airborne laser scanning) is when a laser scanner, while attached to an aircraft during flight, creates a 3-D point cloud model of the landscape. This is currently the most detailed and accurate method of creating digital elevation models, replacing photogrammetry. One major advantage in comparison with photogrammetry is the ability to filter out reflections from vegetation from the point cloud model to create a digital terrain model which represents ground surfaces such as rivers, paths, cultural heritage sites, etc., which are concealed by trees. Within the category of airborne lidar, there is sometimes a distinction made between high-altitude and low-altitude applications, but the main difference is a reduction in both accuracy and point density of data acquired at higher altitudes. Airborne lidar can also be used to create bathymetric models in shallow water.[40]
The main constituents of airborne lidar include digital elevation models (DEM) and digital surface models (DSM). The points and ground points are the vectors of discrete points while DEM and DSM are interpolated raster grids of discrete points. The process also involves capturing of digital aerial photographs. In order to interpret deep-seated landslides for example, under the cover of vegetation, scarps, tension cracks or tipped trees airborne lidar is used. Airborne lidar digital elevation models can see through the canopy of forest cover, perform detailed measurements of scarps, erosion and tilting of electric poles.[41]
Airborne lidar data is processed using a toolbox called Toolbox for Lidar Data Filtering and Forest Studies (TIFFS)[42] for lidar data filtering and terrain study software. The data is interpolated to digital terrain models using the software. The laser is directed at the region to be mapped and each point's height above the ground is calculated by subtracting the original z-coordinate from the corresponding digital terrain model elevation. Based on this height above the ground the non-vegetation data is obtained which may include objects such as buildings, electric power lines, flying birds, insects, etc. The rest of the points are treated as vegetation and used for modeling and mapping. Within each of these plots, lidar metrics are calculated by calculating statistics such as mean, standard deviation, skewness, percentiles, quadratic mean, etc.[42]
Airborne lidar bathymetry
The airborne lidar bathymetric technological system involves the measurement of time of flight of a signal from a source to its return to the sensor. The data acquisition technique involves a sea floor mapping component and a ground truth component that includes video transects and sampling. It works using a green spectrum (532 nm) laser beam.[43] Two beams are projected onto a fast rotating mirror, which creates an array of points. One of the beams penetrates the water and also detects the bottom surface of the water under favorable conditions.
The data obtained shows the full extent of the land surface exposed above the sea floor. This technique is extremely useful as it will play an important role in the major sea floor mapping program. The mapping yields onshore topography as well as underwater elevations. Sea floor reflectance imaging is another solution product from this system which can benefit mapping of underwater habitats. This technique has been used for three-dimensional image mapping of California's waters using a hydrographic lidar.[44]
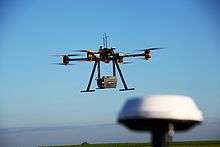
Drones are now being used with laser scanners, as well as other remote sensors, as a more economical method to scan smaller areas.[45] The possibility of drone remote sensing also eliminates any danger that crews of a manned aircraft may be subjected to in difficult terrain or remote areas.
Terrestrial
Terrestrial applications of lidar (also terrestrial laser scanning) happen on the Earth's surface and can be either stationary or mobile. Stationary terrestrial scanning is most common as a survey method, for example in conventional topography, monitoring, cultural heritage documentation and forensics.[39] The 3-D point clouds acquired from these types of scanners can be matched with digital images taken of the scanned area from the scanner's location to create realistic looking 3-D models in a relatively short time when compared to other technologies. Each point in the point cloud is given the colour of the pixel from the image taken located at the same angle as the laser beam that created the point.
Mobile lidar (also mobile laser scanning) is when two or more scanners are attached to a moving vehicle to collect data along a path. These scanners are almost always paired with other kinds of equipment, including GNSS receivers and IMUs. One example application is surveying streets, where power lines, exact bridge heights, bordering trees, etc. all need to be taken into account. Instead of collecting each of these measurements individually in the field with a tachymeter, a 3-D model from a point cloud can be created where all of the measurements needed can be made, depending on the quality of the data collected. This eliminates the problem of forgetting to take a measurement, so long as the model is available, reliable and has an appropriate level of accuracy.
Terrestrial lidar mapping involves a process of occupancy grid map generation. The process involves an array of cells divided into grids which employ a process to store the height values when lidar data falls into the respective grid cell. A binary map is then created by applying a particular threshold to the cell values for further processing. The next step is to process the radial distance and z-coordinates from each scan to identify which 3-D points correspond to each of the specified grid cell leading to the process of data formation.[46]
Applications
There are a wide variety of applications for lidar, in addition to the applications listed below, as it is often mentioned in National lidar dataset programs.
Agriculture
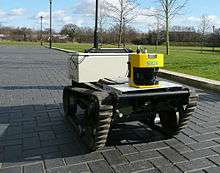
Agricultural robots have been used for a variety of purposes ranging from seed and fertilizer dispersions, sensing techniques as well as crop scouting for the task of weed control.
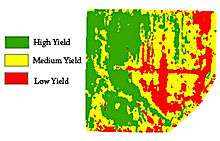
Lidar can help determine where to apply costly fertilizer. It can create a topographical map of the fields and reveal slopes and sun exposure of the farmland. Researchers at the Agricultural Research Service used this topographical data with the farmland yield results from previous years, to categorize land into zones of high, medium, or low yield.[47] This indicates where to apply fertilizer to maximize yield.
Lidar is now used to monitor insects in the field. The use of Lidar can detect the movement and behavior of individual flying insects, with identification down to sex and species.[48] In 2017 a patent application was published on this technology in the United States of America, Europe and China.[49]
Another application is crop mapping in orchards and vineyards, to detect foliage growth and the need for pruning or other maintenance, detect variations in fruit production, or count plants.
Lidar is useful in GPS-denied situations, such as nut and fruit orchards, where foliage blocks GPS signals to precision agriculture equipment or a driverless tractor. Lidar sensors can detect the edges of rows, so that farming equipment can continue moving until GPS signal is reestablished.
Plant species classification
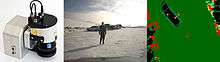
Controlling weeds requires identifying plant species. This can be done by using 3-D lidar and machine learning.[50] Lidar produces plant contours as a "point cloud" with range and reflectance values. This data is transformed, and features are extracted from it. If the species is known, the features are added as new data. The species is labelled and its features are initially stored as an example to identify the species in the real environment. This method is efficient because it uses a low-resolution lidar and supervised learning. It includes an easy-to-compute feature set with common statistical features which are independent of the plant size.[50]
Archaeology
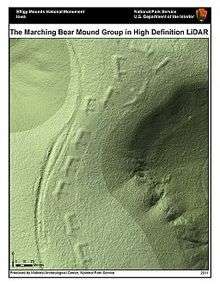
Lidar has many uses in archaeology, including planning of field campaigns, mapping features under forest canopy, and overview of broad, continuous features indistinguishable from the ground.[51] Lidar can produce high-resolution datasets quickly and cheaply. Lidar-derived products can be easily integrated into a Geographic Information System (GIS) for analysis and interpretation.
Lidar can also help to create high-resolution digital elevation models (DEMs) of archaeological sites that can reveal micro-topography that is otherwise hidden by vegetation. The intensity of the returned lidar signal can be used to detect features buried under flat vegetated surfaces such as fields, especially when mapping using the infrared spectrum. The presence of these features affects plant growth and thus the amount of infrared light reflected back.[52] For example, at Fort Beauséjour – Fort Cumberland National Historic Site, Canada, lidar discovered archaeological features related to the siege of the Fort in 1755. Features that could not be distinguished on the ground or through aerial photography were identified by overlaying hill shades of the DEM created with artificial illumination from various angles. Another example is work at Caracol by Arlen Chase and his wife Diane Zaino Chase.[53] In 2012, lidar was used to search for the legendary city of La Ciudad Blanca or "City of the Monkey God" in the La Mosquitia region of the Honduran jungle. During a seven-day mapping period, evidence was found of man-made structures.[54][55] In June 2013, the rediscovery of the city of Mahendraparvata was announced.[56] In southern New England, lidar was used to reveal stone walls, building foundations, abandoned roads, and other landscape features obscured in aerial photography by the region's dense forest canopy.[57][58][59] In Cambodia, lidar data were used by Demian Evans and Roland Fletcher to reveal anthropogenic changes to Angkor landscape [60]
In 2012, Lidar revealed that the Purépecha settlement of Angamuco in Michoacán, Mexico, had about as many buildings as today's Manhattan;[61] while in 2016, its use in mapping ancient Maya causeways in northern Guatemala, revealed 17 elevated roads linking the ancient city of El Mirador to other sites.[62][63] In 2018, archaeologists using lidar discovered more than 60,000 man-made structures in the Maya Biosphere Reserve, a "major breakthrough" that showed the Maya civilization was much larger than previously thought.[64][65][66][67][68][69][70][71][72][73][74]
Autonomous vehicles
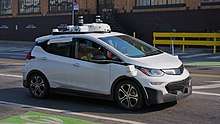
Autonomous vehicles may use lidar for obstacle detection and avoidance to navigate safely through environments.[7][75] Point cloud output from the lidar sensor provides the necessary data for robot software to determine where potential obstacles exist in the environment and where the robot is in relation to those potential obstacles. Singapore's Singapore-MIT Alliance for Research and Technology (SMART) is actively developing technologies for autonomous lidar vehicles.[76] Examples of companies that produce lidar sensors commonly used in vehicle automation are Ouster[77] and Velodyne.[78] Examples of obstacle detection and avoidance products that leverage lidar sensors are the Autonomous Solution, Inc. Forecast 3-D Laser System[79] and Velodyne HDL-64E.[80] Lidar simulation models are also provided in autonomous car simulators.[81]
The very first generations of automotive adaptive cruise control systems used only lidar sensors.
Object detection for transportation systems
In transportation systems, to ensure vehicle and passenger safety and to develop electronic systems that deliver driver assistance, understanding vehicle and its surrounding environment is essential. Lidar systems play an important role in the safety of transportation systems. Lots of electronic systems which add to the driver assistance and vehicle safety such as Adaptive Cruise Control (ACC), Emergency Brake Assist, and Anti-lock Braking System (ABS) depend on the detection of a vehicle's environment to act autonomously or semi-autonomously. Lidar mapping and estimation achieve this.
Basics overview: Current lidar systems use rotating hexagonal mirrors which split the laser beam. The upper three beams are used for vehicle and obstacles ahead and the lower beams are used to detect lane markings and road features.[82] The major advantage of using lidar is that the spatial structure is obtained and this data can be fused with other sensors such as radar, etc. to get a better picture of the vehicle environment in terms of static and dynamic properties of the objects present in the environment. Conversely, a significant issue with lidar is the difficulty in reconstructing point cloud data in poor weather conditions. In heavy rain, for example, the light pulses emitted from the lidar system are partially reflected off of rain droplets which adds noise to the data, called 'echoes'.[83]
Below mentioned are various approaches of processing lidar data and using it along with data from other sensors through sensor fusion to detect the vehicle environment conditions.
GRID based processing using 3-D lidar and fusion with radar measurement
In this method, proposed by Philipp Lindner and Gerd Wanielik, laser data is processed using a multidimensional occupancy grid.[84] Data from a four-layer laser is pre-processed at the signal level and then processed at a higher level to extract the features of the obstacles. A combination two- and three-dimensional grid structure is used and the space in these structures is tessellated into several discrete cells. This method allows a huge amount of raw measurement data to be effectively handled by collecting it in spatial containers, the cells of the evidence grid. Each cell is associated with a probability measure that identifies the cell occupation. This probability is calculated by using the range measurement of the lidar sensor obtained over time and a new range measurement, which are related using Bayes' theorem. A two-dimensional grid can observe an obstacle in front of it, but cannot observe the space behind the obstacle. To address this, the unknown state behind the obstacle is assigned a probability of 0.5. By introducing the third dimension or in other terms using a multi-layer laser, the spatial configuration of an object could be mapped into the grid structure to a degree of complexity. This is achieved by transferring the measurement points into a three-dimensional grid. The grid cells which are occupied will possess a probability greater than 0.5 and the mapping would be color-coded based on the probability. The cells that are not occupied will possess a probability less than 0.5 and this area will usually be white space. This measurement is then transformed to a grid coordinate system by using the sensor position on the vehicle and the vehicle position in the world coordinate system. The coordinates of the sensor depend upon its location on the vehicle and the coordinates of the vehicle are computed using egomotion estimation, which is estimating the vehicle motion relative to a rigid scene. For this method, the grid profile must be defined. The grid cells touched by the transmitted laser beam are calculated by applying Bresenham's line algorithm. To obtain the spatially extended structure, a connected component analysis of these cells is performed. This information is then passed on to a rotating caliper algorithm to obtain the spatial characteristics of the object. In addition to the lidar detection, RADAR data obtained by using two short-range radars is integrated to get additional dynamic properties of the object, such as its velocity. The measurements are assigned to the object using a potential distance function.
- Advantages and disadvantages
The geometric features of the objects are extracted efficiently, from the measurements obtained by the 3-D occupancy grid, using rotating caliper algorithm. Fusing the radar data to the lidar measurements give information about the dynamic properties of the obstacle such as velocity and location of the obstacle with respect to the sensor location which helps the vehicle or the driver decide the action to be performed in order to ensure safety. The only concern is the computational requirement to implement this data processing technique. It can be implemented in real time and has been proven efficient if the 3-D occupancy grid size is considerably restricted. But this can be improved to an even wider range by using dedicated spatial data structures that manipulate the spatial data more effectively, for the 3-D grid representation.
Fusion of 3-D lidar and color camera for multiple object detection and tracking
The framework proposed in this method by Soonmin Hwang et al.,[85] is split into four steps. First, the data from the camera and 3-D lidar is input into the system. Both inputs from lidar and camera are parallelly obtained and the color image from the camera is calibrated with the lidar. To improve the efficiency, horizontal 3-D point sampling is applied as pre-processing. Second, the segmentation stage is where the entire 3-D points are divided into several groups per the distance from the sensor and local planes from close plane to far plane are sequentially estimated. The local planes are estimated using statistical analysis. The group of points closer to the sensor are used to compute the initial plane. By using the current local plane, the next local plane is estimated by an iterative update. The object proposals in the 2-D image are used to separate foreground objects from background. For faster and accurate detection and tracking Binarized Normed Gradients for Objectness Estimation at 300fps is used.[86] BING is a combination of normed gradient and its binarized version which speeds up the feature extraction and testing process, to estimate the objectness of an image window. This way the foreground and background objects are separated. To form objects after estimating the objectness of an image using BING, the 3-D points are grouped or clustered. Clustering is done using DBSCAN (Density-Based Spatial Clustering of Applications with Noise) algorithm which could be robust due to its less-parametric characteristic. Using the clustered 3-D points, i.e. 3-D segment, more accurate region-of-interests (RoIs) are generated by projecting 3-D points on the 2-D image. The third step is detection, which is broadly divided into two parts. First is object detection in 2-D image which is achieved using Fast R-CNN[87] as this method doesn't need training and it also considers an image and several regions of interest. Second is object detection in 3-D space that is done by using the spin image method.[88] This method extracts local and global histograms to represent a certain object. To merge the results of 2-D image and 3-D space object detection, same 3-D region is considered and two independent classifiers from 2-D image and 3-D space are applied to the considered region. Scores calibration[89] is done to get a single confidence score from both detectors. This single score is obtained in the form of probability. The final step is tracking. This is done by associating moving objects in present and past frame. For object tracking, segment matching is adopted. Features such as mean, standard deviation, quantized color histograms, volume size and number of 3-D points of a segment are computed. Euclidean distance is used to measure differences between segments. To judge the appearance and disappearance of an object, similar segments (obtained based on the Euclidean distance) from two different frames are taken and the physical distance and dissimilarity scores are calculated. If the scores go beyond a range for every segment in the previous frame, the object being tracked is considered to have disappeared.
- Advantages and disadvantages
The advantages of this method are using 2-D image and 3-D data together, F l-score (which gives a measure of test's accuracy), average precision (AP) are higher than that when only 3-D data from lidar is used. These scores are conventional measurements which judge the framework. The drawback of this method is the usage of BING for object proposal estimation as BING predicts a small set of object bounding boxes.
Obstacle detection and road environment recognition using lidar
This method proposed by Kun Zhou et al.[90] not only focuses on object detection and tracking but also recognizes lane marking and road features. As mentioned earlier the lidar systems use rotating hexagonal mirrors that split the laser beam into six beams. The upper three layers are used to detect the forward objects such as vehicles and roadside objects. The sensor is made of weather-resistant material. The data detected by lidar are clustered to several segments and tracked by Kalman filter. Data clustering here is done based on characteristics of each segment based on object model, which distinguish different objects such as vehicles, signboards, etc. These characteristics include the dimensions of the object, etc. The reflectors on the rear edges of vehicles are used to differentiate vehicles from other objects. Object tracking is done using a 2-stage Kalman filter considering the stability of tracking and the accelerated motion of objects[82] Lidar reflective intensity data is also used for curb detection by making use of robust regression to deal with occlusions. The road marking is detected using a modified Otsu method by distinguishing rough and shiny surfaces.[91]
- Advantages
Roadside reflectors that indicate lane border are sometimes hidden due to various reasons. Therefore, other information is needed to recognize the road border. The lidar used in this method can measure the reflectivity from the object. Hence, with this data road border can also be recognized. Also, the usage of sensor with weather-robust head helps detecting the objects even in bad weather conditions. Canopy Height Model before and after flood is a good example. Lidar can detect high detailed canopy height data as well as its road border.
Lidar measurements help identify the spatial structure of the obstacle. This helps distinguish objects based on size and estimate the impact of driving over it.[84]
Lidar systems provide better range and a large field of view which helps detecting obstacles on the curves. This is one major advantage over RADAR systems which have a narrower field of view. The fusion of lidar measurement with different sensors makes the system robust and useful in real-time applications, since lidar dependent systems can't estimate the dynamic information about the detected object.[84]
It has been shown that lidar can be manipulated, such that self-driving cars are tricked into taking evasive action.[92]
Biology and conservation
Lidar has also found many applications in forestry. Canopy heights, biomass measurements, and leaf area can all be studied using airborne lidar systems. Similarly, lidar is also used by many industries, including Energy and Railroad, and the Department of Transportation as a faster way of surveying. Topographic maps can also be generated readily from lidar, including for recreational use such as in the production of orienteering maps.[93]
In addition, the Save the Redwoods League has undertaken a project to map the tall redwoods on the Northern California coast. Lidar allows research scientists to not only measure the height of previously unmapped trees, but to determine the biodiversity of the redwood forest. Stephen Sillett, who is working with the League on the North Coast lidar project, claims this technology will be useful in directing future efforts to preserve and protect ancient redwood trees.[94]
Geology and soil science
High-resolution digital elevation maps generated by airborne and stationary lidar have led to significant advances in geomorphology (the branch of geoscience concerned with the origin and evolution of the Earth surface topography). The lidar abilities to detect subtle topographic features such as river terraces and river channel banks, to measure the land-surface elevation beneath the vegetation canopy, to better resolve spatial derivatives of elevation, and to detect elevation changes between repeat surveys have enabled many novel studies of the physical and chemical processes that shape landscapes.[95] In 2005 the Tour Ronde in the Mont Blanc massif became the first high alpine mountain on which lidar was employed to monitor the increasing occurrence of severe rock-fall over large rock faces allegedly caused by climate change and degradation of permafrost at high altitude.[96]
Lidar is also used in structural geology and geophysics as a combination between airborne lidar and GPS for the detection and study of faults, for measuring uplift.[97] The output of the two technologies can produce extremely accurate elevation models for terrain – models that can even measure ground elevation through trees. This combination was used most famously to find the location of the Seattle Fault in Washington, United States.[98] This combination also measures uplift at Mt. St. Helens by using data from before and after the 2004 uplift.[99] Airborne lidar systems monitor glaciers and have the ability to detect subtle amounts of growth or decline. A satellite-based system, the NASA ICESat, includes a lidar sub-system for this purpose. The NASA Airborne Topographic Mapper[100] is also used extensively to monitor glaciers and perform coastal change analysis. The combination is also used by soil scientists while creating a soil survey. The detailed terrain modeling allows soil scientists to see slope changes and landform breaks which indicate patterns in soil spatial relationships.
Atmosphere
Initially, based on ruby lasers, lidar for meteorological applications was constructed shortly after the invention of the laser and represent one of the first applications of laser technology. Lidar technology has since expanded vastly in capability and lidar systems are used to perform a range of measurements that include profiling clouds, measuring winds, studying aerosols, and quantifying various atmospheric components. Atmospheric components can in turn provide useful information including surface pressure (by measuring the absorption of oxygen or nitrogen), greenhouse gas emissions (carbon dioxide and methane), photosynthesis (carbon dioxide), fires (carbon monoxide), and humidity (water vapor). Atmospheric lidars can be either ground-based, airborne or satellite depending on the type of measurement.
Atmospheric lidar remote sensing works in two ways –
- by measuring backscatter from the atmosphere, and
- by measuring the scattered reflection off the ground (when the lidar is airborne) or other hard surface.
Backscatter from the atmosphere directly gives a measure of clouds and aerosols. Other derived measurements from backscatter such as winds or cirrus ice crystals require careful selecting of the wavelength and/or polarization detected. Doppler lidar and Rayleigh Doppler lidar are used to measure temperature and/or wind speed along the beam by measuring the frequency of the backscattered light. The Doppler broadening of gases in motion allows the determination of properties via the resulting frequency shift.[101] Scanning lidars, such as the conical-scanning NASA HARLIE LIDAR, have been used to measure atmospheric wind velocity.[102] The ESA wind mission ADM-Aeolus will be equipped with a Doppler lidar system in order to provide global measurements of vertical wind profiles.[103] A doppler lidar system was used in the 2008 Summer Olympics to measure wind fields during the yacht competition.[104]
Doppler lidar systems are also now beginning to be successfully applied in the renewable energy sector to acquire wind speed, turbulence, wind veer, and wind shear data. Both pulsed and continuous wave systems are being used. Pulsed systems use signal timing to obtain vertical distance resolution, whereas continuous wave systems rely on detector focusing.
The term, eolics, has been proposed to describe the collaborative and interdisciplinary study of wind using computational fluid mechanics simulations and Doppler lidar measurements.[105]
The ground reflection of an airborne lidar gives a measure of surface reflectivity (assuming the atmospheric transmittance is well known) at the lidar wavelength, however, the ground reflection is typically used for making absorption measurements of the atmosphere. "Differential absorption lidar" (DIAL) measurements utilize two or more closely spaced (<1 nm) wavelengths to factor out surface reflectivity as well as other transmission losses, since these factors are relatively insensitive to wavelength. When tuned to the appropriate absorption lines of a particular gas, DIAL measurements can be used to determine the concentration (mixing ratio) of that particular gas in the atmosphere. This is referred to as an Integrated Path Differential Absorption (IPDA) approach, since it is a measure of the integrated absorption along the entire lidar path. IPDA lidars can be either pulsed[106][107] or CW[108] and typically use two or more wavelengths.[109] IPDA lidars have been used for remote sensing of carbon dioxide[106][107][108] and methane.[110]
Synthetic array lidar allows imaging lidar without the need for an array detector. It can be used for imaging Doppler velocimetry, ultra-fast frame rate (MHz) imaging, as well as for speckle reduction in coherent lidar.[36] An extensive lidar bibliography for atmospheric and hydrospheric applications is given by Grant.[111]
Scheimpflug principle
Another lidar technique for atmospheric remote sensing has emerged. It is based on Scheimpflug principle, referred to as Scheimpflug lidar (slidar).[112]
"The implication of the Scheimpflug principle is that when a laser beam is transmitted into the atmosphere, the backscattering echo of the entire illuminating probe volume is still in focus simultaneously without diminishing the aperture as long as the object plane, image plane and the lens plane intersect with each other".[113] A two dimensional CCD/CMOS camera is used to resolve the backscattering echo of the transmitted laser beam.
Thus as in the case of conventional lidar technologies continuous wave light sources such as diode lasers can be employed for remote sensing instead of using complicated nanosecond pulse light sources.[113] The SLidar system is also a robust and inexpensive system based on compact laser diodes and array detectors.[113][114][115] [115] A continuous-wave (CW) NO2 DIAL system based on the Scheimpflug principle has been developed by employing a compact high-power CW multimode 450 nm laser diode as the light source. Laser emissions at the on-line and off-line wavelengths of the NO2 absorption spectrum are implemented by tuning the injection current of the laser diode. Lidar signals are detected by a 45° tilted area CCD image sensor satisfying the Scheimpflug principle. Range-resolved NO2 concentrations on a near-horizontal path are obtained by the NO2 DIAL system in the range of 0.3–3 km and show good agreement with those measured by a conventional air pollution monitoring station. A detection sensitivity of ± 0.9 ppbv at 95% confidence level in the region of 0.3–1 km is achieved with 15-minute averaging and 700 m range resolution during hours of darkness, which allows accurate concentration measurement of ambient NO2. The low-cost and robust DIAL system demonstrated in this work opens up many possibilities for field NO2 remote sensing applications.[116]
Law enforcement
Lidar speed guns are used by the police to measure the speed of vehicles for speed limit enforcement purposes.[117] Additionally, it is used in forensics to aid in crime scene investigations. Scans of a scene are taken to record exact details of object placement, blood, and other important information for later review. These scans can also be used to determine bullet trajectory in cases of shootings.[118]
Military
Few military applications are known to be in place and are classified (such as the lidar-based speed measurement of the AGM-129 ACM stealth nuclear cruise missile), but a considerable amount of research is underway in their use for imaging. Higher resolution systems collect enough detail to identify targets, such as tanks. Examples of military applications of lidar include the Airborne Laser Mine Detection System (ALMDS) for counter-mine warfare by Areté Associates.[119]
A NATO report (RTO-TR-SET-098) evaluated the potential technologies to do stand-off detection for the discrimination of biological warfare agents. The potential technologies evaluated were Long-Wave Infrared (LWIR), Differential Scattering (DISC), and Ultraviolet Laser Induced Fluorescence (UV-LIF). The report concluded that : Based upon the results of the lidar systems tested and discussed above, the Task Group recommends that the best option for the near-term (2008–2010) application of stand-off detection systems is UV-LIF ,[120] however, in the long-term, other techniques such as stand-off Raman spectroscopy may prove to be useful for identification of biological warfare agents.
Short-range compact spectrometric lidar based on Laser-Induced Fluorescence (LIF) would address the presence of bio-threats in aerosol form over critical indoor, semi-enclosed and outdoor venues such as stadiums, subways, and airports. This near real-time capability would enable rapid detection of a bioaerosol release and allow for timely implementation of measures to protect occupants and minimize the extent of contamination.[121]
The Long-Range Biological Standoff Detection System (LR-BSDS) was developed for the U.S. Army to provide the earliest possible standoff warning of a biological attack. It is an airborne system carried by a helicopter to detect synthetic aerosol clouds containing biological and chemical agents at long range. The LR-BSDS, with a detection range of 30 km or more, was fielded in June 1997.[122] Five lidar units produced by the German company Sick AG were used for short range detection on Stanley, the autonomous car that won the 2005 DARPA Grand Challenge.
A robotic Boeing AH-6 performed a fully autonomous flight in June 2010, including avoiding obstacles using lidar.[123][124]
Mining
For the calculation of ore volumes is accomplished by periodic (monthly) scanning in areas of ore removal, then comparing surface data to the previous scan.[125]
Lidar sensors may also be used for obstacle detection and avoidance for robotic mining vehicles such as in the Komatsu Autonomous Haulage System (AHS)[126] used in Rio Tinto's Mine of the Future.
Physics and astronomy
A worldwide network of observatories uses lidars to measure the distance to reflectors placed on the moon, allowing the position of the moon to be measured with millimeter precision and tests of general relativity to be done. MOLA, the Mars Orbiting Laser Altimeter, used a lidar instrument in a Mars-orbiting satellite (the NASA Mars Global Surveyor) to produce a spectacularly precise global topographic survey of the red planet. Laser altimeters produced global elevation models of Mars, the Moon (e Lunar Orbiter Laser Altimeter (LOLA) Mercury (Mercury Laser Altimeter (MLA), NEAR–Shoemaker Laser Rangefinder (NLR).[127] Future missions will also include laser altimeter experiments such as the Ganymede Laser Altimeter (GALA) as part of the Jupiter Icy Moons Explorer (JUICE) mission.[128]
In September, 2008, the NASA Phoenix Lander used lidar to detect snow in the atmosphere of Mars.[129]
In atmospheric physics, lidar is used as a remote detection instrument to measure densities of certain constituents of the middle and upper atmosphere, such as potassium, sodium, or molecular nitrogen and oxygen. These measurements can be used to calculate temperatures. Lidar can also be used to measure wind speed and to provide information about vertical distribution of the aerosol particles.[130]
At the JET nuclear fusion research facility, in the UK near Abingdon, Oxfordshire, lidar Thomson Scattering is used to determine Electron Density and Temperature profiles of the plasma.[131]
Rock mechanics
Lidar has been widely used in rock mechanics for rock mass characterization and slope change detection. Some important geomechanical properties from the rock mass can be extracted from the 3-D point clouds obtained by means of the lidar. Some of these properties are:
- Discontinuity orientation [132][133][134]
- Discontinuity spacing and RQD [134][135][136]
- Discontinuity aperture
- Discontinuity persistence [134][136][137]
- Discontinuity roughness [136]
- Water infiltration
Some of these properties have been used to assess the geomechanical quality of the rock mass through the RMR index. Moreover, as the orientations of discontinuities can be extracted using the existing methodologies, it is possible to assess the geomechanical quality of a rock slope through the SMR index.[138] In addition to this, the comparison of different 3-D point clouds from a slope acquired at different times allows researchers to study the changes produced on the scene during this time interval as a result of rockfalls or any other landsliding processes.[139][140][141]
THOR
THOR is a laser designed toward measuring Earth's atmospheric conditions. The laser enters a cloud cover[142] and measures the thickness of the return halo. The sensor has a fiber optic aperture with a width of 7.5 inches that is used to measure the return light.
Robotics
Lidar technology is being used in robotics for the perception of the environment as well as object classification.[143] The ability of lidar technology to provide three-dimensional elevation maps of the terrain, high precision distance to the ground, and approach velocity can enable safe landing of robotic and manned vehicles with a high degree of precision.[21] Lidar are also widely used in robotics for simultaneous localization and mapping and well integrated into robot simulators.[144] Refer to the Military section above for further examples.
Spaceflight
Lidar is increasingly being utilized for rangefinding and orbital element calculation of relative velocity in proximity operations and stationkeeping of spacecraft. Lidar has also been used for atmospheric studies from space. Short pulses of laser light beamed from a spacecraft can reflect off tiny particles in the atmosphere and back to a telescope aligned with the spacecraft laser. By precisely timing the lidar 'echo,' and by measuring how much laser light is received by the telescope, scientists can accurately determine the location, distribution and nature of the particles. The result is a revolutionary new tool for studying constituents in the atmosphere, from cloud droplets to industrial pollutants, which are difficult to detect by other means."[145][146]
Laser altimetry is used to make digital elevation maps of planets, including the Mars Orbital Laser Altimeter (MOLA) mapping of Mars,[147] the Lunar Orbital Laser Altimeter (LOLA)[148] and Lunar Altimeter (LALT) mapping of the Moon, and the Mercury Laser Altimeter (MLA) mapping of Mercury.[149]
Surveying
Airborne lidar sensors are used by companies in the remote sensing field. They can be used to create a DTM (Digital Terrain Model) or DEM (Digital Elevation Model); this is quite a common practice for larger areas as a plane can acquire 3–4 km wide swaths in a single flyover. Greater vertical accuracy of below 50 mm can be achieved with a lower flyover, even in forests, where it is able to give the height of the canopy as well as the ground elevation. Typically, a GNSS receiver configured over a georeferenced control point is needed to link the data in with the WGS (World Geodetic System).[150]
LiDAR are also in use in hydrographic surveying. Depending upon the clarity of the water LiDAR can measure depths from 0.9m to 40m with a vertical accuracy of 15 cm and horizontal accuracy of 2.5m.[151]
Forestry
Lidar systems have also been applied to improve forestry management.[152] Measurements are used to take inventory in forest plots as well as calculate individual tree heights, crown width and crown diameter. Other statistical analysis use lidar data to estimate total plot information such as canopy volume, mean, minimum and maximum heights, and vegetation cover estimates. Aerial LiDAR has been used to map the bush fires in Australia in early 2020. The data was manipulated to view bare earth, and identify healthy and burned vegetation.[153]
Transport

Lidar has been used in the railroad industry to generate asset health reports for asset management and by departments of transportation to assess their road conditions. CivilMaps.com is a leading company in the field.[154] Lidar has been used in adaptive cruise control (ACC) systems for automobiles. Systems such as those by Siemens, Hella, Ouster and Cepton use a lidar device mounted on the front of the vehicle, such as the bumper, to monitor the distance between the vehicle and any vehicle in front of it.[155] In the event, the vehicle in front slows down or is too close, the ACC applies the brakes to slow the vehicle. When the road ahead is clear, the ACC allows the vehicle to accelerate to a speed preset by the driver. Refer to the Military section above for further examples. A lidar-based device, the Ceilometer is used at airports worldwide to measure the height of clouds on runway approach paths.[156]
Wind farm optimization
Lidar can be used to increase the energy output from wind farms by accurately measuring wind speeds and wind turbulence.[157][158] Experimental lidar systems[159][160] can be mounted on the nacelle[161] of a wind turbine or integrated into the rotating spinner[162] to measure oncoming horizontal winds,[163] winds in the wake of the wind turbine,[164] and proactively adjust blades to protect components and increase power. Lidar is also used to characterise the incident wind resource for comparison with wind turbine power production to verify the performance of the wind turbine[165] by measuring the wind turbine's power curve.[166] Wind farm optimization can be considered a topic in applied eolics. Another aspect of Lidar in wind related industry is to use computational fluid dynamics over Lidar-scanned surfaces in order to assess the wind potential,[167] which can be used for optimal wind farms placement.
Solar photovoltaic deployment optimization
Lidar can also be used to assist planners and developers in optimizing solar photovoltaic systems at the city level by determining appropriate roof tops [168][169] and for determining shading losses.[170] Recent airborne laser scanning efforts have focused on ways to estimate the amount of solar light hitting vertical building facades,[171] or by incorporating more detailed shading losses by considering the influence from vegetation and larger surrounding terrain.[172]
Video games
Recent simulation racing games such as rFactor Pro, iRacing, Assetto Corsa and Project CARS increasingly feature race tracks reproduced from 3-D point clouds acquired through Lidar surveys, resulting in surfaces replicated with centimeter or millimeter precision in the in-game 3-D environment.[173][174][175]
The 2017 exploration game Scanner Sombre, by Introversion Software, uses Lidar as a fundamental game mechanic.
Other uses
The video for the song "House of Cards" by Radiohead was believed to be the first use of real-time 3-D laser scanning to record a music video. The range data in the video is not completely from a lidar, as structured light scanning is also used.[176]
Alternative technologies
Recent development of Structure From Motion (SFM) technologies allows delivering 3-D images and maps based on data extracted from visual and IR photography. The elevation or 3-D data is extracted using multiple parallel passes over mapped area, yielding both visual light images and 3-D structure from the same sensor, which is often a specially chosen and calibrated digital camera.
See also
- Atomic line filter
- Ceilometer a Ground Based lidar for cloud height measurement
- Clear-air turbulence
- CLidar
- Laser rangefinder
- LAS file format
- libLAS, a BSD-licensed C++ library for reading/writing ASPRS LAS lidar data
- Lidar detector
- List of laser articles – Wikipedia list article
- National lidar dataset (all countries)
- National Lidar Dataset (United States)
- Optech
- Optical heterodyne detection
- Optical time-domain reflectometer
- Photogrammetry – Taking measurements using photography
- Range imaging
- Satellite laser ranging
- Seafloor mapping#LiDAR
- SODAR
- Time-domain reflectometry
- TopoFlight
References
- Oxford English Dictionary. 2013. p. Entry for "lidar".
- James Ring, "The Laser in Astronomy." pp. 672–73, New Scientist June 20, 1963.
- "LIDAR—Light Detection and Ranging—is a remote sensing method used to examine the surface of the Earth". NOAA. Archived from the original on May 30, 2013. Retrieved June 4, 2013.
- Travis S. Taylor (2019), Introduction to Laser Science and Engineering, CRC Press.
- Jie Shan and Charles K. Toth (2018), Topographic Laser Ranging and Scanning: Principles and Processing, Second Edition, CRC Press,
- Cracknell, Arthur P.; Hayes, Ladson (2007) [1991]. Introduction to Remote Sensing (2 ed.). London: Taylor and Francis. ISBN 978-0-8493-9255-9. OCLC 70765252.
- Lim, Hazel Si Min; Taeihagh, Araz (2019). "Algorithmic Decision-Making in AVs: Understanding Ethical and Technical Concerns for Smart Cities". Sustainability. 11 (20): 5791. doi:10.3390/su11205791.
- "Want to Ride in a Self-Driving Car? This Is What It's Like". futurism.com. 2018-02-28. Retrieved 28 April 2020.
- "New Radar System". Odessa American. 28 Feb 1961.
- Macomber, Frank (June 3, 1963). "Space Experts Seek Harness for Powerful LASER Light". Bakersfield Californian (p. 5). Copley News Service. Retrieved 11 July 2019.
- Stitch (21 April 1961). Electronics. 51: 2. Missing or empty
|title=(help) - "Laser Measures Distance". Lincoln Journal Star (p. 6). 29 March 1963.
- Goyer, G. G.; R. Watson (September 1963). "The Laser and its Application to Meteorology". Bulletin of the American Meteorological Society. 44 (9): 564–575 [568]. Bibcode:1963BAMS...44..564G. doi:10.1175/1520-0477-44.9.564.
- "CLICK". Lidar.cr.usgs.gov. 2015-09-16. Archived from the original on 2016-02-19. Retrieved 2016-02-22.
- "NYTimes.com search". nytimes.com. Retrieved 2017-04-07.
- "Waymo Self-Driving Unit Sought Arbitration Over Engineer Now at Uber". nytimes.com. 2017-03-29. Retrieved 2017-04-07.
- Carter, Jamie; Keil Schmid; Kirk Waters; Lindy Betzhold; Brian Hadley; Rebecca Mataosky; Jennifer Halleran (2012). "Lidar 101: An Introduction to Lidar Technology, Data, and Applications." (NOAA) Coastal Services Center" (PDF). Coast.noaaa.gov. p. 14. Retrieved 2017-02-11.
- Philosophical Magazine and Journal of Science, 1930, Series 7, Volume 9, Issue 60, pp. 1014–1020
- Donegan, J.F.; The Life and Works of Edward Hutchinson Synge pp. 31, 67, (co-edited with D. Weaire and P. Florides), Pöllauberg, Austria : Living Edition, ISBN 3901585176
- 'Experimental Advanced Advanced Research Lidar', USGS.gov. Retrieved 8 August 2007.
- Amzajerdian, Farzin; Pierrottet, Diego F.; Petway, Larry B.; Hines, Glenn D.; Roback, Vincent E. (2011-05-24). "Lidar Systems for Precision Navigation and Safe Landing on Planetary Bodies". International Symposium on Photoelectronic Detection and Imaging 2011: Laser Sensing and Imaging; and Biological and Medical Applications of Photonics Sensing and Imaging. 8192: 819202. Bibcode:2011SPIE.8192E..02A. doi:10.1117/12.904062. hdl:2060/20110012163. Retrieved May 24, 2011.
- P. Dakin, John; Brown, Robert (2017). Handbook of Optoelectronics: Concepts, Devices, and Techniques (Volume One). CRC Press. p. 678. ISBN 978-1-4822-4179-2.
- Rashid A. Ganeev (2013-10-17). Laser - Surface Interactions. Springer Science & Business Media,2013. p. 32. ISBN 9789400773417.
- "Advanced Scientific Concepts Inc". advancedscientificconcepts.com. Retrieved 2019-03-08.
- Mokey, Nick (2018-03-15). "A self-driving car in every driveway? Solid-state lidar is the key". Digital Trends. Retrieved 2018-06-15.
- "Passive vs Active Sensors in Remote Sensing". GIS Geography. 2015-02-09. Retrieved 2019-03-08.
- "Patent Details". technology.nasa.gov. Retrieved 2019-03-08.
- "Analog to Digital Conversion: Sampling". cl.cam.ac.uk. Retrieved 2019-03-08.
- "Imaging Flash Lidar for Autonomous Safe Landing and Spacecraft Proximity Operation" (PDF). https://ntrs.nasa.gov. 2019-05-07. External link in
|website=(help) - Dietrich, Ann Brown, "Supporting Autonomous Navigation with Flash Lidar Images in Proximity to Small Celestial Bodies" (2017). CU Boulder Aerospace Engineering Sciences Graduate Theses & Dissertations. 178.
- Lee, Timothy B. (1 February 2019). "How 10 leading companies are trying to make powerful, low-cost lidar". Ars Technica.
- "Remote Sensors | Earthdata". earthdata.nasa.gov. Retrieved 2017-03-18.

- "Advanced Scientific Concepts Inc". advancedscientificconcepts.com. Retrieved 2019-03-11.
- Medina, Antonio. "Three Dimensional Camera and Rangefinder". January 1992. United States Patent 5081530. Cite journal requires
|journal=(help) - Medina A, Gayá F, Pozo F (2006). "Compact laser radar and three-dimensional camera". J. Opt. Soc. Am. A. 23 (4): 800–805. Bibcode:2006JOSAA..23..800M. doi:10.1364/josaa.23.000800. PMID 16604759.
- Strauss, C. E. M. (1994). "Synthetic-array heterodyne detection: a single-element detector acts as an array". Opt. Lett. 19 (20): 1609–1611. Bibcode:1994OptL...19.1609S. doi:10.1364/ol.19.001609. PMID 19855597.
- "The World's Most Powerful 3-D Laser Imager". technologyreview.com. 2014-02-13. Retrieved 2017-04-06.
- Talbot, David (2014-02-13). "New Optical Chip Will Sharpen Military and Archeological Aerial Imaging". MIT Technology Review. Retrieved 2014-02-17.
- Vosselman, George; Maas, Hans-Gerd (2012). Airborne and terrestrial laser scanning. Whittles Publishing. ISBN 978-1-904445-87-6.
- Doneus, M.; Miholjek, I.; Mandlburger, G.; Doneus, N.; Verhoeven, G.; Briese, Ch.; Pregesbauer, M. (2015). "Airborne laser bathymetry for documentation of submerged archaeological sites in shallow water". ISPRS – International Archives of the Photogrammetry, Remote Sensing and Spatial Information Sciences. XL-5/W5: 99–107. Bibcode:2015ISPArXL55...99D. doi:10.5194/isprsarchives-xl-5-w5-99-2015.
- Chiu, Cheng-Lung; Fei, Li-Yuan; Liu, Jin-King; Wu, Ming-Chee. "National Airborne Lidar Mapping and Examples for applications in deep-seated landslides in Taiwan". Geoscience and Remote Sensing Symposium (IGARSS), 2015 IEEE International. ISSN 2153-7003.
- Yuan, Zeng; Yujin, Zhao; Dan, Zhao; Bingfang, Wu. "Forest Biodiversity mapping using airborne and hyper-spectral data". Geoscience and Remote Sensing Symposium (IGARSS), 2016 IEEE International. ISSN 2153-7003.
- Nayegandhi Green Lidar
- Wilson, Jerry C. (2008). "Using Airborne Hydrographic LiDAR to Support Mapping of California's Waters". OCEANS 2008 - MTS/IEEE Kobe Techno-Ocean. pp. 1–8. doi:10.1109/OCEANSKOBE.2008.4530980. ISBN 978-1-4244-2126-8.
- Tang, Lina; Shao, Guofan (2015-06-21). "Drone remote sensing for forestry research and practices". Journal of Forestry Research. 26 (4): 791–797. doi:10.1007/s11676-015-0088-y. ISSN 1007-662X.
- Lee, Sang-Mook; Joon Im, Jeong; Lee, Bo-Hee; Leonessa, Alexander; Kurdila, Andrew. "A real time grid-map generation and object classification for ground based 3D lidar data using image analysis techniques". Image Processing (ICIP), 2010 17th IEEE International Conference on Image Processing. ISSN 1522-4880.
- "ARS Study Helps Farmers Make Best Use of Fertilizers". USDA Agricultural Research Service. June 9, 2010.
- Brydegaard, Mikkel; Brydegaard, Mikkel; Brydegaard, Mikkel; Brydegaard, Mikkel; Kirkeby, Carsten; Kirkeby, Carsten; Ignell, Rickard; Jansson, Samuel; Jansson, Samuel (2017-05-14). "Multispectral polarimetric modulation spectroscopy for species and sex determination of Malaria disease vectors". Conference on Lasers and Electro-Optics (2017), Paper ATh1B.2. Optical Society of America: ATh1B.2. doi:10.1364/CLEO_AT.2017.ATh1B.2. ISBN 978-1-943580-27-9.
- "Improvements in or relating to optical remote sensing systems for aerial and aquatic fauna, and use thereof". Google Patents. Retrieved 4 June 2019.
- Weiss, Ulrich; Biber, Peter; Laible, Stefan; Bohlmann, Karsten; Zell, Andreas (2010). Plant Species Classification using a 3D LIDAR Sensor and Machine Learning. Ninth International Conference on Machine Learning and Applications (ICMLA). ISBN 978-1-4244-9211-4.
- "EID; crater beneath canopy". Unb.ca. 2013-02-18. Retrieved 2013-05-06.
- The Light Fantastic: Using airborne lidar in archaeological survey. English Heritage. 2010. p. 45.
- John Nobel Wilford (2010-05-10). "Mapping Ancient Civilization, in a Matter of Days". New York Times. Retrieved 2010-05-11.
- Stephanie Pappas (May 15, 2013). "Ruins of Lost City May Lurk Deep in Honduras Rain Forest". Live Science. Retrieved May 15, 2013.
- Douglas Preston (2 Mar 2015). "Lost City Discovered in the Honduran Rain Forest". National Geographic. Retrieved 3 March 2015.
- "Jungle surrenders its lost city". Smh.com.au. 2013-06-14. Retrieved 2016-02-22.
- Johnson, Katharine M; Ouimet, William B (2014). "Rediscovering the lost archaeological landscape of southern New England using airborne light detection and ranging (LiDAR)". Journal of Archaeological Science. 43: 9–20. doi:10.1016/j.jas.2013.12.004.
- Edwin Cartlidge (2014-01-10). "Lasers Unearth Lost 'Agropolis' of New England | Science | AAAS". News.sciencemag.org. Retrieved 2016-02-22.
- ""Lost" New England Revealed by High-Tech Archaeology". News.nationalgeographic.com. 2014-01-03. Retrieved 2016-02-22.
- Evans, D.H.; Fletcher, R.J.; et al. (2013). "Uncovering archaeological landscapes at Angkor using lidar". PNAS. 110 (31): 12595–12600. Bibcode:2013PNAS..11012595E. doi:10.1073/pnas.1306539110. PMC 3732978. PMID 23847206.
- Davis, Nicola (February 15, 2018). "Laser scanning reveals 'lost' ancient Mexican city 'had as many buildings as Manhattan'". The Guardian – via www.theguardian.com.
- "LiDAR Scans Reveal Maya Civilization's Sophisticated Network of Roads". https://www.smithsonianmag.com/smart-news/lidar-scans-maya-network-roads-180961995/. Retrieved February 28, 2018. External link in
|website=(help) - "Ancient Mayan Superhighways Found in the Guatemala Jungle". 2017-01-27.
- "This Ancient Civilization Was Twice As Big As Medieval England". 2018-02-01. Retrieved 2018-02-05.
- "Archaeologists Find Ancient Lost Cities Using Lasers". www.msn.com. Retrieved 2019-09-08.
- "This Ancient Civilization Was Twice As Big As Medieval England". National Geographic News. 2018-02-01. Retrieved 2019-09-08.
- "Sprawling Maya network discovered under Guatemala jungle". 2018-02-02.
- "ARCHAEOLOGISTS FIND ANCIENT MAYAN LOST CITIES IN GUATEMALA USING LASERS". NEWSWEEK. 2018-09-29.
- Little, Becky. "Lasers Reveal 60,000 Ancient Maya Structures in Guatemala". HISTORY. Retrieved 2019-09-08.
- "Hidden Ancient Mayan 'Megalopolis' With 60,000 Structures Discovered in Guatemala Using Lasers". www.yahoo.com. Retrieved 2019-09-08.
- Berke, Jeremy (2018-02-02). "Archaeologists found thousands of hidden structures in the Guatemalan jungle — and it could re-write human history". Business Insider. Retrieved 2019-09-08.
- "HIDDEN ANCIENT MAYAN 'MEGALOPOLIS' WITH 60,000 STRUCTURES DISCOVERED IN GUATEMALA USING LASERS". NEWSWEEK. 2018-02-02.
- Chukwurah, Precious (2018-09-30). "Archaeologists Discover Ancient Mayan Lost City In Northern Guatemala Using Lasers". Nigeria’s Entertainment News, Music, Video, Lifestyle. Retrieved 2019-09-08.
- Wehner, Mike (2018-02-02). "Archaeologists discovered an ancient Mayan megacity hidden in a Guatemalan jungle". BGR. Retrieved 2019-09-08.
- By Steve Taranovich, EDN. "Autonomous automotive sensors: How processor algorithms get their inputs." July 5, 2016. Retrieved August 9, 2016.
- "Filipino turns ordinary car into autonomous vehicle – Motioncars | Motioncars". Motioncars.inquirer.net. 2015-05-25. Retrieved 2016-02-22.
- "Explore and compare different Ouster digital lidar sensors". 2020-06-23. Retrieved 2020-06-23.
- "Smart Powerful Lidar Solutions" Check
|url=value (help). 2020-06-23. Retrieved 2020-06-23. Text " Velodyne Lidar " ignored (help) - "Autonomous Solutions Forecast 3D Laser System". 2013-01-24. Retrieved 2013-05-06.
- "Products". Velodynelidar.com. Retrieved 2016-02-22.
- "Lidar simulation models". 2018-06-26. Retrieved 2018-06-26.
- Takagi, Kiyokazu; Morikawa, Katsuhiro; Ogawa, Takashi; Saburi, Makoto (2006). Road Environment Recognition Using On-vehicle LIDAR. IEEE Intelligent Vehicles Symposium. doi:10.1109/IVS.2006.1689615. ISBN 978-4-901122-86-3.
- Hasirlioglu, Sinan; Kamann, Alexander; Doric, Igor; Brandmeier, Thomas (2016). "Test methodology for rain influence on automotive surround sensors". 2016 IEEE 19th International Conference on Intelligent Transportation Systems (ITSC). pp. 2242–2247. doi:10.1109/ITSC.2016.7795918. ISBN 978-1-5090-1889-5.
- Lindner, Philipp; Wanielik, Gerd (2009). 3D LIDAR Processing for Vehicle Safety and Environment Recognition. IEEE Workshop on Computational Intelligence in Vehicles and Vehicular Systems. doi:10.1109/CIVVS.2009.4938725. ISBN 978-1-4244-2770-3.
- Hwang, Soonmin; Kim, Namil; Choi, Yukyung; Lee, Seokju; So Kweon, In (2016). Fast Multiple Objects Detection and Tracking Fusing Color Camera and 3D LIDAR for Intelligent Vehicles. 13th International Conference on Ubiquitous Robots and Ambient Intelligence (URAI). ISBN 978-1-5090-0821-6.
- Cheng, Ming-Ming; Zhang, Ziming; Lin, Wen-Yan; Torr, Philip (2014). BING: Binarized normed gradients for objectness estimation at 300fps. IEEE Conference on Computer Vision and Pattern Recognition. ISBN 978-1-4799-5118-5.
- Girshick, Ross (2015). "Fast R-CNN". 2015 IEEE International Conference on Computer Vision (ICCV). pp. 1440–1448. doi:10.1109/ICCV.2015.169. ISBN 978-1-4673-8391-2.
- E. Johnson, Andrew; Hebert, Martial (1999). "Using spin images for efficient object recognition in cluttered 3D scenes" (PDF). IEEE Transactions on Pattern Analysis and Machine Intelligence. 21 (5): 433–449. doi:10.1109/34.765655. ISSN 0162-8828.
- Xu, Philippe; Davoine, Franck; Denoeux, Thierry (September 2014). "Evidential combination of pedestrian detectors". Proceedings British Machine Vision Conference, BMVA Press.
- Zhou, Kun; Wang, Xiqin; Tomizukat, Masayoshi; Zhang, Wei-Bin; Chant, Ching-Yao (2002). A New Manoeuvring Target Tracking Algorithm with Input Estimation. Proceedings of the 2002 American Control Conference. doi:10.1109/ACC.2002.1024798. ISBN 978-0-7803-7298-6.
- Y. Hata, Alberto; F. Wolf, Denis. "Feature Detection for Vehicle Localization in Urban Environments Using a Multilayer LIDAR". IEEE Transactions on Intelligent Transportation System. 17 (2). ISSN 1558-0016.
- Gibbs, Samuel (7 September 2015). "Hackers can trick self-driving cars into taking evasive action". The Guardian.
- "Lidar Links of Use in Mapping". Lidarbasemaps.org. Retrieved 2016-02-22.
- Councillor Quarterly, Summer 2007 Volume 6 Issue 3
- Hughes, M. W.; Quigley, M. C; van Ballegooy, S.; Deam, B. L.; Bradley, B. A.; Hart, D. E. (2015). "The sinking city: Earthquakes increase flood hazard in Christchurch, New Zealand". GSA Today. 25 (3): 4–10. doi:10.1130/Geology. Retrieved 2016-02-22.
- Rabatel, Antoine; Deline, Philip; Jaillet, Ste'phane; Ravanel, Ludovic (28 May 2008). "Rock falls in high-alpine rock walls quantified by terrestrial lidar measurements: A case study in the Mont Blanc area". Geophysical Research Letters. 35 (10): L10502. Bibcode:2008GeoRL..3510502R. doi:10.1029/2008GL033424.
- Cunningham, Dickson; Grebby, Stephen; Tansey, Kevin; Gosar, Andrej; Kastelic, Vanja (2006). "Application of airborne LiDAR to mapping seismogenic faults in forested mountainous terrain, southeastern Alps, Slovenia" (PDF). Geophysical Research Letters. 33 (20): L20308. Bibcode:2006GeoRL..3320308C. doi:10.1029/2006GL027014. ISSN 1944-8007.
- "LIDAR shows where earthquake risks are highest". Seattlepi.com. 2001-04-17. Retrieved 2016-02-22.
- 'Mount Saint Helens LIDAR Data', Washington State Geospatial Data Archive (September 13, 2006). Retrieved 8 August 2007.
- 'Airborne Topographic Mapper', NASA.gov. Retrieved 8 August 2007.
- Li, T. (2011). "Middle atmosphere temperature trend and solar cycle revealed by long-term Rayleigh lidar observations". J. Geophys. Res. 116: D00P05. Bibcode:2011JGRD..116.0P05L. doi:10.1029/2010jd015275.
- Thomas D. Wilkerson, Geary K. Schwemmer, and Bruce M. Gentry. LIDAR Profiling of Aerosols, Clouds, and Winds by Doppler and Non-Doppler Methods, NASA International H2O Project (2002) Archived 2007-08-22 at the Wayback Machine.
- 'Earth Explorers: ADM-Aeolus', ESA.org (European Space Agency, 6 June 2007). Retrieved 8 August 2007.
- 'Doppler lidar gives Olympic sailors the edge', Optics.org (3 July, 2008). Retrieved 8 July 2008.
- Clive, P. J. M., The emergence of eolics, TEDx University of Strathclyde (2014). Retrieved 9 May 2014.
- Koch, Grady J.; Barnes, Bruce W; Petros, Mulugeta; Beyon, Jeffrey Y; Amzajerdian, Farzin; Yu, Jirong; Davis, Richard E; Ismail, Syed; Vay, Stephanie; Kavaya, Michael J; Singh, Upendra N (2004). "Coherent Differential Absorption Lidar Measurements of CO2". Applied Optics. 43 (26): 5092–5099. Bibcode:2004ApOpt..43.5092K. doi:10.1364/AO.43.005092. PMID 15468711.
- Abshire, James B.; Ramanathan, Anand; Riris, Haris; Mao, Jianping; Allan, Graham R.; Hasselbrack, William E.; Weaver, Clark J.; Browell, Edward V. (2013-12-30). "Airborne Measurements of CO2 Column Concentration and Range Using a Pulsed Direct-Detection IPDA Lidar". Remote Sensing. 6 (1): 443–469. Bibcode:2013RemS....6..443A. doi:10.3390/rs6010443.
- Campbell, Joel F. (2013). "Nonlinear swept frequency technique for CO2 measurements using a CW laser system". Applied Optics. 52 (13): 3100–3107. arXiv:1303.4933. Bibcode:2013ApOpt..52.3100C. doi:10.1364/AO.52.003100. PMID 23669780.
- Dobler, Jeremy T.; Harrison, F. Wallace; Browell, Edward V.; Lin, Bing; McGregor, Doug; Kooi, Susan; Choi, Yonghoon; Ismail, Syed (2013). "Atmospheric CO2 column measurements with an airborne intensity-modulated continuous wave 1.57 μm fiber laser lidar". Applied Optics. 52 (12): 2874–2892. Bibcode:2013ApOpt..52.2874D. doi:10.1364/AO.52.002874. PMID 23669700.
- Riris, Haris; Numata, Kenji; Li, Steve; Wu, Stewart; Ramanathan, Anand; Dawsey, Martha; Mao, Jianping; Kawa, Randolph; Abshire, James B. (2012-12-01). "Airborne measurements of atmospheric methane column abundance using a pulsed integrated-path differential absorption lidar". Applied Optics. 51 (34): 8296–305. Bibcode:2012ApOpt..51.8296R. doi:10.1364/AO.51.008296. ISSN 1539-4522. PMID 23207402.
- Grant, W. B., Lidar for atmospheric and hydrospheric studies, in Tunable Laser Applications, 1st Edition, Duarte, F. J. Ed. (Marcel Dekker, New York, 1995) Chapter 7.
- Liang Mei, Mikkel Brydegaard, Continuous-wave differential absorption lidar, Laser and Photonics Reviews 9, 629-636 (2015)
- Mei, Liang (2016-08-08). Remote sensing of atmospheric aerosol and gas using scheimpflug lidar based on diode lasers. Progress in Electromagnetic Research Symposium (PIERS). ISBN 978-1-5090-6094-8.
- Liang Mei and Mikkel Brydegaard, "Atmospheric aerosol monitoring by an elastic Scheimpflug lidar system," Opt. Express 23, A1613-A1628 (2015)
- Liang Mei, Peng Guan, Yang Yang, and Zheng Kong, "Atmospheric extinction coefficient retrieval and validation for the single-band Mie-scattering Scheimpflug lidar technique," Opt. Express 25, A628-A638 (2017)
- Liang Mei; Peng Guan; Zheng Kong (2017). "Remote sensing of atmospheric NO2 by employing the continuous-wave differential absorption lidar technique". Optics Express. 25 (20): A953–A962.
- Gonglach, Matt. "How Police Laser Guns Work".
- "Forensics | FARO Technologies".
- "Areté". Archived from the original on September 4, 2011.
- "NATO Laser Based Stand-Off Detection of biological Agents". Rta.nato.int. Archived from the original on 2011-07-20. Retrieved 2013-05-06.
- "Short-Range Bioaerosol Threat Detection Sensor (SR-BioSpectra)". Ino.ca. Retrieved 2013-05-06.
- "Defense & Security Intelligence & Analysis: IHS Jane's | IHS". Articles.janes.com. Retrieved 2016-02-22.
- Spice, Byron. Researchers Help Develop Full-Size Autonomous Helicopter Archived 2011-06-08 at the Wayback Machine Carnegie Mellon, 6 July 2010. Retrieved: 19 July 2010.
- Koski, Olivia. In a First, Full-Sized Robo-Copter Flies With No Human Help Wired, 14 July 2010. Retrieved: 19 July 2010.
- "Volume Measuring". 3dlasermapping.com. Archived from the original on 2014-04-04. Retrieved 2014-02-17.
- Modular Mining Systems#Autonomous Haulage Systems
- Hargitai, Henrik; Willner, Konrad; Buchroithner, Manfred (2019), Hargitai, Henrik (ed.), "Methods in Planetary Topographic Mapping: A Review", Planetary Cartography and GIS, Lecture Notes in Geoinformation and Cartography, Springer International Publishing, pp. 147–174, doi:10.1007/978-3-319-62849-3_6, ISBN 978-3-319-62849-3
- Hargitai, Henrik; Willner, Konrad; Buchroithner, Manfred (2019), Hargitai, Henrik (ed.), "Methods in Planetary Topographic Mapping: A Review", Planetary Cartography and GIS, Lecture Notes in Geoinformation and Cartography, Springer International Publishing, pp. 147–174, doi:10.1007/978-3-319-62849-3_6, ISBN 978-3-319-62849-3
- NASA. 'NASA Mars Lander Sees Falling Snow, Soil Data Suggest Liquid Past' NASA.gov (29 September 2008). Retrieved 9 November 2008.
- "Cloud-Aerosol Lidar with Orthogonal Polarization (CALIOP)". NASA. Retrieved 16 August 2015.
- CW Gowers. ' Focus On : Lidar-Thomson Scattering Diagnostic on JET' JET.EFDA.org (undated). Retrieved 8 August 2007. Archived September 18, 2007, at the Wayback Machine
- Riquelme, A.J.; Abellán, A.; Tomás, R.; Jaboyedoff, M. (2014). "A new approach for semi-automatic rock mass joints recognition from 3D point clouds" (PDF). Computers & Geosciences. 68: 38–52. Bibcode:2014CG.....68...38R. doi:10.1016/j.cageo.2014.03.014. hdl:10045/36557.
- Gigli, G.; Casagli, N. (2011). "Semi-automatic extraction of rock mass structural data from high resolution LIDAR point clouds". International Journal of Rock Mechanics and Mining Sciences. 48 (2): 187–198. doi:10.1016/j.ijrmms.2010.11.009.
- Slob, S. 2010. Automated rock mass characterization using 3D terrestrial laser scanner, Technical University of Delf.
- Riquelme, A.J.; Abellán, A.; Tomás, R. (2015). "Discontinuity spacing analysis in rock masses using 3D point clouds". Engineering Geology. 195: 185–195. doi:10.1016/j.enggeo.2015.06.009. hdl:10045/47912.
- Sturzenegger, M.; Stead, D. (2009). "Close-range terrestrial digital photogrammetry and terrestrial laser scanning for discontinuity characterization on rock cuts". Engineering Geology. 106 (3–4): 163–182. doi:10.1016/j.enggeo.2009.03.004.
- Riquelme, Adrián; Tomás, Roberto; Cano, Miguel; Pastor, José Luis; Abellán, Antonio (2018-05-24). "Automatic Mapping of Discontinuity Persistence on Rock Masses Using 3D Point Clouds" (PDF). Rock Mechanics and Rock Engineering. 51 (10): 3005–3028. Bibcode:2018RMRE...51.3005R. doi:10.1007/s00603-018-1519-9. ISSN 0723-2632.
- Riquelme, Adrián J.; Tomás, Roberto; Abellán, Antonio (2016-04-01). "Characterization of rock slopes through slope mass rating using 3D point clouds". International Journal of Rock Mechanics and Mining Sciences. 84: 165–176. doi:10.1016/j.ijrmms.2015.12.008. hdl:10045/52313.
- Abellán, A.; Oppikofer, T.; Jaboyedoff, M.; Rosser, N.J.; Lim, M.; Lato, M.J. (2014). "Terrestrial laser scanning of rock slope instabilities". Earth Surface Processes and Landforms. 39 (1): 80–97. Bibcode:2014ESPL...39...80A. doi:10.1002/esp.3493.
- Abellán, A.; Vilaplana, J.M.; Martínez, J. (2006). "Application of a long-range Terrestrial Laser Scanner to a detailed rockfall study at Vall de Núria (Eastern Pyrenees, Spain)". Engineering Geology. 88 (3–4): 136–148. doi:10.1016/j.enggeo.2006.09.012.
- Tomás, R.; Abellán, A.; Cano, M.; Riquelme, A.; Tenza-Abril, A. J.; Baeza-Brotons, F.; Saval, J. M.; Jaboyedoff, M. (2017-08-01). "A multidisciplinary approach for the investigation of a rock spreading on an urban slope". Landslides. 15 (2): 199–217. doi:10.1007/s10346-017-0865-0. ISSN 1612-510X.
- "Lidar | NASA Airborne Science Program". airbornescience.nasa.gov. Retrieved 2017-03-20.
- "IfTAS". Iftas.de. Retrieved 2013-05-06.
- "Lidar simulation models in Webots". Retrieved 2018-06-04.
- "NASA – Lidar In-space Technology Experiment (LITE)". Nasa.gov. 2011-08-25. Retrieved 2013-05-06.
- D.M. Winker; R.H. Couch; M.P. McCormick (2011-09-27). "An overview of LITE: NASA's Lidar In-space Technology Experiment". Proceedings of the IEEE. 84 (2): 164–180. doi:10.1109/5.482227.
- Bruce Banerdt, Orbital Laser Altimeter, The Martian Chronicle, Volume 1, No. 3, NASA.gov. Retrieved 11 March 2019.
- NASA, LOLA. Retrieved 11 March 2019.
- John F. Cavanaugh, et al., "The Mercury Laser Altimeter Instrument for the MESSENGER Mission", Space Sci Rev, DOI 10.1007/s11214-007-9273-4, 24 August 2007. Retrieved 11 March 2019.
- Szulwic, Jakub; Burdziakowski, Paweł; Janowski, Artur; Przyborski, Marek; Tysiąc, Paweł; Wojtowicz, Aleksander; Kholodkov, Arthem; Matysik, Krzysztof; Matysik, Maciej (2015). "Maritime Laser Scanning as the Source for Spatial Data". Polish Maritime Research. 22 (4): 9–14. doi:10.1515/pomr-2015-0064.
- "Bathymetric LiDAR". home.iitk.ac.in. Retrieved 2018-01-17.
- Wulder, Michael A; Bater, Christopher W; Coops, Nicholas C; Hilker, Thomas; White, Joanne C (2008). "The role of LiDAR in sustainable forest management". The Forestry Chronicle. 84 (6): 807–826. CiteSeerX 10.1.1.728.1314. doi:10.5558/tfc84807-6. ISSN 0015-7546.
- https://www.airborneresearch.org.au/fires-2020
- "CivilMaps.com accelerating road and pavement condition surveys". Civil Maps. 2015-03-15. Archived from the original on 2015-04-02. Retrieved 2015-03-15.
- "Bumper-mounted lasers". Sciencedaily.com. 2007-02-27. Retrieved 2013-05-06.
- U.S. Department of Commerce (14 November 2008). "Automated Surface Observing System (ASOS) Implementation Plan" (PDF). weather.gov.
- Clive, P. J. M., Windpower 2.0: technology rises to the challenge Archived 2014-05-13 at the Wayback Machine Environmental Research Web, 2008. Retrieved: 9 May 2014.
- Mikkelsen, Torben; et al. (October 2007). "12MW Horns Rev Experiment" (PDF). Risoe. Archived from the original (PDF) on 2011-07-03. Retrieved 2010-04-25.
- "Smarting from the wind". The Economist. 2010-03-04. Retrieved 2010-04-25.
- "The world's first control of a wind turbine with a nacelle-based Lidar system". Corporate Communications University of Stuttgart. 2012-06-05. Retrieved 2014-04-12.
- Andrew K. Scholbrock et al. Field Testing LIDAR Based Feed-Forward Controls on the NREL Controls Advanced Research Turbine National Renewable Energy Laboratory Data Base, 12 April 2014. Retrieved: 12 April 2014.
- Mikkelsen, Torben & Hansen, Kasper Hjorth et al. Lidar wind speed measurements from a rotating spinner Danish Research Database & Danish Technical University, 20 April 2010. Retrieved: 25 April 2010.
- Asimakopolous, M., Clive, P. J. M., More, G., and Boddington, R., Offshore compression zone measurement and visualisation Archived 2014-05-12 at the Wayback Machine European Wind Energy Association Annual Conference, 2014. Retrieved: 9 May 2014.
- Gallacher, D., and More, G., Lidar measurements and visualisation of turbulence and wake decay length Archived 2014-05-12 at the Wayback Machine European Wind Energy Association Annual Conference, 2014. Retrieved: 9 May 2014.
- Clive, P. J. M., et al., Offshore power curve tests for onshore costs: a real world case study Archived 2014-05-12 at the Wayback Machine European Wind Energy Association Annual Conference, 2014. Retrieved: 9 May 2014.
- Clive, P. J. M., Offshore power performance assessment for onshore costs Archived 2014-04-17 at the Wayback Machine DEWEK (Deutsche Windenergie Konferenz), 2012. Retrieved: 9 May 2014.
- Lukač, Niko; Štumberger Gorazd; Žalik Borut (2017). "Wind resource assessment using airborne LiDAR data and smoothed particle hydrodynamics". Environmental Modelling & Software. 95: 1–12. doi:10.1016/j.envsoft.2017.05.006.
- Jochem, Andreas; Höfle Bernhard; Rutzinger Martin; Pfeifer Norbert (2009). "Automatic roof plane detection and analysis in airborne lidar point clouds for solar potential assessment". Sensors. 9 (7): 5241–5262. doi:10.3390/s90705241. PMC 3274168. PMID 22346695.
- Nguyen, Ha T.; Pearce, Joshua M.; Harrap, Rob; Barber, Gerald (2012). "The Application of LiDAR to Assessment of Rooftop Solar Photovoltaic Deployment Potential on a Municipal District Unit". Sensors. 12 (4): 4534–4558. doi:10.3390/s120404534. PMC 3355426. PMID 22666044.
- Nguyen, Ha T.; Pearce, Joshua M. (2012). "Incorporating shading losses in solar photovoltaic potential assessment at the municipal scale". Solar Energy. 86 (5): 1245–1260. Bibcode:2012SoEn...86.1245N. doi:10.1016/j.solener.2012.01.017.
- Jochem, Andreas; Höfle Bernhard; Rutzinger Martin (2011). "Extraction of vertical walls from mobile laser scanning data for solar potential assessment". Remote Sensing. 3 (4): 650–667. Bibcode:2011RemS....3..650J. doi:10.3390/rs3030650.
- Lukač, Niko; Žlaus Danijel; Seme Seme; Žalik Borut; Štumberger Gorazd (2013). "Rating of roofs' surfaces regarding their solar potential and suitability for PV systems, based on LiDAR data". Applied Energy. 102: 803–812. doi:10.1016/j.apenergy.2012.08.042.
- "rFactor Pro - Laser Scanning Heaven". VirtualR.net - 100% Independent Sim Racing News. 2011-07-15. Retrieved 2020-06-04.
- Marsh, William (2017-06-30). "rFactor Pro Shows off LIDAR Scanned Hungaroring". Sim Racing Paddock. Retrieved 2020-06-04.
- "New Tracks in Project CARS 2 Were Laser-Scanned With Drones". GTPlanet. 2017-02-08. Retrieved 2020-06-04.
- Nick Parish (2008-07-13). "From OK Computer to Roll computer: Radiohead and director James Frost make a video without cameras". Creativity. Archived from the original on 2008-07-17.
Further reading
- Gil, Emilio; Llorens, Jordi; Llop, Jordi; Fàbregas, Xavier; Gallart, Montserrat (2013). "Use of a Terrestrial LIDAR Sensor for Drift Detection in Vineyard Spraying". Sensors. 13 (1): 516–534. doi:10.3390/s130100516. ISSN 1424-8220. PMC 3574688. PMID 23282583.
- Heritage, E. (2011). 3D laser scanning for heritage. Advice and guidance to users on laser scanning in archaeology and architecture. Available at www.english-heritage.org.uk. 3D Laser Scanning for Heritage | Historic England
- Heritage, G., & Large, A. (Eds.). (2009). Laser scanning for the environmental sciences. John Wiley & Sons. ISBN 1-4051-5717-8
- Maltamo, M., Næsset, E., & Vauhkonen, J. (2014). Forestry Applications of Airborne Laser Scanning: Concepts and Case Studies (Vol. 27). Springer Science & Business Media. ISBN 94-017-8662-3
- Shan, J., & Toth, C. K. (Eds.). (2008). Topographic laser ranging and scanning: principles and processing. CRC press. ISBN 1-4200-5142-3
- Vosselman, G., & Maas, H. G. (Eds.). (2010). Airborne and terrestrial laser scanning. Whittles Publishing. ISBN 1-4398-2798-2
External links
| Wikimedia Commons has media related to LIDAR. |
- National Oceanic and Atmospheric Administration (NOAA) (15 April 2020). "What is LIDAR?". NOAA's National Ocean Service.
- The USGS Center for LIDAR Information Coordination and Knowledge (CLICK) – A website intended to "facilitate data access, user coordination and education of lidar remote sensing for scientific needs."
- Free online lidar data viewer
- Lidar Industry News and Education
| Authority control |
|
|---|