Lake metabolism
Lake metabolism represents a lake's balance between carbon fixation (gross primary production) and biological carbon oxidation (ecosystem respiration)[1]. Whole-lake metabolism includes the carbon fixation and oxidation from all organism within the lake, from bacteria to fishes, and is typically estimated by measuring changes in dissolved oxygen or carbon dioxide throughout the day.[2]
.jpg)
Ecosystem respiration in excess of gross primary production indicates the lake receives organic material from the surrounding catchment, such as through stream or groundwater inflows or litterfall. Lake metabolism often controls the carbon dioxide emissions from or influx to lakes, but it does not account for all carbon dioxide dynamics since inputs of inorganic carbon from the surrounding catchment also influence carbon dioxide within lakes.[3][4]
Concept
Estimates of lake metabolism typically rely on the measurement of dissolved oxygen or carbon dioxide, or measurements of a carbon or oxygen tracer to estimate production and consumption of organic carbon. Oxygen is produced and carbon dioxide consumed through photosynthesis and oxygen is consumed and carbon dioxide produced through respiration.
Photosynthesis:

Respiration:

Photosynthesis and oxygen production only occurs in the presence of light, while the consumption of oxygen via respiration occurs in both the presence and absence of light. Lake metabolism terms include:
- GPP - gross primary production (e.g. total photosynthesis)
- R - total respiration
- - heterotrophic respiration
- - autotrophic respiration
- NEP - net ecosystem production = GPP - R
- NPP - net primary production = GPP -


Measurement techniques
Estimating lake metabolism requires approximating processes that influence the production and consumption of organic carbon by organisms within the lake. Cyclical changes on a daily scale occur in most lakes on Earth because sunlight is available for photosynthesis and production of new carbon only for a portion of the day. Researchers can take advantage of this diel pattern to measure rates of change in carbon itself or changes in dissolved gases such as carbon dioxide or oxygen that occur on a daily scale. Although daily estimates of metabolism are most common, whole-lake metabolism can be integrated over longer time periods such as seasonal or annual rates by estimating a whole-lake carbon budget. The following sections highlight the most common ways to estimate lake metabolism across a variety of temporal and spatial scales and go over some of the assumptions of each of these methods.
Free-water methods
Measurement of diel changes in dissolved gases within the lake, also known as the “free-water” method, has quickly become the most common method of estimating lake metabolism since the wide adoption of autonomous sensors used to measure dissolved oxygen and carbon dioxide in water[5][6][7]. The free-water method is particularly popular since many daily estimates of lake metabolism can be collected relatively cheaply and can give insights into metabolic regimes during difficult-to-observe time periods, such as during storm events. Measured changes in dissolved oxygen and carbon dioxide within a lake represents the sum of all organismal metabolism from bacteria to fishes, after accounting for abiotic changes in dissolved gases. Abiotic changes in dissolved gases include exchanges of dissolved gases between the atmosphere and lake surface, vertical or horizontal entrainment of water with differing concentrations (e.g. low-oxygen water below a lake’s thermocline), or import and export of dissolved gases from inflowing streams or a lake outlet. Abiotic changes in dissolved gases can dominate changes of dissolved gases if the lake has a low metabolic rate (e.g. oligotrophic lake, cloudy day), or if there is a large event that causes abiotic factors to exceed biotic (e.g. wind event causing mixing and entrainment of low-oxygenated water). Biotic signals in dissolved gases are most evident when the sun is shining and photosynthesis is occurring, resulting in the production of dissolved oxygen and consumption of carbon dioxide. The conversion of solar energy to chemical energy is termed gross primary production (GPP) and the dissipation of this energy through biological carbon oxidation is termed ecosystem respiration (ER). High-frequency (e.g. 10 minute interval) measurements of dissolved oxygen or carbon dioxide can be translated into estimates of GPP, ER, and the difference between the two termed Net Ecosystem Production (NEP), by fitting the high-frequency data to models of lake metabolism. The governing equation for estimating lake metabolism from a single sensor located in the upper mixed layer measuring dissolved oxygen is:
DO/t = GPP-ER+F
Where F is the flux of gases between the lake and the atmosphere. Additional terms of abiotic gas flux can be added if those abiotic fluxes are deemed significant for a lake (e.g. mixing events, inflowing stream gases). Atmospheric gas exchange (F) is rarely directly measured and typically modeled by estimating lake surface turbulence from wind-driven and convective mixing. Most often, F is estimated from measurements of wind speed and atmospheric pressure, and different models for estimating F can result in significantly different estimates of lake metabolic rates depending on the study lake (Dugan et al. 2016). Gross primary production is assumed to be zero during the night due to low or no light, and thus ER can be estimated from nighttime changes in dissolved oxygen (or carbon dioxide) after accounting for abiotic changes in dissolved oxygen. Gross primary production can be estimated assuming that ER is equal during the day and night and accounting for dissolved oxygen changes during the day, however, this assumption may not be valid in every lake (Sadro et al. 2014).
Extracting a high signal-to-noise ratio is key to obtaining good estimates of lake metabolism from the free-water technique, and there are choices that a researcher needs to make prior to collection data and during data analyses to ensure accurate estimates. Location of dissolved gas collection (typically in the surface mixed layer), number of sensors vertically and horizontally (see Van deBogart et al. 2012, Obrador et al. 2014, Gilling et al. 2017), frequency and duration of data collection, and modeling methods need to be considered (Staehr et al. 2012).
Free-water metabolism modeling techniques
The free-water measurement techniques require mathematical models to estimate lake metabolism metrics from high-frequency dissolved gas measurements. These models range in complexity from simple algebraic models to depth-integrated modeling using more advanced statistical techniques. Several statistical techniques have been used to estimate GPP, R, and NEP or parameters relating to these metabolism terms. Below is an incomplete list of statistical techniques used in lake metabolism models[1].
Bookkeeping
Ordinary least squares
Maximum likelihood
Kalman filter
Bayesian
Light and dark bottle methods
The light and dark bottle method uses the same concept as the free-water method to estimate rates of metabolism - GPP only occurs during the day with solar energy while ER occurs in both the presence and absence of light[8]. This method incubates lake water in two separate bottles, one that is clear and exposed to natural or artificial light regime and another that is sealed off from the light by wrapping the bottle in foil, paint, or another method. Changes in carbon fixation or dissolved gases are then measured over a certain time period (e.g. several hours to a day) to estimate the rate of metabolism for specific lake depths or an integrated lake water column. Carbon fixation is measured by injecting radioactive carbon isotope 14C into light and dark bottles and sampling the bottles over the time - the samples are filtered onto filter paper and the amount of 14C incorporated into algal (and bacterial) cells is estimated by measuring samples on a scintillation counter. The difference between the light and dark bottle 14C can be considered the rate of primary productivity; however, due to non-photosynthetic uptake of CO2 there is debate as to whether dark bottles should be used with the 14C method or if only a light bottle and a bottle treated with the algicide DCMU should be used. Rates of change in dissolved gases, either carbon dioxide or oxygen, need both the light and dark bottles to estimate rates of productivity and respiration.
Whole-lake carbon budget methods
Probably the most labor intensive method of estimating a metric of lake metabolism is by measuring all the inputs and outputs of either organic or inorganic carbon to a lake over a season or year, also known as a whole-lake carbon budget. Measuring all the inputs and outputs of carbon to and from a lake can be used to estimate net ecosystem production (NEP)[9][10]. Since NEP is the difference between gross primary production and respiration (NEP = GPP - R), it can be viewed as the net biological conversion of inorganic carbon to organic carbon (and vice versa), and can thus be determined through whole-lake mass balance of either inorganic or organic carbon[9]. NEP assessed through inorganic (IC) or organic carbon (OC) can be estimated as:


where E is export of OC through fluvial transport and IC through fluvial transport and carbon gas (e.g. CO2, CH4) exchange between the lake surface to the atmosphere; S is storage in the lake sediments and water column for OC and water column for IC; and I is the input of OC and IC from fluvial, surrounding wetland, and airborne pathways (e.g. atmospheric deposition, litterfall). A lake that receives more OC from the watershed than it exports downstream or accumulates in the water column and sediments (Ioc > Eoc + Soc) indicates that there was net conversion of OC to IC within the lake and is thus net heterotrophic (negative NEP). Likewise, a lake that accumulates and exports more IC than was received from the watershed (Sic + Eic > Iic) also indicates net conversion of OC to IC within the lake and is thus net heterotrophic.
Benthic metabolism methods
Although the free-water method likely contains some benthic metabolic signal, isolating the benthic contribution to whole-lake metabolism requires benthic-specific methods. Analogous to the light and dark bottle methods described above, lake sediment cores can be collected and changes in dissolved oxygen or carbon fixation can be used to estimate rates of primary productivity and respiration. Relatively new methods describe isolating the sediment-water interface with transparent domes and measure changes in dissolved oxygen in-situ, which is a hybrid between the free-water method and light-dark bottle method. These in-situ benthic chamber methods allow for relatively easy multi-day estimate of benthic metabolism, which helps the researcher determine how benthic metabolism changes with varying weather patterns and lake characteristics.
Relation to constituents
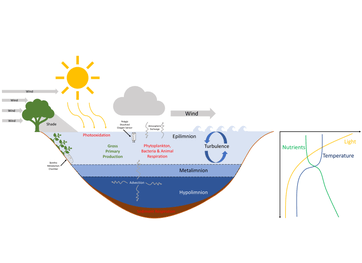
Organismal metabolic rate, or the rate at which organisms assimilate, transform, and expend energy, is influenced by a few key constituents, namely light, nutrients, temperature, and organic matter. The influence of these constituents on organismal metabolism ultimately governs metabolism at the whole-lake scale and can dictate whether a lake is a net source or sink of carbon. In the following section, we describe the relationship between these key constituents and organismal and ecosystem-level metabolism. Although relationships between organisms and constituents described here are well-established, interacting effects of constituents on metabolic rates from organisms to lake ecosystems makes predicting changes in metabolism across lakes or within lakes through time difficult. Many of these complex interacting effects will be discussed in the spatial and temporal variability section.
Temperature
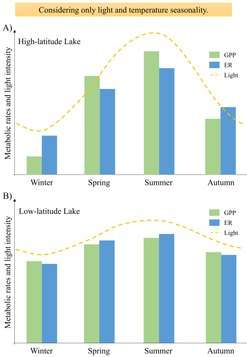
Temperature is a strong controlling factor on biochemical reaction rates and biological activity. Optimal temperature varies across aquatic organisms as some organisms are more cold-adapted while others prefer warmer habitats. There are rare cases of extreme thermal tolerance in hypersaline antarctic lakes (Don Jaun Pond example) or hot springs (find example); however, most lake organisms on Earth reside in temperatures ranging from 0 to 40 degrees C. Metabolic rates typically scale exponentially with temperature, however, the activation energy for primary productivity and respiration often differ, with photosynthesis having a lower activation energy than aerobic respiration. These differences in activation energies could have implications for net metabolic balance within lake ecosystems as the climate warms. For example, Scharfenberger et al. (2018) show that increasing water temperature resulting from climate change could switch lakes from being net autotrophic to heterotrophic due to differences in activation energy, however, the temperature at which they switch depends on the amount of nutrients available.
Nutrients
The amount of material available for assimilating into organismal cells controls the rate of metabolism at the cellular to lake ecosystem level. In lakes, phosphorus and nitrogen are the most common limiting nutrients of primary production and ecosystem respiration. Foundational work on the positive relationship between phosphorus concentration and lake eutrophication resulted in legislation that limited the amount of phosphorus in laundry detergents, among other regulations[11][12]. Although phosphorus is often used as a predictor of lake ecosystem productivity and excess phosphorus as an indicator of eutrophication, many studies show that metabolism is co-limited by phosphorus and nitrogen or nitrogen alone (Elser et al. 2007). The balance between phosphorus, nitrogen, and other nutrients, termed ecological stoichiometry, can dictate rates of organismal growth and whole-lake metabolism through cellular requirements of these essential nutrients mediated by life-history traits. For example, fast-growing cladocerans have a much lower N:P ratio than copepods, mostly due to the high amount of phosphorus-rich RNA in their cells used for rapid growth. Cladocerans residing in lakes with high N:P ratios relative to cladoceran body stoichiometry will be limited in growth and metabolism, having effects on whole-lake metabolism. Furthermore, cascading effects from food web manipulations can cause changes in productivity from changes to nutrient stoichiometry. For example, piscivore addition can reduce predation pressure on fast-growing, low N:P cladocerans which increase in population rapidly, retain phosphorus in their cells, and can cause a lake to become phosphorus limited, consequently reducing whole-lake primary productivity.
Light
Solar energy is required for converting carbon dioxide and water into organic matter, otherwise known as photosynthesis. As with temperature and nutrients, different algae have different rates of metabolic response to increasing light and also different optimal light conditions for growth. These different responses at the organismal level propagate up to influence metabolism at the ecosystem level. Even in low-nutrient lakes, light can be the limiting resource for primary productivity, which has cascading negative effects on higher trophic levels such as fish productivity (Karlsson et al. 2009). Variability in light in different lake zones and within a lake through time creates patchiness in productivity both spatially and temporally.
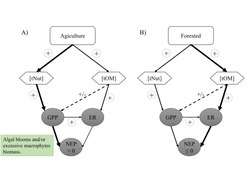
Organic carbon
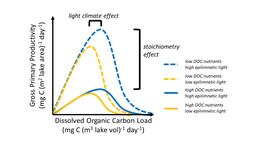
Primary and secondary consumers in lakes require organic matter (either from plants or animals) to maintain organismal function. Organic matter including tree leaves, dissolved organic matter, and algae provide essential resources to these consumers and in the process increase lake ecosystem respiration rates in the conversion of organic matter to cellular growth and organismal maintenance. Some sources of organic matter may impact the availability of other constituents. For example, dissolved organic matter often darkens lake water which reduces the amount of light available in the lake, thus reducing primary production. Increase in organic matter loading to a lake can also increase nutrients that are associated with the organic matter, which can stimulate primary production and respiration. Tradeoffs between increasing light limitation and release from nutrient limitation with increased dissolved organic matter can create non-linear relationships between lake primary production and dissolved organic matter concentration (potential figure of GPP ~ [DOC]). This is because as dissolved organic matter concentration increases at low dissolved organic matter concentrations, increased associated nutrients increases GPP. But as dissolved organic matter continues to increase, the reduction in light from the darkening of the lake water suppresses GPP as light becomes the limiting resource for primary productivity. The darkening of the lake water can also change thermal regimes within the lake as darker waters typically mean that warmer waters remain at the top of the lake while cooler waters are at the bottom. This change in heat energy distribution can impact the rates of pelagic and benthic productivity.
Other constituents
Other lake constituents can influence lake metabolic rates including CO2 concentration, pH, salinity, and silica, among others. CO2 can be a limiting (or co-limiting along with other nutrients) resource for primary productivity[14] and can promote more intense phytoplankton blooms[15]. Some algal species, such as chrysophytes, may not have carbon-concentrating mechanisms or the ability to use bicarbonate as a source of inorganic carbon for photosynthesis, thus, elevated levels of CO2 may increase their rates of photosynthesis. During algal blooms, elevated dissolved CO2 ensures that CO2 is not a limiting resource for growth since rapid increases in production deplete CO2 and raise pH. Changes in pH at short time scales (e.g. sub-daily) from spikes in primary productivity may cause short-term reductions in bacterial growth and respiration, but at longer timescales, bacterial communities can adapt to elevated pH[16][17].
Salinity can also cause changes in metabolic rates of lakes through salinity impacts on individual metabolic rates and community composition[18][19][20]. Lake metabolic rates can be correlated both positively or negatively with salinity due to interactions of salinity with other drivers of ecosystem metabolism, such as flushing rates or droughts[21]. For example, Moreira-Turcq (2000)[22] found that excess precipitation over evaporation caused reduced salinity in a coastal lagoon, increased nutrient loading, and increased pelagic primary productivity. The positive relationship between primary productivity and salinity might be an indicator of changes in nutrient availability due to increased inflows. However, salinity increases from road salts[23] can cause toxicity in some lake organisms[24], and extreme cases of salinity increases can restrict lake mixing which could change distribution of metabolism rates throughout the lake water column.
See also
References
- Winslow, Luke A.; Zwart, Jacob A.; Batt, Ryan D.; Dugan, Hilary A.; Woolway, R. Iestyn; Corman, Jessica R.; Hanson, Paul C.; Read, Jordan S. (January 2016). "LakeMetabolizer: an R package for estimating lake metabolism from free-water oxygen using diverse statistical models". Inland Waters. 6 (4): 622–636. doi:10.1080/iw-6.4.883. ISSN 2044-2041.
- Hanson, Paul C.; Bade, Darren L.; Carpenter, Stephen R.; Kratz, Timothy K. (2003). "Lake metabolism: Relationships with dissolved organic carbon and phosphorus". Limnology and Oceanography. 48 (3): 1112–1119. doi:10.4319/lo.2003.48.3.1112. ISSN 1939-5590.
- Bogard, Matthew J.; Giorgio, Paul A. del (2016). "The role of metabolism in modulating CO2 fluxes in boreal lakes". Global Biogeochemical Cycles. 30 (10): 1509–1525. doi:10.1002/2016GB005463. ISSN 1944-9224.
- Wilkinson, Grace M.; Buelo, Cal D.; Cole, Jonathan J.; Pace, Michael L. (2016). "Exogenously produced CO2 doubles the CO2 efflux from three north temperate lakes". Geophysical Research Letters. 43 (5): 1996–2003. doi:10.1002/2016GL067732. ISSN 1944-8007.
- Porter, John H.; Hanson, Paul C.; Lin, Chau-Chin (2012-02-01). "Staying afloat in the sensor data deluge". Trends in Ecology & Evolution. 27 (2): 121–129. doi:10.1016/j.tree.2011.11.009. ISSN 0169-5347. PMID 22206661.
- Cole, Jonathan J.; Pace, Michael L.; Carpenter, Stephen R.; Kitchell, James F. (December 2000). "Persistence of net heterotrophy in lakes during nutrient addition and food web manipulations". Limnology and Oceanography. 45 (8): 1718–1730. doi:10.4319/lo.2000.45.8.1718. ISSN 0024-3590.
- Hofmann, Hilmar; Encinas-Fernández, Jorge; Tengberg, Anders; Atamanchuk, Dariia; Peeters, Frank (2016-12-21). "Lake Metabolism: Comparison of Lake Metabolic Rates Estimated from a Diel CO2- and the Common Diel O2-Technique". PLOS ONE. 11 (12): e0168393. doi:10.1371/journal.pone.0168393. ISSN 1932-6203. PMC 5176309. PMID 28002477.
- Bender, Michael; Grande, Karen; Johnson, Kenneth; Marra, John; Williams, Peter J. LeB.; Sieburth, John; Pilson, Michael; Langdon, Chris; Hitchcock, Gary (September 1987). "A comparison of four methods for determining planktonic community production1". Limnology and Oceanography. 32 (5): 1085–1098. doi:10.4319/lo.1987.32.5.1085. ISSN 0024-3590.
- Stets, Edward G.; Striegl, Robert G.; Aiken, George R.; Rosenberry, Donald O.; Winter, Thomas C. (2009). "Hydrologic support of carbon dioxide flux revealed by whole-lake carbon budgets". Journal of Geophysical Research: Biogeosciences. 114 (G1). doi:10.1029/2008JG000783. ISSN 2156-2202.
- Lovett, Gary M.; Cole, Jonathan J.; Pace, Michael L. (2006-02-01). "Is Net Ecosystem Production Equal to Ecosystem Carbon Accumulation?". Ecosystems. 9 (1): 152–155. doi:10.1007/s10021-005-0036-3. ISSN 1435-0629.
- "USGS WRI99-4007 Review of Phosphorus Control Measures in the United States and Their Effects on Water Quality". pubs.usgs.gov. Retrieved 2020-06-28.
- Kogawa, Ana Carolina; Cernic, Beatriz Gamberini; do Couto, Leandro Giovanni Domingos; Salgado, Hérida Regina Nunes (2017-09-01). "Synthetic detergents: 100years of history". Saudi Pharmaceutical Journal. 25 (6): 934–938. doi:10.1016/j.jsps.2017.02.006. ISSN 1319-0164.
- Kelly, Patrick T.; Solomon, Christopher T.; Zwart, Jacob A.; Jones, Stuart E. (2018-11-01). "A Framework for Understanding Variation in Pelagic Gross Primary Production of Lake Ecosystems". Ecosystems. 21 (7): 1364–1376. doi:10.1007/s10021-018-0226-4. ISSN 1435-0629.
- Jansson, Mats; Karlsson, Jan; Jonsson, Anders (2012). "Carbon dioxide supersaturation promotes primary production in lakes". Ecology Letters. 15 (6): 527–532. doi:10.1111/j.1461-0248.2012.01762.x. ISSN 1461-0248.
- Verspagen, Jolanda M. H.; Waal, Dedmer B. Van de; Finke, Jan F.; Visser, Petra M.; Donk, Ellen Van; Huisman, Jef (2014-08-13). "Rising CO2 Levels Will Intensify Phytoplankton Blooms in Eutrophic and Hypertrophic Lakes". PLOS ONE. 9 (8): e104325. doi:10.1371/journal.pone.0104325. ISSN 1932-6203. PMC 4132121. PMID 25119996.
- Tank, Suzanne E.; Lesack, Lance F. W.; McQueen, Donald J. (2009). "Elevated pH regulates bacterial carbon cycling in lakes with high photosynthetic activity". Ecology. 90 (7): 1910–1922. doi:10.1890/08-1010.1. ISSN 1939-9170.
- Christensen, Jesper P. A.; Sand‐Jensen, Kaj; Staehr, Peter A. (2013). "Fluctuating water levels control water chemistry and metabolism of a charophyte-dominated pond". Freshwater Biology. 58 (7): 1353–1365. doi:10.1111/fwb.12132. ISSN 1365-2427.
- Comte, Jérôme; Langenheder, Silke; Berga, Mercè; Lindström, Eva S. (2017). "Contribution of different dispersal sources to the metabolic response of lake bacterioplankton following a salinity change". Environmental Microbiology. 19 (1): 251–260. doi:10.1111/1462-2920.13593. ISSN 1462-2920.
- Jiang, Hongchen; Dong, Hailiang; Yu, Bingsong; Liu, Xinqi; Li, Yiliang; Ji, Shanshan; Zhang, Chuanlun L. (2007). "Microbial response to salinity change in Lake Chaka, a hypersaline lake on Tibetan plateau". Environmental Microbiology. 9 (10): 2603–2621. doi:10.1111/j.1462-2920.2007.01377.x. ISSN 1462-2920.
- Toepfer, Conrad; Barton, Michael (1992-09-01). "Influence of salinity on the rates of oxygen consumption in two species of freshwater fishes, Phoxinus erythrogaster (family Cyprinidae), and Fundulus catenatus (family Fundulidae)". Hydrobiologia. 242 (3): 149–154. doi:10.1007/BF00019963. ISSN 1573-5117.
- Alfonso, María Belén; Brendel, Andrea Soledad; Vitale, Alejandro José; Seitz, Carina; Piccolo, María Cintia; Perillo, Gerardo Miguel Eduardo (2018). "Drivers of Ecosystem Metabolism in Two Managed Shallow Lakes with Different Salinity and Trophic Conditions: The Sauce Grande and La Salada Lakes (Argentina)". Water. 10 (9): 1136. doi:10.3390/w10091136.
- Moreira-Turcq, Patricia F. (2000-06-01). "Impact of a low salinity year on the metabolism of a hypersaline coastal lagoon (Brazil)". Hydrobiologia. 429 (1): 133–140. doi:10.1023/A:1004037624787. ISSN 1573-5117.
- Dugan, Hilary A.; Bartlett, Sarah L.; Burke, Samantha M.; Doubek, Jonathan P.; Krivak-Tetley, Flora E.; Skaff, Nicholas K.; Summers, Jamie C.; Farrell, Kaitlin J.; McCullough, Ian M.; Morales-Williams, Ana M.; Roberts, Derek C. (2017-04-25). "Salting our freshwater lakes". Proceedings of the National Academy of Sciences. 114 (17): 4453–4458. doi:10.1073/pnas.1620211114. ISSN 0027-8424. PMID 28396392.
- Corsi, Steven R.; Graczyk, David J.; Geis, Steven W.; Booth, Nathaniel L.; Richards, Kevin D. (2010-10-01). "A Fresh Look at Road Salt: Aquatic Toxicity and Water-Quality Impacts on Local, Regional, and National Scales". Environmental Science & Technology. 44 (19): 7376–7382. doi:10.1021/es101333u. ISSN 0013-936X. PMC 2947309. PMID 20806974.