Labor force in the United States
The labor force (workforce in British English) is the actual number of people available for work and is the sum of the employed and the unemployed. The U.S. labor force reached a high of 164.6 million persons in February 2020, just at the start of the COVID-19 pandemic in the United States.[1] The Bureau of Labor Statistics (BLS) defines the labor force thus: "Included are persons 16 years of age and older residing in the 50 States and the District of Columbia who are not inmates of institutions (for example, penal and mental facilities, homes for the aged), and who are not on active duty in the Armed Forces."[2] The U.S. labor force has risen each year since 1960, with the exception of the period following the Great Recession, when it remained below 2008 levels from 2009-2011.[1]

The labor force participation rate, LFPR (or economic activity rate, EAR), is the ratio between the labor force and the overall size of their cohort (national population of the same age range). Much as in other countries, the labor force participation rate in the U.S. increased significantly in the West during the later half of the 20th century, largely because women entering the workplace in increasing numbers.
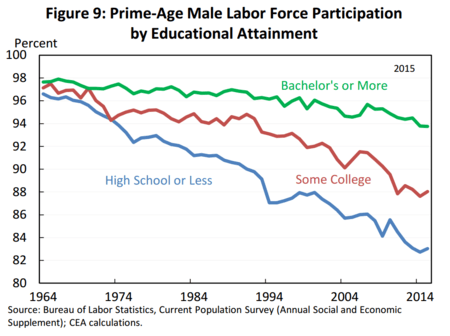
In the U.S., the overall labor force participation rate has declined steadily since 2000, primarily because of the aging and retirement of the Baby Boom generation. Analyzing labor force participation trends in the prime working age (25-54) cohort helps separate the impact of an aging population from other demographic factors (e.g., gender, race, and education) and government policies. The Congressional Budget Office explained in 2018 that higher educational attainment is correlated with higher labor force participation for workers aged 25–54. Prime-aged men tend to be out of the labor force because of disability, while a key reason for women is caring for family members.[3]
Gender and the US labor force
Women
In the United States, there were three significant stages of women’s increased participation in the labor force. During the late 19th century through the 1920s, very few women worked. Working women were often young single women who typically withdrew from labor force at marriage unless their family needed two incomes. These women worked primarily in the textile manufacturing industry or as domestic workers. This profession empowered women and allowed them to earn a living wage. At times, they were a financial help to their families.
Between 1930 and 1950, female labor force participation increased primarily due to the increased demand for office workers, women participating in the high school movement, and electrification which reduced the time spent on household chores. In the 1950s to the 1970s, most women were secondary earners working mainly as secretaries, teachers, nurses, and librarians (pink-collar jobs).
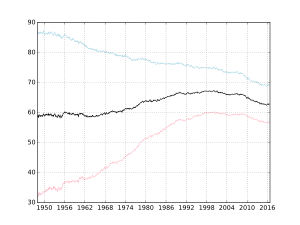
Claudia Goldin and others, specifically point out that by the mid-1970s there was a period of revolution of women in the labor force brought on by different factors. Women more accurately planned for their future in the work force, choosing more applicable majors in college that prepared them to enter and compete in the labor market. In the United States, the labor force participation rate rose from approximately 59% in 1948 to 66% in 2005,[4] with participation among women rising from 32% to 59%[5] and participation among men declining from 87% to 73%.[6][7]
A common theory in modern economics claims that the rise of women participating in the US labor force in the late 1960s was due to the introduction of a new contraceptive technology, birth control pills, and the adjustment of age of majority laws. The use of birth control gave women the flexibility of opting to invest and advance their career while maintaining a relationship. By having control over the timing of their fertility, they were not running a risk of thwarting their career choices. However, only 40% of the population actually used the birth control pill. This implies that other factors may have contributed to women choosing to invest in advancing their careers.
Another factor that may have contributed to the trend was the Equal Pay Act of 1963, which aimed at abolishing wage disparity based on sex. Such legislation diminished sexual discrimination and encouraged more women to enter the labor market by receiving fair remuneration to help raise children.
Historical Trends
According to the US Census in 1861, one third of women were in the labor force and of these one fourth were married women.[8]
According to Ellen DuBoise and Lynn Dumenil, they estimate that the number of women in the labor force from 1800 - 1900 are:[9]
| By Year | % Women in Labor force | Women as % of Total Labor Force |
|---|---|---|
| 1800 | 4.6% | 4.6% |
| 1810 | 7.9% | 9.4% |
| 1820 | 6.2% | 7.3% |
| 1830 | 6.4% | 7.4% |
| 1840 | 8.4% | 9.6% |
| 1850 | 10.1% | 10.8% |
| 1860 | 9.7% | 10.2% |
| 1870 | 13.7% | 14.8% |
| 1880 | 14.7% | 15.2% |
| 1890 | 18.2% | 17.0% |
| 1900 | 21.2% | 18.1% |
According to the US Department of Labor, as of 2017 women make up 47% of the total labor force with 70% of them mothers with children under 18 years of age.[10]
Men
Men's labor force participation has been falling consistently since at least the 1960s.[11] This applies to both the overall and prime working age (25-54), as discussed in the analysis section below.
Analyzing the LFPR
Overall rate
From 1962 to 1999, women entering the U.S. workforce represented a nearly 8 percentage point increase in the overall LFPR.[13] The U.S. overall LFPR (age 16+) has been falling since its all-time high point of 67.3% reached in January–April 2000, reaching 62.7% by January 2018.[14] This decline since 2000 is primarily driven by the retirement of the Baby Boom generation. Since the overall labor force is defined as those age 16+, an aging society with more persons past the typical prime working age (25-54) exerts a steady downward influence on the LFPR. The decline was forecast by economists and demographers going back into the 1990s, if not earlier. For example, during 1999 the BLS forecast that the overall LFPR would be 66.9% in 2015 and 63.2% in 2025.[15] A 2006 forecast by Federal Reserve economists (i.e., before the Great Recession that began in December 2007) estimated the LFPR would be below 64% by 2016, close to the 62.7% average that year.[16]
The labor force participation rate decreases when the percentage increase in the defined population (denominator) is greater than the percentage increase in the labor force (i.e., the sum of employed and unemployed, the numerator). With respect to the unemployment rate, if the percentage increase in the number of unemployed (numerator) is greater than the percentage increase in the number in the labor force (denominator), the unemployment rate will rise.[17]
Prime working age rate
Economists also analyze the LFPR for those prime-aged workers, aged 25–54. Mathematically, this ratio is computed with a numerator (labor force age 25-54) and denominator (civilian population age 25-54). This can help remove the impact of aging demographics, to better understand trends among working-aged persons. The prime-aged LFPR peaked at 84.5% at three times between October 1997 and April 2000. Prior to the Great Recession, the rate was 83.3% in November 2007, then fell to a trough of 80.5% in July 2015, before steadily climbing back to 81.7% in January 2018.[18] It is one of the few key labor market variables that had yet to recover its pre-crisis level as of January 2018 and is an indicator of slack in the labor market.[19]
- Men's prime-aged labor force participation has been falling consistently since at least the 1960s. It ranged between 93-95% during the 1980s, fell to around 90% during the 2000s and was 88.5% in October 2017.[20] Higher labor force participation is correlated with higher educational attainment.
- Women's prime-aged labor force participation rose consistently from at least the early 1960s, reaching a peak of 77.2% in August 1997. It has fluctuated around 75% since then, resisting the decline in men's prime age participation.[21] Women have increased their educational attainment relative to men.
The Congressional Budget Office explained in 2018 higher educational attainment is correlated with higher labor force participation. Prime-aged men tend to be out of the labor force due to disability, while a key reason for women is caring for family members. To the extent an aging population requires the assistance of prime-aged family members at home, this also presents a downward pressure on this cohort's participation.[3]
Teen Labor Force Participation
In 1979, there had been the highest teen labor force participation rate with 57.9 percent of teens participating.[22]In the early 21st century, there had been a drastic decrease in the teen labor force participation rate with the decrease expected to only decline more from 2017 to 2024.[22]
The reason for the decrease in teen labor force participation was the environment teens were in, including pressures by their family.[22] The environment pressured many to go to college, summer school became more prevalent, and schoolwork became more exhausting.[22] The cost of college has risen over the years, but it has not persuaded teens not to go to college. There is a higher number of teens requesting assistance to attend college.[22] There is an increased number of teens attending school and a decreased number of teens participating in the labor force.[22]
Teens who do not want to attend college have competition from individuals that are more experienced such as individuals who have graduated from college with a degree, individuals that are adults, and individuals from other countries that move to the United States and try to obtain jobs.[22] This has also contributed to the decrease in teen labor force participation.[22]
Foreign-born (Immigrants)
There were 27.8 million foreign-born workers in the labor force as of January 2018.[23] This group had an overall LFPR of 65.1% in January 2018.[24] As of 2013, the highest group of people participating in the Foreign-born immigrant labor force in the United States were individuals from Mexico and Central America.[25] They made up of 40.3 percent of the immigrant labor force participation.[25] Mexico heavily outweighed Central America in which they held the majority of workers with 32 percent of workers just from Mexico.[25] In 2013, California held most of the foreign-born worker immigrants in the United States, with about half from Mexico and Central America.[25]
Foreign-born (Immigrant) Women
Since 1960, foreign-born immigrant women have the lowest labor market participation rate between all of the groups in the United States.[26] The groups include immigrant men and individuals born in the United States.[26] Foreign-born immigrant women participate in the labor force between 75 and 78 percent lower than native born males.[26] In terms of labor force participation, the foreign-born immigrant women from Mexico and Central America are the smallest number of participants in the labor force.[27] As far as foreign-born immigrants that are trying to participate in the labor force but cannot find employment, the unemployment rates are as follows. The unemployment are foreign-born immigrant women workers (9.1 percent), native women workers (7.9 percent), Mexico and Central American foreign-born immigrant women workers (12.1 percent), and other foreign-born immigrant women workers (7.7 percent).[27]
Foreign-born (Immigrant) Men
In terms of labor force participation, the foreign-born immigrant men from Mexico and Central America are the largest number of participants in the labor force.[27] The number of potential labor force participants for foreign-born immigrant men are foreign-born immigrant men workers (9.9 percent), native men workers (10.4 percent), Mexico and Central American foreign-born immigrant men workers (11.4 percent), and other foreign-born immigrant men workers (8.6 percent).[27] Foreign-born immigrant men have a similar unemployment rate to native workers, but the unemployment rate for foreign-born immigrant men that are from Mexico and Central America is considerably more than other groups of foreign-born immigrant men looking for work in the United States.[27]
International comparison
For 2017, the Central Intelligence Agency ranked the U.S. as having the fourth largest labor force in the world at about 160 million, behind China (807 million), India (522 million), and the European Union (235 million).[28]
See also
References
- "Civilian Labor Force". FRED. Retrieved March 26, 2020.
- "BLS Glossary". Retrieved 15 October 2014.
- CBO-Factors Affecting the Labor Force Participation of People Ages 25 to 54-February 7, 2018
- "Bureau of Labor Statistics Data". Retrieved 15 October 2014.
- "Bureau of Labor Statistics Data". Retrieved 15 October 2014.
- Breaking down the male participation rate by age bracket shows a marked decline in participation among men 55 and over from approximately 71% in 1948 to 44% in 2005 . Among younger age groups a decline is noticeable, but not nearly as drastic.
- "8=2006&from_month=9". Retrieved 15 October 2014.
- Yalom, Marilyn (2002). A History of the Wife. New York: Perennial. p. 188. ISBN 0060931566.
- DuBois, Ellen Carol; Dumenil, Lynn (2009). Through Women's Eyes : An American History with Documents (2nd ed.). Boston: Bedford/St. Martin's. p. 338. ISBN 0312468873.
- "12 Stats about Working Women". US Department of Labor. March 1, 2017.
- "Civilian Labor Force Participation Rate - Men". FRED. Retrieved February 18, 2018.
- "White House Council of Economic Advisors-The Long-Term Decline in Prime-Age Male Labor Force Participation-June 2016-Page 13" (PDF). Whitehouse.gov. Retrieved 4 October 2017.
- CEPR-Multiple Authors-Understanding the decline in the labour force participation rate in the United States-August 2014
- "Civilian Labor Force Participation Rate". FRED. Retrieved February 18, 2018.
- BLS-Howard Fullerton-Labor force participation: 75 years of change, 1950–98 and 1998–2025-December 1999
- Board of Governors of the Federal Reserve System-The Recent Decline in the Labor Force Participation Rate and Its Implications for Potential Labor Supply-See Figure 3-2006
- Peter Barth and Dennis Heffley "Taking Apart Taking Part: Local Labor Force Participation Rates" Archived 2007-07-01 at the Wayback Machine University of Connecticut, 2004.
- "Civilian Labor Force Participation Rate Age 25-54". FRED. Retrieved February 18, 2018.
- Bloomberg-Jamrisko et. al-Yellen's Labor Market Dashboard-February 2, 2018
- "Civilian Labor Force Participation Rate - Men Aged 25-54". FRED. Retrieved February 18, 2018.
- "Civilian Labor Force Participation Rate - Women Aged 25-54". FRED. Retrieved February 18, 2018.
- Morisi, Teresa (January 1, 2017). "Teen Labor Force Participation before and after the Great Recession and beyond". Monthly Labor Review – via EBSCOhost.
- "Civilian Labor Force: Foreign Born". FRED. Retrieved February 18, 2018.
- "Civilian Labor Force Participation Rate Foreign Born". FRED. Retrieved February 18, 2018.
- Cordero-Guzman, Hector (May 2013). "Immigrant Labor and the U.S. Economy: A Profile". New Labor Forum. 22: 16–27 – via EBSCOhost.
- Donato, Katherine; Piya, Bhumika; Jacobs, Anna (September 1, 2014). "The Double Disadvantage Reconsidered: Gender, Immigration, Marital Status, and Global Labor Force Participation in the 21st Century". International Migration Review. 48: 335–364 – via EBSCOhost.
- Cordero-Guzman, Hector (May 2013). "Immigrant Labor and the U.S. Economy: A Profile". New Labor Forum. 22: 16–27 – via EBSCOhost.
- CIA World Factbook-Country Comparison on Labor Force-Retrieved February 20, 2018
External links
| Library resources about Labour force |